Aroma Chemicals Market

Aroma Chemicals Market Analysis, By Application, By Source, By Compound, By Type, and Region - Market Insights 2025 to 2035

Analysis of Aroma Chemicals Market Covering 30+ Countries Including Analysis of US, Canada, UK, Germany, France, Nordics, GCC countries, Japan, Korea and many more

Aroma Chemicals Market Outlook (2025 to 2035)

The global aroma chemicals market is projected to grow from USD 5,562.1 million in 2025 to USD 8,804.5 million by 2035, with an annual growth rate of 4.7%, driven by rising demand in the personal care, home care, and food and beverage sectors, particularly in the Asia Pacific.

While synthetic compounds dominate due to cost and scalability, natural aroma chemicals are gaining traction amid clean-label and sustainability trends. Leading players, such as Givaudan and BASF, are expanding capacity and investing in biotech innovations to meet evolving consumer preferences and regulatory standards.

Metric Value
Industry Size (2025E) USD 5,562.1 million
Industry Size (2035F) USD 8,804.5 million
CAGR (2025 to 2035) 4.7%

What are the Drivers of the Aroma Chemicals Market?

The growth of the global market is driven by rising demand across the personal care, home care, fine fragrance, and food & beverage sectors. Consumers are placing greater emphasis on product sensory experience, leading manufacturers to invest in scent innovation as a point of differentiation.

The shift toward natural and sustainable ingredients, driven by clean-label trends and environmental regulations, is prompting an increased use of bio-based aroma chemicals, despite their higher cost. In parallel, advancements in formulation technologies, such as encapsulation and controlled-release systems, are enhancing the stability and longevity of fragrances in end-use applications. Regulatory frameworks, such as REACH and IFRA guidelines, are also reshaping the ingredient landscape, encouraging the development of safer and compliant alternatives.

Additionally, growth in emerging economies of Asia Pacific is expanding the consumer base, supported by rising incomes and urbanization. Industry players are responding through capacity expansion, strategic partnerships, and mergers and acquisitions (M&A) activity, positioning themselves to meet evolving demand and regulatory expectations.

What are the Regional Trends in the Aroma Chemicals Market?

Asia Pacific leads the market in terms of both volume and growth potential. The region accounted for over 30% of global demand in recent years, driven by strong usage in India, China, Japan, and Southeast Asia. Rapid urbanization, expanding middle-class populations, and rising personal care expenditures are contributing to higher uptake of scented products.

Additionally, the growing presence of contract manufacturers and regional fragrance formulators is boosting domestic production of aroma ingredients. China, in particular, is a major hub for synthetic aroma chemicals, while India is seeing increased interest in natural extracts.

North America continues to show steady demand in the fine fragrance, personal care, and food & beverage sectors. The market is influenced by a preference for high-quality, allergen-free, and sustainable ingredients, aligning with strict regulatory expectations under the FDA and IFRA guidelines. The USA market remains a stronghold for innovation in bio-based aroma chemistry, supported by active R&D and strategic investments by global leaders like IFF and Givaudan.

Europe remains a mature and regulated market, with significant activities in Germany, France, and Switzerland. Consumer preference for clean-label and environmentally conscious products is shaping demand in cosmetics and household care segments. Regulatory compliance under REACH and increasing restrictions on certain synthetic compounds are prompting a shift toward safer and greener alternatives. The region is also home to several leading aroma chemical producers, including Symrise and Firmenich, which continue to invest in sustainable production and ingredient traceability.

Latin America is an emerging growth market supported by the increasing adoption of personal care and hygiene products. Brazil and Mexico are leading markets due to their large population bases and expanding middle class. The region is witnessing rising demand for affordable fragrances and locally sourced ingredients, which is encouraging investment in regional production capabilities.

The Middle East and Africa show moderate but growing interest, driven by increasing urbanization, tourism, and investments in premium personal care and home care products. The Gulf states, in particular, are witnessing a growing preference for luxury and custom fragrances, driving imports and local blending activities.

What are the Challenges and Restraining Factors in the Aroma Chemicals Market?

Despite steady growth, the aroma chemicals market faces operational challenges that could limit its expansion. One of the primary restraints is the volatile pricing and limited availability of raw materials, especially for natural aroma compounds. Natural sources, such as essential oils and botanical extracts, are sensitive to climate conditions, agricultural yield variations, and geopolitical instability. This unpredictability impacts cost structures and supply continuity for manufacturers relying on natural inputs. For example, fluctuations in the supply of citrus oils or patchouli can affect production costs for fragrance formulations.

Another key challenge is regulatory pressure and compliance complexity. The market operates under stringent safety and environmental standards enforced by bodies such as REACH (Europe), the FDA (USA), and IFRA (International Fragrance Association). These regulations restrict or phase out the use of several widely used synthetic compounds linked to allergens, toxicity, or environmental persistence. As a result, companies are compelled to reformulate their products and invest in costly safety testing and the development of alternative ingredients.

The high cost of developing and commercializing new aroma molecules also presents a barrier for smaller players. R&D in this sector involves long lead times, extensive toxicological assessments, and compliance validation. This makes it difficult for emerging firms to compete with large, established players that already possess integrated research infrastructure and global distribution networks.

Country-Wise Outlook

Evolving Consumer Preferences and Sustainability Drive Growth in the USA Aroma Chemicals Market

Aroma Chemicals Market Cagr Analysis By Country

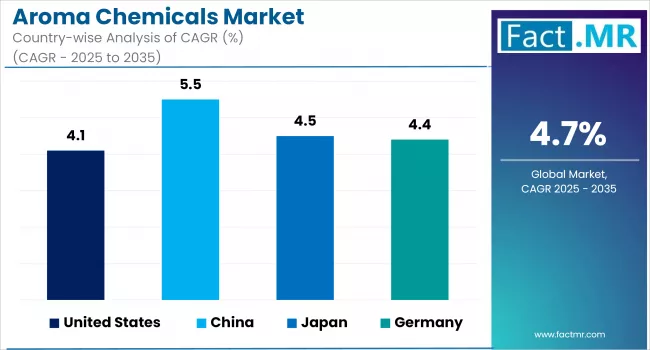
The United States aroma chemicals market is experiencing steady growth, driven by rising demand across the personal care, home care, and food and beverage sectors. Shifting consumer preferences toward natural, sustainable, and allergen-free products are prompting manufacturers to innovate with bio-based and clean-label fragrance ingredients. While synthetic aroma chemicals remain dominant due to their stability and cost-effectiveness, natural variants are gaining traction as brands reposition their portfolios to align with evolving regulatory and consumer expectations.

The personal care industry continues to be a key consumer of aroma chemicals in skincare, haircare, and fine fragrances, where scent plays a critical role in product differentiation. At the same time, the food and beverage industry is incorporating aroma compounds in flavored beverages, snacks, and bakery products, supported by advancements in encapsulation and controlled-release technologies.

Regulatory compliance, especially with FDA and IFRA standards, remains a critical factor influencing ingredient sourcing and formulation strategies. To maintain market relevance, manufacturers are investing in safer, traceable, and sustainable solutions, positioning the USA market as both a mature and forward-looking space in the global aroma chemicals landscape.

China’s Aroma Chemicals Market Driven by Industrial Expansion and Shifting Consumer Trends

China's aroma chemicals market is transforming, supported by strong industrial infrastructure, growing domestic consumption, and evolving regulatory standards. As the world’s leading manufacturer and one of the largest consumers of aroma chemicals, China plays a central role in the global supply chain for synthetic compounds such as terpenoids, esters, and benzenoids.

The country’s well-established chemical manufacturing base allows for competitive large-scale production, making it a key exporter of aroma ingredients to regions including Southeast Asia, Europe, and North America. At the same time, domestic demand is rising due to increased usage of personal care, household care, and packaged food products. Rapid urbanization and growing disposable incomes are accelerating this trend among younger demographics seeking premium and lifestyle-oriented products.

Consumer preferences in China are shifting toward higher-quality and safer formulations, prompting both international and domestic brands to focus on product reformulation using cleaner, natural fragrance ingredients. In response, several manufacturers are investing in bio-based aroma chemicals and green production technologies to meet emerging regulatory requirements and capture environmentally conscious market segments.

Regulatory bodies in China are progressively aligning with global standards such as those set by IFRA and REACH. This is pushing local producers to enhance compliance and transparency in ingredient sourcing and labeling. In addition, e-commerce platforms and digital marketing channels are enabling fragrance and personal care brands to scale quickly, increasing demand for unique and differentiated aroma profiles.

Japan Sees Steady Growth Driven by Innovation and Consumer Sophistication

Japan’s aroma chemicals market is evolving steadily, shaped by high consumer expectations, advanced product innovation, and a strong cultural emphasis on sensory experience. The country’s care, home care, and wellness sectors continue to prioritize subtle, functional fragrances, contributing to a consistent rise in demand for specialized aroma compounds.

Japanese consumers show a strong preference for clean, hypoallergenic, and natural formulations. This is driving greater use of bio-based and low-sensitizer aroma chemicals, especially in skincare, bath products, and household goods. The focus on ingredient transparency, backed by strict domestic labeling regulations, is pushing both local and international manufacturers to reformulate products with safer and traceable fragrance components.

Esters and aldehydes are widely used across the Japanese market, with esters seeing strong demand due to their applications in both fine fragrances and functional consumer goods. Leading domestic firms such as Takasago, T. Hasegawa, and Mitsubishi Gas Chemical are actively investing in R&D to enhance formulation performance, shelf stability, and scent longevity. These companies are also exploring sustainable production methods, including fermentation-based aroma synthesis and microencapsulation technologies.

Category-wise Analysis

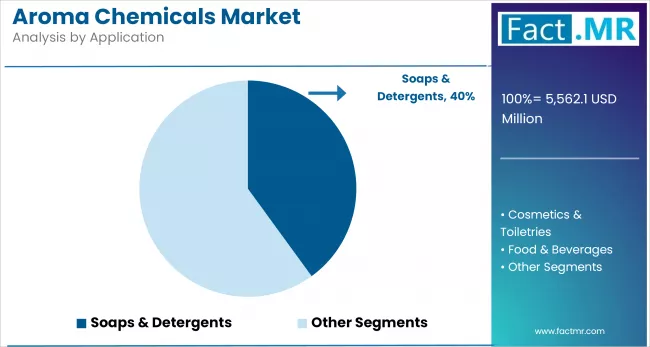
Soaps & Detergents to Exhibit Leading Share by Application

Soaps and detergents are poised to retain a leading share in the global market, driven by consistent consumer demand for fragranced cleaning products and growing emphasis on hygiene across households and institutions. Fragrance remains a key differentiator in this segment, influencing consumer perception of product efficacy and freshness in mature markets such as North America and Europe.

Aroma chemicals, particularly esters, aldehydes, and terpenoids, are widely used in laundry care products, dishwashing liquids, fabric softeners, and surface cleaners to deliver long-lasting and pleasant sensory experiences. The increasing popularity of premium and specialty detergents such as hypoallergenic, plant-based, and eco-friendly formulations has expanded the scope for tailored fragrance solutions, prompting manufacturers to invest in advanced encapsulation and controlled-release technologies.

Rising urbanization and income growth in emerging economies across Asia Pacific are also contributing to increased demand for scented hygiene products. Consumers in countries such as India, China, and Indonesia are demonstrating a growing preference for fragranced personal and household care items, supporting higher volume uptake of aroma chemicals in mass-market detergent lines.

Additionally, manufacturers are responding to sustainability and regulatory trends by reformulating with biodegradable and low-VOC fragrance ingredients, aligning with global clean-label and environmental standards. Strategic collaborations between fragrance houses and detergent producers are enabling the development of region-specific scent profiles that cater to local preferences.

Aroma Chemicals Market Analysis By Application

Alcohol-based Aroma Chemicals to Exhibit Leading Share by Compound

Alcohol-based aroma chemicals are expected to hold the largest market share among compound types, driven by their versatility, stability, and wide usage across personal care, home care, and fine fragrance applications. Key compounds, such as benzyl alcohol, linalool, and phenylethyl alcohol, serve as essential ingredients due to their fixative properties, mild scent profiles, and compatibility with both synthetic and natural formulations.

Their role extends beyond scent, offering antimicrobial benefits and acting as solvents in cosmetics and fragrance products. With increasing demand for clean-label and plant-derived ingredients, naturally sourced alcohols are gaining traction in premium and eco-conscious product lines. Their broad applicability and regulatory acceptance continue to position alcohol-based compounds as a cornerstone of the aroma chemicals market.

Synthetic Aroma Chemicals to Exhibit Leading Share By Source

Synthetic aroma chemicals are expected to retain the largest market share by source, driven by their cost-effectiveness, consistency, and scalability. Widely used in personal care, household, and industrial products, synthetic compounds like aldehydes and musks offer stable formulations and replicate complex natural scents at a lower cost.

They are especially critical in high-volume applications such as detergents and air fresheners, where performance and affordability are essential. Advances in green chemistry and bio-identical synthesis have further improved the safety and sustainability of synthetic options. While natural ingredients are gaining ground in premium segments, synthetic aroma chemicals remain the backbone of large-scale fragrance and flavor production.

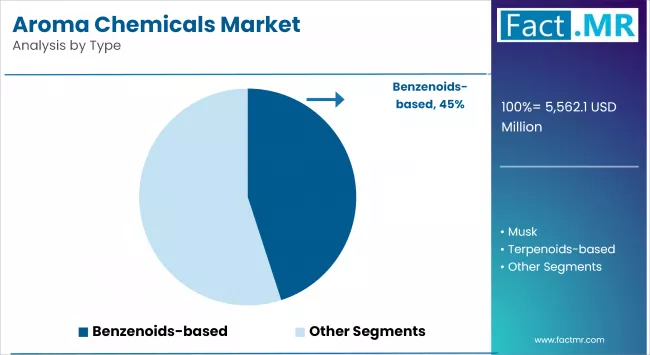
Benzenoid-based Aroma Chemicals to Exhibit Leading Share by Type

Benzenoid-based aroma chemicals are projected to hold the leading share among compound types, primarily due to their widespread use in fine fragrances, personal care products, and household applications. These compounds, such as benzyl acetate, cinnamyl alcohol, and vanillin, are valued for their strong, lasting scent profiles and compatibility with a wide range of formulations.

Their ability to replicate floral, spicy, and sweet notes makes them essential in perfumes, soaps, shampoos, and air care products. In the food industry, benzenoids like ethyl vanillin are also commonly used to enhance flavor, further broadening their market presence.

Aroma Chemicals Market Analysis By Type

Europe holds the Leading Share in the Aroma Chemicals Market

Europe continues to hold a leading share in the global aroma chemicals market, supported by its mature personal care and fragrance industries, advanced regulatory framework, and strong manufacturing base. Countries such as Germany, France, Switzerland, and the Netherlands serve as key production and innovation hubs, hosting major players like Givaudan, Symrise, Firmenich (now part of DSM-Firmenich), and BASF.

The region’s long-standing expertise in fine fragrance formulation, coupled with high consumer demand for premium and niche scents, drives consistent consumption of aroma compounds in luxury perfumes, skincare, and home care products. European consumers are also highly responsive to sustainability, ingredient transparency, and allergen awareness, which has pushed manufacturers to reformulate with cleaner, compliant, and often natural aroma chemicals.

Strict regulatory standards under REACH and IFRA have influenced the development of safer synthetic alternatives and encouraged the adoption of green chemistry practices. These regulations have further solidified Europe's role as a quality benchmark for the production and formulation of aroma chemicals.

Competitive Analysis

The market is shaped by a diverse mix of global and regional players competing through innovation, sustainability, and scale. Key companies include Kelkar Group, BASF SE, Hindustan Mint and Agro Products, Solvay, Symrise AG, Robertet, Kao Corporation, Privi Organics Ltd., Kalpa Sutra Chemicals, and Bell Flavors & Fragrances.

Global leaders like BASF, Symrise, and Solvay focus on sustainable production, advanced R&D, and diversified portfolios. Regional firms, such as Kelkar Group, Privi Organics, and Kalpa Sutra Chemicals, cater to local markets with cost-effective solutions and expanding export capabilities. Specialty players, including Robertet and Bell Flavors, drive product customization in the fine fragrance and food sectors, while Kao Corporation benefits from vertical integration within its personal care product lines.

Recent Development

  • In April 2023, Solvay unveiled a deal with Ginkgo Bioworks to bolster its R&D position in the USA

Segmentation of Aroma Chemicals Market

  • By Application :

    • Soaps & Detergents
    • Cosmetics & Toiletries
    • Food & Beverages Ingredients
    • Others
  • By Compound :

    • Alcohol-based
      • Saturated Alkyl-Alcohol
      • Unsaturated Alkyl-Alcohol
      • Complex Fragrance Alcohol
      • Aromatic and Aralkyl Alcohol
      • Phenolic
    • Acids
      • Saturated Aliphatic Acid
      • Unsaturated Aliphatic Acid
      • Aromatic Acid
    • Esters
      • Saturated Esters
      • Unsaturated Esters
      • Aromatic Esters
      • Lactones- Gamma and Delta
      • Synthesis of Ester
    • Aldehydes
      • Aliphatic Aldehyde
      • Unsaturated Aldehyde
      • Acetals
      • Aromatics
      • Nitriles
    • Ketones
    • Hydrocarbons
  • By Source :

    • Natural Aroma Chemicals
    • Synthetic Aroma Chemicals
  • By Type :

    • Benzenoids
    • Musk Chemicals
    • Terpenoids
    • Others
  • By Region :

    • North America
    • Latin America
    • Europe
    • East Asia
    • South Asia
    • Oceania
    • Middle East & Africa

Table of Content

  1. Executive Summary
    • Global Market Outlook
    • Demand-side Trends
    • Supply-side Trends
    • Technology Roadmap Analysis
    • Analysis and Recommendations
  2. Market Overview
    • Market Coverage / Taxonomy
    • Market Definition / Scope / Limitations
  3. Market Background
    • Market Dynamics
      • Drivers
      • Restraints
      • Opportunity
      • Trends
    • Scenario Forecast
      • Demand in Optimistic Scenario
      • Demand in Likely Scenario
      • Demand in Conservative Scenario
    • Opportunity Map Analysis
    • Product Life Cycle Analysis
    • Supply Chain Analysis
      • Supply Side Participants and their Roles
        • Producers
        • Mid-Level Participants (Traders/ Agents/ Brokers)
        • Wholesalers and Distributors
      • Value Added and Value Created at Node in the Supply Chain
      • List of Raw Material Suppliers
      • List of Existing and Potential Buyers
    • Investment Feasibility Matrix
    • Value Chain Analysis
      • Profit Margin Analysis
      • Wholesalers and Distributors
    • PESTLE and Porter’s Analysis
    • Regulatory Landscape
      • By Key Regions
      • By Key Countries
    • Production and Consumption Statistics
    • Import and Export Statistics
  4. Global Market Analysis 2020 to 2024 and Forecast, 2025 to 2035
    • Historical Market Size Value (US$ Bn) & Volume (Units) Analysis, 2020 to 2024
    • Current and Future Market Size Value (US$ Bn) & Volume (Units) Projections, 2025 to 2035
      • Y-o-Y Growth Trend Analysis
      • Absolute $ Opportunity Analysis
  5. Global Market Pricing Analysis 2020 to 2024 and Forecast 2025 to 2035
  6. Global Market Analysis 2020 to 2024 and Forecast 2025 to 2035, By Application
    • Introduction / Key Findings
    • Historical Market Size Value (US$ Bn) & Volume (Units) Analysis By Application, 2020 to 2024
    • Current and Future Market Size Value (US$ Bn) & Volume (Units) Analysis and Forecast By Application, 2025 to 2035
      • Soaps & Detergents
      • Cosmetics & Toiletries
      • Food & Beverage Ingredients
    • Y-o-Y Growth Trend Analysis By Application, 2020 to 2024
    • Absolute $ Opportunity Analysis By Application, 2025 to 2035
  7. Global Market Analysis 2020 to 2024 and Forecast 2025 to 2035, By Compound
    • Introduction / Key Findings
    • Historical Market Size Value (US$ Bn) & Volume (Units) Analysis By Compound, 2020 to 2024
    • Current and Future Market Size Value (US$ Bn) & Volume (Units) Analysis and Forecast By Compound, 2025 to 2035
      • Alcohol-based
        • Saturated Alkyl-Alcohol
        • Unsaturated Alkyl-Alcohol
        • Complex Ring-structure Alcohol
        • Aromatic and Acyclic Alcohol
      • Phenols
      • Acid-based
        • Saturated Aliphatic Acid
        • Unsaturated Aliphatic Acid
        • Aromatic Acid
      • Esters-based
        • Saturated Esters
        • Unsaturated Esters
        • Aromatic Esters
        • Lactones - Gamma and Delta
        • Synthetic Ester
      • Aldehyde-based Aroma Chemicals
        • Aliphatic Aldehyde
        • Unsaturated Aldehyde
      • Acetals
      • Ketones
      • Aromatics
      • Nitrites
      • Hydrocarbon-based
    • Y-o-Y Growth Trend Analysis By Compound, 2020 to 2024
    • Absolute $ Opportunity Analysis By Compound, 2025 to 2035
  8. Global Market Analysis 2020 to 2024 and Forecast 2025 to 2035, By Source
    • Introduction / Key Findings
    • Historical Market Size Value (US$ Bn) & Volume (Units) Analysis By Source, 2020 to 2024
    • Current and Future Market Size Value (US$ Bn) & Volume (Units) Analysis and Forecast By Source, 2025 to 2035
      • Natural Aroma Chemicals
      • Synthetic Aroma Chemicals
    • Y-o-Y Growth Trend Analysis By Source, 2020 to 2024
    • Absolute $ Opportunity Analysis By Source, 2025 to 2035
  9. Global Market Analysis 2020 to 2024 and Forecast 2025 to 2035, By Type
    • Introduction / Key Findings
    • Historical Market Size Value (US$ Bn) & Volume (Units) Analysis By Type, 2020 to 2024
    • Current and Future Market Size Value (US$ Bn) & Volume (Units) Analysis and Forecast By Type, 2025 to 2035
      • Benzenoids-based
      • Musk
      • Terpenoids-based
      • Others
    • Y-o-Y Growth Trend Analysis By Type, 2020 to 2024
    • Absolute $ Opportunity Analysis By Type, 2025 to 2035
  10. Global Market Analysis 2020 to 2024 and Forecast 2025 to 2035, By Region
    • Introduction
    • Historical Market Size Value (US$ Bn) & Volume (Units) Analysis By Region, 2020 to 2024
    • Current Market Size Value (US$ Bn) & Volume (Units) Analysis and Forecast By Region, 2025 to 2035
      • North America
      • Latin America
      • Europe
      • East Asia
      • South Asia
      • Oceania
      • MEA
    • Market Attractiveness Analysis By Region
  11. North America Market Analysis 2020 to 2024 and Forecast 2025 to 2035, By Country
    • Historical Market Size Value (US$ Bn) & Volume (Units) Trend Analysis By Market Taxonomy, 2020 to 2024
    • Market Size Value (US$ Bn) & Volume (Units) Forecast By Market Taxonomy, 2025 to 2035
      • By Country
        • USA
        • Canada
      • By Application
      • By Compound
      • By Source
      • By Type
    • Market Attractiveness Analysis
      • By Country
      • By Application
      • By Compound
      • By Source
      • By Type
    • Key Takeaways
  12. Latin America Market Analysis 2020 to 2024 and Forecast 2025 to 2035, By Country
    • Historical Market Size Value (US$ Bn) & Volume (Units) Trend Analysis By Market Taxonomy, 2020 to 2024
    • Market Size Value (US$ Bn) & Volume (Units) Forecast By Market Taxonomy, 2025 to 2035
      • By Country
        • Brazil
        • Mexico
        • Argentina
        • Chile
        • Peru
        • Rest of Latin America
      • By Application
      • By Compound
      • By Source
      • By Type
    • Market Attractiveness Analysis
      • By Country
      • By Application
      • By Compound
      • By Source
      • By Type
    • Key Takeaways
  13. Europe Market Analysis 2020 to 2024 and Forecast 2025 to 2035, By Country
    • Historical Market Size Value (US$ Bn) & Volume (Units) Trend Analysis By Market Taxonomy, 2020 to 2024
    • Market Size Value (US$ Bn) & Volume (Units) Forecast By Market Taxonomy, 2025 to 2035
      • By Country
        • Germany
        • Italy
        • France
        • UK
        • Spain
        • Russia
        • BENELUX
        • Rest of Europe
      • By Application
      • By Compound
      • By Source
      • By Type
    • Market Attractiveness Analysis
      • By Country
      • By Application
      • By Compound
      • By Source
      • By Type
    • Key Takeaways
  14. East Asia Market Analysis 2020 to 2024 and Forecast 2025 to 2035, By Country
    • Historical Market Size Value (US$ Bn) & Volume (Units) Trend Analysis By Market Taxonomy, 2020 to 2024
    • Market Size Value (US$ Bn) & Volume (Units) Forecast By Market Taxonomy, 2025 to 2035
      • By Country
        • China
        • Japan
        • South Korea
      • By Application
      • By Compound
      • By Source
      • By Type
    • Market Attractiveness Analysis
      • By Country
      • By Application
      • By Compound
      • By Source
      • By Type
    • Key Takeaways
  15. South Asia Market Analysis 2020 to 2024 and Forecast 2025 to 2035, By Country
    • Historical Market Size Value (US$ Bn) & Volume (Units) Trend Analysis By Market Taxonomy, 2020 to 2024
    • Market Size Value (US$ Bn) & Volume (Units) Forecast By Market Taxonomy, 2025 to 2035
      • By Country
        • India
        • Thailand
        • Malaysia
        • Indonesia
        • Rest of South Asia
      • By Application
      • By Compound
      • By Source
      • By Type
    • Market Attractiveness Analysis
      • By Country
      • By Application
      • By Compound
      • By Source
      • By Type
    • Key Takeaways
  16. Oceania Market Analysis 2020 to 2024 and Forecast 2025 to 2035, By Country
    • Historical Market Size Value (US$ Bn) & Volume (Units) Trend Analysis By Market Taxonomy, 2020 to 2024
    • Market Size Value (US$ Bn) & Volume (Units) Forecast By Market Taxonomy, 2025 to 2035
      • By Country
        • Australia
        • New Zealand
      • By Application
      • By Compound
      • By Source
      • By Type
    • Market Attractiveness Analysis
      • By Country
      • By Application
      • By Compound
      • By Source
      • By Type
    • Key Takeaways
  17. MEA Market Analysis 2020 to 2024 and Forecast 2025 to 2035, By Country
    • Historical Market Size Value (US$ Bn) & Volume (Units) Trend Analysis By Market Taxonomy, 2020 to 2024
    • Market Size Value (US$ Bn) & Volume (Units) Forecast By Market Taxonomy, 2025 to 2035
      • By Country
        • GCC
        • Rest of MEA
      • By Application
      • By Compound
      • By Source
      • By Type
    • Market Attractiveness Analysis
      • By Country
      • By Application
      • By Compound
      • By Source
      • By Type
    • Key Takeaways
  18. Key Countries Market Analysis
    • Value (US$ Bn) & Volume (Units)ed States
      • Pricing Analysis
      • Market Share Analysis, 2024
        • By Application
        • By Compound
        • By Source
        • By Type
    • Germany
      • Pricing Analysis
      • Market Share Analysis, 2024
        • By Application
        • By Compound
        • By Source
        • By Type
    • India
      • Pricing Analysis
      • Market Share Analysis, 2024
        • By Application
        • By Compound
        • By Source
        • By Type
    • China
      • Pricing Analysis
      • Market Share Analysis, 2024
        • By Application
        • By Compound
        • By Source
        • By Type
    • France
      • Pricing Analysis
      • Market Share Analysis, 2024
        • By Application
        • By Compound
        • By Source
        • By Type
  19. Market Structure Analysis
    • Competition Dashboard
    • Competition Benchmarking
    • Market Share Analysis of Top Players
      • By Regional
      • By Application
      • By Compound
      • By Source
      • By Type
  20. Competition Analysis
    • Competition Deep Dive
      • Kelkar Group
        • Overview
        • Product Portfolio
        • Profitability by Market Segments (Product/Age /Sales Channel/Region)
        • Sales Footprint
        • Strategy Overview
          • Marketing Strategy
          • Product Strategy
          • Channel Strategy
      • BASF SE
        • Overview
        • Product Portfolio
        • Profitability by Market Segments (Product/Age /Sales Channel/Region)
        • Sales Footprint
        • Strategy Overview
          • Marketing Strategy
          • Product Strategy
          • Channel Strategy
      • Hindustan Mint and Agro Products
        • Overview
        • Product Portfolio
        • Profitability by Market Segments (Product/Age /Sales Channel/Region)
        • Sales Footprint
        • Strategy Overview
          • Marketing Strategy
          • Product Strategy
          • Channel Strategy
      • Solvay
        • Overview
        • Product Portfolio
        • Profitability by Market Segments (Product/Age /Sales Channel/Region)
        • Sales Footprint
        • Strategy Overview
          • Marketing Strategy
          • Product Strategy
          • Channel Strategy
      • Symrise AG
        • Overview
        • Product Portfolio
        • Profitability by Market Segments (Product/Age /Sales Channel/Region)
        • Sales Footprint
        • Strategy Overview
          • Marketing Strategy
          • Product Strategy
          • Channel Strategy
      • Robertet
        • Overview
        • Product Portfolio
        • Profitability by Market Segments (Product/Age /Sales Channel/Region)
        • Sales Footprint
        • Strategy Overview
          • Marketing Strategy
          • Product Strategy
          • Channel Strategy
      • Kao Corporation
        • Overview
        • Product Portfolio
        • Profitability by Market Segments (Product/Age /Sales Channel/Region)
        • Sales Footprint
        • Strategy Overview
          • Marketing Strategy
          • Product Strategy
          • Channel Strategy
      • Privi Organics Ltd.
        • Overview
        • Product Portfolio
        • Profitability by Market Segments (Product/Age /Sales Channel/Region)
        • Sales Footprint
        • Strategy Overview
          • Marketing Strategy
          • Product Strategy
          • Channel Strategy
      • Kalpa Sutra Chemicals
        • Overview
        • Product Portfolio
        • Profitability by Market Segments (Product/Age /Sales Channel/Region)
        • Sales Footprint
        • Strategy Overview
          • Marketing Strategy
          • Product Strategy
          • Channel Strategy
      • Bell Flavors & Fragrances
        • Overview
        • Product Portfolio
        • Profitability by Market Segments (Product/Age /Sales Channel/Region)
        • Sales Footprint
        • Strategy Overview
          • Marketing Strategy
          • Product Strategy
          • Channel Strategy
  21. Assumptions & Acronyms Used
  22. Research Methodology

List Of Table

  • Table 1: Global Market Value (US$ Bn) Forecast by Region, 2020 to 2035
  • Table 2: Global Market Volume (Units) Forecast by Region, 2020 to 2035
  • Table 3: Global Market Value (US$ Bn) Forecast by Application, 2020 to 2035
  • Table 4: Global Market Volume (Units) Forecast by Application, 2020 to 2035
  • Table 5: Global Market Value (US$ Bn) Forecast by Compound, 2020 to 2035
  • Table 6: Global Market Volume (Units) Forecast by Compound, 2020 to 2035
  • Table 7: Global Market Value (US$ Bn) Forecast by Source, 2020 to 2035
  • Table 8: Global Market Volume (Units) Forecast by Source, 2020 to 2035
  • Table 9: Global Market Value (US$ Bn) Forecast by Type, 2020 to 2035
  • Table 10: Global Market Volume (Units) Forecast by Type, 2020 to 2035
  • Table 11: North America Market Value (US$ Bn) Forecast by Country, 2020 to 2035
  • Table 12: North America Market Volume (Units) Forecast by Country, 2020 to 2035
  • Table 13: North America Market Value (US$ Bn) Forecast by Application, 2020 to 2035
  • Table 14: North America Market Volume (Units) Forecast by Application, 2020 to 2035
  • Table 15: North America Market Value (US$ Bn) Forecast by Compound, 2020 to 2035
  • Table 16: North America Market Volume (Units) Forecast by Compound, 2020 to 2035
  • Table 17: North America Market Value (US$ Bn) Forecast by Source, 2020 to 2035
  • Table 18: North America Market Volume (Units) Forecast by Source, 2020 to 2035
  • Table 19: North America Market Value (US$ Bn) Forecast by Type, 2020 to 2035
  • Table 20: North America Market Volume (Units) Forecast by Type, 2020 to 2035
  • Table 21: Latin America Market Value (US$ Bn) Forecast by Country, 2020 to 2035
  • Table 22: Latin America Market Volume (Units) Forecast by Country, 2020 to 2035
  • Table 23: Latin America Market Value (US$ Bn) Forecast by Application, 2020 to 2035
  • Table 24: Latin America Market Volume (Units) Forecast by Application, 2020 to 2035
  • Table 25: Latin America Market Value (US$ Bn) Forecast by Compound, 2020 to 2035
  • Table 26: Latin America Market Volume (Units) Forecast by Compound, 2020 to 2035
  • Table 27: Latin America Market Value (US$ Bn) Forecast by Source, 2020 to 2035
  • Table 28: Latin America Market Volume (Units) Forecast by Source, 2020 to 2035
  • Table 29: Latin America Market Value (US$ Bn) Forecast by Type, 2020 to 2035
  • Table 30: Latin America Market Volume (Units) Forecast by Type, 2020 to 2035
  • Table 31: Europe Market Value (US$ Bn) Forecast by Country, 2020 to 2035
  • Table 32: Europe Market Volume (Units) Forecast by Country, 2020 to 2035
  • Table 33: Europe Market Value (US$ Bn) Forecast by Application, 2020 to 2035
  • Table 34: Europe Market Volume (Units) Forecast by Application, 2020 to 2035
  • Table 35: Europe Market Value (US$ Bn) Forecast by Compound, 2020 to 2035
  • Table 36: Europe Market Volume (Units) Forecast by Compound, 2020 to 2035
  • Table 37: Europe Market Value (US$ Bn) Forecast by Source, 2020 to 2035
  • Table 38: Europe Market Volume (Units) Forecast by Source, 2020 to 2035
  • Table 39: Europe Market Value (US$ Bn) Forecast by Type, 2020 to 2035
  • Table 40: Europe Market Volume (Units) Forecast by Type, 2020 to 2035
  • Table 41: East Asia Market Value (US$ Bn) Forecast by Country, 2020 to 2035
  • Table 42: East Asia Market Volume (Units) Forecast by Country, 2020 to 2035
  • Table 43: East Asia Market Value (US$ Bn) Forecast by Application, 2020 to 2035
  • Table 44: East Asia Market Volume (Units) Forecast by Application, 2020 to 2035
  • Table 45: East Asia Market Value (US$ Bn) Forecast by Compound, 2020 to 2035
  • Table 46: East Asia Market Volume (Units) Forecast by Compound, 2020 to 2035
  • Table 47: East Asia Market Value (US$ Bn) Forecast by Source, 2020 to 2035
  • Table 48: East Asia Market Volume (Units) Forecast by Source, 2020 to 2035
  • Table 49: East Asia Market Value (US$ Bn) Forecast by Type, 2020 to 2035
  • Table 50: East Asia Market Volume (Units) Forecast by Type, 2020 to 2035
  • Table 51: South Asia Market Value (US$ Bn) Forecast by Country, 2020 to 2035
  • Table 52: South Asia Market Volume (Units) Forecast by Country, 2020 to 2035
  • Table 53: South Asia Market Value (US$ Bn) Forecast by Application, 2020 to 2035
  • Table 54: South Asia Market Volume (Units) Forecast by Application, 2020 to 2035
  • Table 55: South Asia Market Value (US$ Bn) Forecast by Compound, 2020 to 2035
  • Table 56: South Asia Market Volume (Units) Forecast by Compound, 2020 to 2035
  • Table 57: South Asia Market Value (US$ Bn) Forecast by Source, 2020 to 2035
  • Table 58: South Asia Market Volume (Units) Forecast by Source, 2020 to 2035
  • Table 59: South Asia Market Value (US$ Bn) Forecast by Type, 2020 to 2035
  • Table 60: South Asia Market Volume (Units) Forecast by Type, 2020 to 2035
  • Table 61: Oceania Market Value (US$ Bn) Forecast by Country, 2020 to 2035
  • Table 62: Oceania Market Volume (Units) Forecast by Country, 2020 to 2035
  • Table 63: Oceania Market Value (US$ Bn) Forecast by Application, 2020 to 2035
  • Table 64: Oceania Market Volume (Units) Forecast by Application, 2020 to 2035
  • Table 65: Oceania Market Value (US$ Bn) Forecast by Compound, 2020 to 2035
  • Table 66: Oceania Market Volume (Units) Forecast by Compound, 2020 to 2035
  • Table 67: Oceania Market Value (US$ Bn) Forecast by Source, 2020 to 2035
  • Table 68: Oceania Market Volume (Units) Forecast by Source, 2020 to 2035
  • Table 69: Oceania Market Value (US$ Bn) Forecast by Type, 2020 to 2035
  • Table 70: Oceania Market Volume (Units) Forecast by Type, 2020 to 2035
  • Table 71: MEA Market Value (US$ Bn) Forecast by Country, 2020 to 2035
  • Table 72: MEA Market Volume (Units) Forecast by Country, 2020 to 2035
  • Table 73: MEA Market Value (US$ Bn) Forecast by Application, 2020 to 2035
  • Table 74: MEA Market Volume (Units) Forecast by Application, 2020 to 2035
  • Table 75: MEA Market Value (US$ Bn) Forecast by Compound, 2020 to 2035
  • Table 76: MEA Market Volume (Units) Forecast by Compound, 2020 to 2035
  • Table 77: MEA Market Value (US$ Bn) Forecast by Source, 2020 to 2035
  • Table 78: MEA Market Volume (Units) Forecast by Source, 2020 to 2035
  • Table 79: MEA Market Value (US$ Bn) Forecast by Type, 2020 to 2035
  • Table 80: MEA Market Volume (Units) Forecast by Type, 2020 to 2035

List Of Figures

  • Figure 1: Global Market Volume (Units) Forecast 2020 to 2035
  • Figure 2: Global Market Pricing Analysis
  • Figure 3: Global Market Value (US$ Bn) Forecast 2020 to 2035
  • Figure 4: Global Market Value Share and BPS Analysis by Application, 2025 and 2035
  • Figure 5: Global Market Y-o-Y Growth Comparison by Application, 2025 to 2035
  • Figure 6: Global Market Attractiveness Analysis by Application
  • Figure 7: Global Market Value Share and BPS Analysis by Compound, 2025 and 2035
  • Figure 8: Global Market Y-o-Y Growth Comparison by Compound, 2025 to 2035
  • Figure 9: Global Market Attractiveness Analysis by Compound
  • Figure 10: Global Market Value Share and BPS Analysis by Source, 2025 and 2035
  • Figure 11: Global Market Y-o-Y Growth Comparison by Source, 2025 to 2035
  • Figure 12: Global Market Attractiveness Analysis by Source
  • Figure 13: Global Market Value Share and BPS Analysis by Type, 2025 and 2035
  • Figure 14: Global Market Y-o-Y Growth Comparison by Type, 2025 to 2035
  • Figure 15: Global Market Attractiveness Analysis by Type
  • Figure 16: Global Market Value (US$ Bn) Share and BPS Analysis by Region, 2025 and 2035
  • Figure 17: Global Market Y-o-Y Growth Comparison by Region, 2025 to 2035
  • Figure 18: Global Market Attractiveness Analysis by Region
  • Figure 19: North America Market Incremental $ Opportunity, 2025 to 2035
  • Figure 20: Latin America Market Incremental $ Opportunity, 2025 to 2035
  • Figure 21: Europe Market Incremental $ Opportunity, 2025 to 2035
  • Figure 22: East Asia Market Incremental $ Opportunity, 2025 to 2035
  • Figure 23: South Asia Market Incremental $ Opportunity, 2025 to 2035
  • Figure 24: Oceania Market Incremental $ Opportunity, 2025 to 2035
  • Figure 25: MEA Market Incremental $ Opportunity, 2025 to 2035
  • Figure 26: North America Market Value Share and BPS Analysis by Country, 2025 and 2035
  • Figure 27: North America Market Value Share and BPS Analysis by Application, 2025 and 2035
  • Figure 28: North America Market Y-o-Y Growth Comparison by Application, 2025 to 2035
  • Figure 29: North America Market Attractiveness Analysis by Application
  • Figure 30: North America Market Value Share and BPS Analysis by Compound, 2025 and 2035
  • Figure 31: North America Market Y-o-Y Growth Comparison by Compound, 2025 to 2035
  • Figure 32: North America Market Attractiveness Analysis by Compound
  • Figure 33: North America Market Value Share and BPS Analysis by Source, 2025 and 2035
  • Figure 34: North America Market Y-o-Y Growth Comparison by Source, 2025 to 2035
  • Figure 35: North America Market Attractiveness Analysis by Source
  • Figure 36: North America Market Value Share and BPS Analysis by Type, 2025 and 2035
  • Figure 37: North America Market Y-o-Y Growth Comparison by Type, 2025 to 2035
  • Figure 38: North America Market Attractiveness Analysis by Type
  • Figure 39: Latin America Market Value Share and BPS Analysis by Country, 2025 and 2035
  • Figure 40: Latin America Market Value Share and BPS Analysis by Application, 2025 and 2035
  • Figure 41: Latin America Market Y-o-Y Growth Comparison by Application, 2025 to 2035
  • Figure 42: Latin America Market Attractiveness Analysis by Application
  • Figure 43: Latin America Market Value Share and BPS Analysis by Compound, 2025 and 2035
  • Figure 44: Latin America Market Y-o-Y Growth Comparison by Compound, 2025 to 2035
  • Figure 45: Latin America Market Attractiveness Analysis by Compound
  • Figure 46: Latin America Market Value Share and BPS Analysis by Source, 2025 and 2035
  • Figure 47: Latin America Market Y-o-Y Growth Comparison by Source, 2025 to 2035
  • Figure 48: Latin America Market Attractiveness Analysis by Source
  • Figure 49: Latin America Market Value Share and BPS Analysis by Type, 2025 and 2035
  • Figure 50: Latin America Market Y-o-Y Growth Comparison by Type, 2025 to 2035
  • Figure 51: Latin America Market Attractiveness Analysis by Type
  • Figure 52: Europe Market Value Share and BPS Analysis by Country, 2025 and 2035
  • Figure 53: Europe Market Value Share and BPS Analysis by Application, 2025 and 2035
  • Figure 54: Europe Market Y-o-Y Growth Comparison by Application, 2025 to 2035
  • Figure 55: Europe Market Attractiveness Analysis by Application
  • Figure 56: Europe Market Value Share and BPS Analysis by Compound, 2025 and 2035
  • Figure 57: Europe Market Y-o-Y Growth Comparison by Compound, 2025 to 2035
  • Figure 58: Europe Market Attractiveness Analysis by Compound
  • Figure 59: Europe Market Value Share and BPS Analysis by Source, 2025 and 2035
  • Figure 60: Europe Market Y-o-Y Growth Comparison by Source, 2025 to 2035
  • Figure 61: Europe Market Attractiveness Analysis by Source
  • Figure 62: Europe Market Value Share and BPS Analysis by Type, 2025 and 2035
  • Figure 63: Europe Market Y-o-Y Growth Comparison by Type, 2025 to 2035
  • Figure 64: Europe Market Attractiveness Analysis by Type
  • Figure 65: East Asia Market Value Share and BPS Analysis by Country, 2025 and 2035
  • Figure 66: East Asia Market Value Share and BPS Analysis by Application, 2025 and 2035
  • Figure 67: East Asia Market Y-o-Y Growth Comparison by Application, 2025 to 2035
  • Figure 68: East Asia Market Attractiveness Analysis by Application
  • Figure 69: East Asia Market Value Share and BPS Analysis by Compound, 2025 and 2035
  • Figure 70: East Asia Market Y-o-Y Growth Comparison by Compound, 2025 to 2035
  • Figure 71: East Asia Market Attractiveness Analysis by Compound
  • Figure 72: East Asia Market Value Share and BPS Analysis by Source, 2025 and 2035
  • Figure 73: East Asia Market Y-o-Y Growth Comparison by Source, 2025 to 2035
  • Figure 74: East Asia Market Attractiveness Analysis by Source
  • Figure 75: East Asia Market Value Share and BPS Analysis by Type, 2025 and 2035
  • Figure 76: East Asia Market Y-o-Y Growth Comparison by Type, 2025 to 2035
  • Figure 77: East Asia Market Attractiveness Analysis by Type
  • Figure 78: South Asia Market Value Share and BPS Analysis by Country, 2025 and 2035
  • Figure 79: South Asia Market Value Share and BPS Analysis by Application, 2025 and 2035
  • Figure 80: South Asia Market Y-o-Y Growth Comparison by Application, 2025 to 2035
  • Figure 81: South Asia Market Attractiveness Analysis by Application
  • Figure 82: South Asia Market Value Share and BPS Analysis by Compound, 2025 and 2035
  • Figure 83: South Asia Market Y-o-Y Growth Comparison by Compound, 2025 to 2035
  • Figure 84: South Asia Market Attractiveness Analysis by Compound
  • Figure 85: South Asia Market Value Share and BPS Analysis by Source, 2025 and 2035
  • Figure 86: South Asia Market Y-o-Y Growth Comparison by Source, 2025 to 2035
  • Figure 87: South Asia Market Attractiveness Analysis by Source
  • Figure 88: South Asia Market Value Share and BPS Analysis by Type, 2025 and 2035
  • Figure 89: South Asia Market Y-o-Y Growth Comparison by Type, 2025 to 2035
  • Figure 90: South Asia Market Attractiveness Analysis by Type
  • Figure 91: Oceania Market Value Share and BPS Analysis by Country, 2025 and 2035
  • Figure 92: Oceania Market Value Share and BPS Analysis by Application, 2025 and 2035
  • Figure 93: Oceania Market Y-o-Y Growth Comparison by Application, 2025 to 2035
  • Figure 94: Oceania Market Attractiveness Analysis by Application
  • Figure 95: Oceania Market Value Share and BPS Analysis by Compound, 2025 and 2035
  • Figure 96: Oceania Market Y-o-Y Growth Comparison by Compound, 2025 to 2035
  • Figure 97: Oceania Market Attractiveness Analysis by Compound
  • Figure 98: Oceania Market Value Share and BPS Analysis by Source, 2025 and 2035
  • Figure 99: Oceania Market Y-o-Y Growth Comparison by Source, 2025 to 2035
  • Figure 100: Oceania Market Attractiveness Analysis by Source
  • Figure 101: Oceania Market Value Share and BPS Analysis by Type, 2025 and 2035
  • Figure 102: Oceania Market Y-o-Y Growth Comparison by Type, 2025 to 2035
  • Figure 103: Oceania Market Attractiveness Analysis by Type
  • Figure 104: MEA Market Value Share and BPS Analysis by Country, 2025 and 2035
  • Figure 105: MEA Market Value Share and BPS Analysis by Application, 2025 and 2035
  • Figure 106: MEA Market Y-o-Y Growth Comparison by Application, 2025 to 2035
  • Figure 107: MEA Market Attractiveness Analysis by Application
  • Figure 108: MEA Market Value Share and BPS Analysis by Compound, 2025 and 2035
  • Figure 109: MEA Market Y-o-Y Growth Comparison by Compound, 2025 to 2035
  • Figure 110: MEA Market Attractiveness Analysis by Compound
  • Figure 111: MEA Market Value Share and BPS Analysis by Source, 2025 and 2035
  • Figure 112: MEA Market Y-o-Y Growth Comparison by Source, 2025 to 2035
  • Figure 113: MEA Market Attractiveness Analysis by Source
  • Figure 114: MEA Market Value Share and BPS Analysis by Type, 2025 and 2035
  • Figure 115: MEA Market Y-o-Y Growth Comparison by Type, 2025 to 2035
  • Figure 116: MEA Market Attractiveness Analysis by Type
  • Figure 117: Global Market - Tier Structure Analysis
  • Figure 118: Global Market - Company Share Analysis

- FAQs -

What is the global aroma chemicals market size in 2025?

The market is valued at USD 5,562.1 million in 2025.

Who are the major players operating in the aroma chemicals market?

Prominent players in the market include Kelkar Group, BASF SE, Hindustan Mint and Agro Products, Solvay, Symrise AG, Robertet, Kao Corporation, and others.

What is the estimated valuation of the aroma chemicals market by 2035?

The market is expected to reach a valuation of USD 8,804.5 million by 2035.

At what CAGR is the aroma chemicals market slated to grow during the study period?

The market is set to grow at 4.7% CAGR during the study period.

Aroma Chemicals Market

Schedule a Call