- Market Value (2025): USD 66.5 Bn
- Estimated Value (2026): USD 70.2 Bn
- Forecast Value (2036): USD 121.1 Bn
- CAGR (2026-2036): 5.6%
What is the Non-GMO Flour Market forecast to be worth by 2036?
USD 70.2 billion in 2026 to USD 121.1 billion by 2036 at 5.6% CAGR.
- The Non-GMO flour market crossed a valuation of USD 66.5 billion in 2025 as bakery, pasta and clean-label food applications kept certified ingredient demand active.
- Demand is projected to increase from USD 70.2 billion in 2026 to USD 121.1 billion by 2036.
- The market is forecast to record 5.6% CAGR from 2026 to 2036 as bakery brands and industrial food processors tighten ingredient documentation.
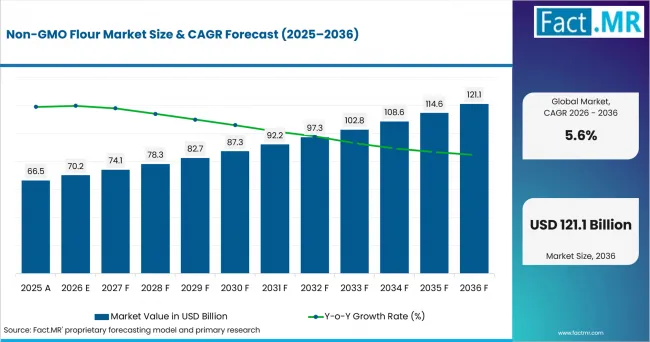
Non Gmo Flour Market Value Analysis | Source: Fact.MR
What are the defining numbers behind Non-GMO Flour Market growth?
USD 50.9 billion absolute opportunity by 2036, led by Wheat Starch and Bakery Products And Confectionery alongside the USA and South Korea.
- Demand Drivers in the Market
- Bakery brands need non-GMO flour inputs to keep clean-label claims consistent across breads, biscuits and packaged baking mixes.
- Food processors compare non-GMO positioning with organic food ingredients when private-label retailers ask for ingredient evidence before shelf approval.
- Millers must separate raw-material handling so non-GMO flour does not lose claim integrity during storage, transfer or bagging.
- Industrial users are expected to prioritize stable starch performance where paper, textile and adhesive recipes need predictable viscosity.
- Key Segments Analyzed
- By Product: Wheat Starch is expected to hold 45.9% share in 2026 owing to its wide fit in bakery, confectionery and processed food recipes.
- By Application: Bakery Products And Confectionery is projected to account for 35.9% share in 2026 as packaged bakery brands rely on familiar flour systems and baking ingredients.
- Analyst Opinion at Fact.MR
- Shambhu Nath Jha, Principal Consultant at Fact.MR, states, “Non-GMO flour procurement is less about a single milling step and more about proof across the grain chain. Brand owners are expected to reward suppliers that can connect farm records, cleaning steps and finished-product documentation. The most reliable suppliers combine crop access, allergen discipline and practical baking performance.”
- Strategic Implications
- Millers should document crop origin and cleaning protocols before certification questions reach customer audits.
- Bakery manufacturers should test non-GMO flour performance across high-volume breads before switching recipes at scale.
- Retail brand teams should separate non-GMO positioning from organic claims so package language remains clear and compliant.
South Korea is estimated to record 5.9% CAGR through 2036 due to imported clean-label food demand and strict food-label checks. The USA is projected to post 5.8% CAGR, supported by large flour milling capacity and mature organic food retailing. The U.K. is anticipated to advance at 5.2% CAGR as organic cereal acreage remains visible in domestic supply. France is forecast to reach 4.9% CAGR because bakery and cereal prices remain central to household food baskets. Germany is expected to hold 4.7% CAGR, shaped by organic farmland and value-focused bakery consumption. Italy is estimated to record 4.4% CAGR as cereal output and organic land support ingredient availability. Japan is forecast to post 4.3% CAGR due to strict labeling practice and steady premium-food demand.
How does the Non-GMO Flour Market break down by segment?
Wheat Starch leads Product at 45.9%; Bakery Products And Confectionery leads Application at 35.9%.
Which product dominates?
Wheat Starch is projected to account for 45.9% share in 2026.
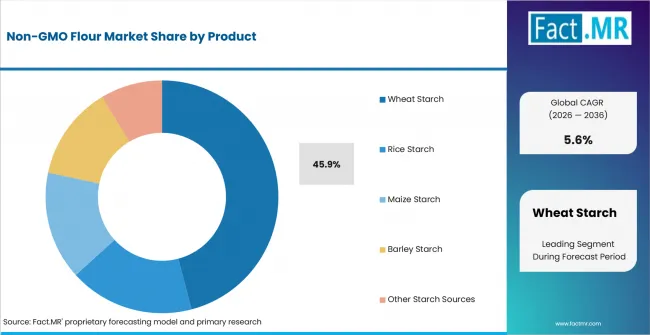
Non Gmo Flour Market Analysis By Product | Source: Fact.MR
Wheat Starch is anticipated to lead because it fits mainstream bakery systems and confectionery recipes without forcing major process changes. Native wheat starch is useful where simple processing language supports label claims. Modified wheat starch retains value where texture, water binding and shelf-life performance need tighter control. Rice starch remains relevant for gluten-managed formulas and Asian noodle applications.
What leads the Application segment?
Bakery Products And Confectionery is expected to hold 35.9% share in 2026.
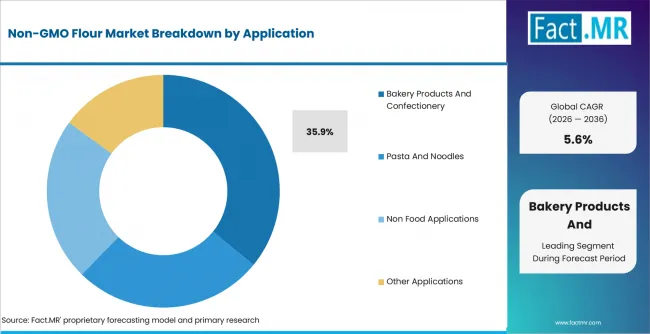
Non Gmo Flour Market Analysis By Application | Source: Fact.MR
Bakery Products And Confectionery is estimated to lead as flour claims are easiest for shoppers to see in bread, biscuit, cake and cookie products. Pasta And Noodles remains attractive where producers can combine familiar grains with clear non-GMO sourcing. Non Food Applications use starch in paper, textile and adhesive systems where performance consistency matters. Other Applications include processed foods and animal feed where verified sourcing is requested by customers.
What is accelerating Non-GMO Flour Market adoption, and what is holding it back?
Clean-label bakery sourcing drives it; certification cost restrains it.
Drivers Impact Analysis
| DRIVER | (~) % IMPACT ON CAGR | GEOGRAPHIC RELEVANCE | IMPACT TIMELINE |
|---|---|---|---|
| Clean-label bakery demand | +1.6% | USA, UK, Germany | Short term (<= 2 years) |
| Identity-preserved grain supply | +1.3% | USA, France, Italy | Short term (<= 2 years) |
| Starch functionality in food | +1.0% | Europe, East Asia | Medium term (2-4 years) |
| Retail label transparency | +0.8% | USA, Japan, South Korea | Medium term (2-4 years) |
| Industrial starch uses | +0.5% | Global | Long term (>= 4 years) |
Source: Fact.MR analysis. Updated Aug 20, 2026
- Clean-label bakery demand: Bakery brands are expected to use non-GMO flour where package claims influence repeat purchases. USDA NASS reported in May 2026 that total U.S. flour production reached 419 million hundredweight in 2025.
- Identity-preserved grain supply: Mills need crop segregation and documented storage before finished flour can carry a defensible claim. The requirement favors suppliers with direct farmer networks and repeatable audit records.
- Starch functionality in food: Native and modified starches are anticipated to gain use where formulators need texture without unfamiliar ingredients. Wheat and rice starch are suited to bakery and confectionery systems.
- Industrial starch uses: Paper, textile and adhesive users are expected to keep non-food applications relevant where starch performance carries more weight than consumer label appeal.
Opportunity Impact Analysis
| OPPORTUNITY | (~) % IMPACT ON CAGR | GEOGRAPHIC RELEVANCE | IMPACT TIMELINE |
|---|---|---|---|
| Certified bakery mixes | +0.9% | USA, UK | Short term (<= 2 years) |
| Rice and tapioca blends | +0.7% | Japan, South Korea | Medium term (2-4 years) |
| Private-label sourcing | +0.6% | Europe, North America | Medium term (2-4 years) |
| Non-food starch grades | +0.4% | Global | Long term (>= 4 years) |
Source: Fact.MR analysis. Updated Aug 20, 2026
- Certified bakery mixes: Flour blends are expected to create opportunity where home bakers want shorter preparation steps and clear ingredient claims. King Arthur Baking launched Buttermilk Biscuit Flour Blend on March 5, 2025.
- Rice and tapioca blends: Product teams are projected to test alternative starch sources for noodles and gluten-managed recipes. Cassava starch helps brands reduce dependence on one grain stream when wheat sourcing is costly.
- Private-label sourcing: Retailers can expand non-GMO flour and baking mixes under store brands when suppliers provide batch records and predictable costs.
- Non-food starch grades: Industrial starch use is anticipated to support additional volume where paper and textile plants accept non-GMO sourcing documentation.
Restraints Impact Analysis
| RESTRAINT | (~) % IMPACT ON CAGR | GEOGRAPHIC RELEVANCE | IMPACT TIMELINE |
|---|---|---|---|
| Certification and audit cost | -1.0% | Global | Short term (<= 2 years) |
| Crop segregation limits | -0.8% | USA, Europe | Short term (<= 2 years) |
| Food price pressure | -0.6% | Europe, East Asia | Medium term (2-4 years) |
| Claim confusion | -0.4% | USA, Japan | Long term (>= 4 years) |
Source: Fact.MR analysis. Updated Aug 20, 2026
- Certification and audit cost: Smaller mills are expected to face pressure when verification work raises overhead before any price premium is secured.
- Crop segregation limits: Non-GMO claims depend on clean handling from grain intake to bagged flour. Shared silos and transport can raise testing costs.
- Food price pressure: Premium flour formats are likely to face switching risk when households compare clean-label claims with shelf price. BLS reported in January 2026 that U.S. food prices increased 3.1% from December 2024 to December 2025.
- Claim confusion: Consumers can confuse non-GMO, organic and bioengineered disclosure terms. Suppliers need clear label language so claims do not overreach certification evidence.
Which countries are scaling Non-GMO Flour Market fastest?
- The country comparison spans 1.2 percentage points and forms three practical growth bands across the forecast period.
- South Korea remains 0.1 percentage point above the USA as imported clean-label foods and labeling discipline shape packaged food procurement.
- The USA remains 0.6 percentage point above the U.K. through flour milling capacity and mature organic food retailing.
- The U.K. remains 0.3 percentage point above France because organic cereal acreage and supermarket organic sales keep certified products visible.
- France remains 0.2 percentage point above Germany through bakery consumption and price-stable cereal categories.
- Germany closes the displayed range through organic farmland, retail bakery access and value-focused flour purchasing.
Comparable CAGRs create different entry conditions because flour milling scale, crop sourcing, certification rules and food-price sensitivity vary by country. Full report coverage includes North America, Latin America, Europe, East Asia, South Asia and Pacific, Middle East and Africa.
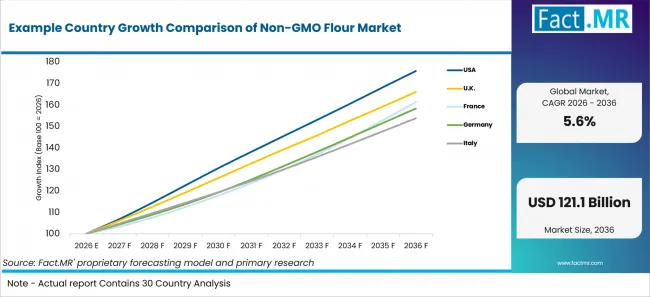
Example Country Growth Comparison Of Non Gmo Flour Market | Source: Fact.MR
| Country | CAGR (2026-2036) |
|---|---|
| South Korea | 5.9% |
| USA | 5.8% |
| U.K. | 5.2% |
| France | 4.9% |
| Germany | 4.7% |
Source: Fact.MR analysis. Updated Aug 20, 2026
What supports South Korea adoption?
5.9% CAGR through 2036, supported by imported food channels and label scrutiny.
South Korea’s growth reflects expanding grocery sales, imported food availability and close attention to product labeling. USDA ERS reported that U.S. food-at-home prices increased 1.2% in 2024, supporting access to imported flour and starch products. Non-GMO rice, wheat and maize ingredients can benefit where brands require clear sourcing and bilingual documentation, although import inspections, currency exposure and detailed labeling requirements may raise compliance costs.
What supports USA adoption?
5.8% CAGR through 2036, supported by milling capacity and organic retail depth.
The USA’s growth reflects substantial flour milling activity and a large market for certified food products. All wheat ground for flour reached 907 million bushels in 2025, while organic food sales reached USD 70.1 billion. Non-GMO flour can appeal to bakeries and brands seeking familiar recipes with clearer sourcing claims, although food-price pressure, private-label competition and consumer confusion around non-GMO and bioengineered disclosures may restrain premiums.
How is the U.K. scaling demand?
5.2% CAGR through 2036, shaped by organic cereal acreage and grocery visibility.
The U.K.’s growth is supported by organic cereal production and stronger supermarket visibility for certified food products. Organically grown cereal area reached 50 thousand hectares in 2025, while organic supermarket sales increased 7%. Retail bakeries and foodservice buyers can use verified flour to support natural and origin-focused positioning, although limited domestic acreage, inflation and added audit paperwork may slow adoption among smaller buyers.
What supports France adoption?
4.9% CAGR through 2036, supported by bakery culture and measured food inflation.
France’s growth reflects a large bakery market and relatively stable consumer-price conditions. In France, bread and cereal prices increased 0.7% year over year in November 2025, while annual average inflation was 0.9% in 2025. Non-GMO wheat, rice and maize ingredients can support bakery and confectionery applications where origin and label clarity matter, although premium pricing and overlap between organic and non-GMO claims may limit differentiation.
How is Germany developing demand?
4.7% CAGR through 2036, shaped by organic farmland and value-oriented bakery buying.
Germany’s growth is supported by a sizable organic farming base and demand for verified ingredients in industrial bakery and private-label channels. In Germany, organically farmed cereals covered 393,698 hectares in 2026, while 35,881 farms operated organically across about 1.99 million hectares in 2024. Non-GMO flour can support clean-label positioning, although value-oriented retail, limited pricing headroom and stricter storage and transport controls may constrain supplier margins.
Who leads the Non-GMO Flour Market?
King Arthur Baking, Bob’s Red Mill and Eden Foods have directly verifiable flour-market relevance; United Natural Foods (UNFI) is relevant as a wholesale distributor of natural, organic and specialty grocery products.
King Arthur Baking has direct flour-market relevance through its flour portfolio and non-GMO sourcing. Bob’s Red Mill supports the category through Non-GMO Project Verified grain and flour products. Eden Foods supports organic flour and grain categories, while United Natural Foods (UNFI) provides wholesale distribution reach for natural, organic and specialty grocery products.
Which companies are the key providers?
Key companies include King Arthur Baking Company; Bob’s Red Mill Natural Foods; United Natural Foods (UNFI); and Eden Foods.
- King Arthur Baking Company
- Bob’s Red Mill Natural Foods
- United Natural Foods (UNFI)
- Eden Foods
What is the report’s scope and coverage?
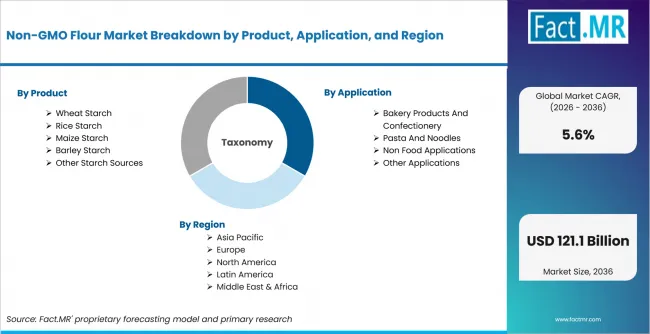
Non Gmo Flour Market Breakdown By Product, Application, And Region | Source: Fact.MR
| Attribute | Details |
|---|---|
| Quantitative Units | USD billion |
| Market Definition | Non-GMO flour and starch-based milling ingredients used in food and selected non-food applications where sourcing records and claim documentation shape qualification |
| Product | Wheat Starch; Rice Starch; Maize Starch; Barley Starch; Other Starch Sources |
| Application | Bakery Products And Confectionery; Pasta And Noodles; Non Food Applications; Other Applications |
| Regions Covered | North America; Latin America; Europe; East Asia; South Asia and Pacific; Middle East and Africa |
| Countries Covered | USA; U.K.; France; Germany; Italy; South Korea; Japan |
| Key Companies Profiled | King Arthur Baking Company; Bob’s Red Mill Natural Foods; United Natural Foods (UNFI); and Eden Foods |
| Forecast Period | 2026 to 2036 |
| Approach | Hybrid top-down and bottom-up approach using flour production, organic food demand, food-label regulation, starch applications, country adoption patterns and verified company portfolio review |
Source: Fact.MR analysis. Updated Aug 20, 2026
Bibliography
- U.S. Bureau of Labor Statistics. (2026, January 21). Consumer Price Index: 2025 in review.
- Department for Environment, Food & Rural Affairs. (2026, May 7). Organic farming statistics 2025: United Kingdom. GOV.UK.
- Federal Statistical Office (Destatis). (2025, August 13). Inflation rate at +2.0% in July 2025.
- Federal Statistical Office (Destatis). (2025, December 5). Arable land and permanent grassland of organic farming in Germany.
- Institut national de la statistique et des études économiques. (2025, December 12). In November 2025, consumer prices fell by 0.2% over one month and rose by 0.9% year on year (Informations Rapides No. 307).
- Institut national de la statistique et des études économiques. (2026, January 15). In December 2025, consumer prices increased by 0.1% over one month and rose by 0.8% year on year (Informations Rapides No. 7).
- King Arthur Baking Company. (2025, March 5). King Arthur Baking Company expands flour line with the launch of Buttermilk Biscuit Flour Blend.
- Ministry of Data and Statistics. (2025, November 4). Consumer Price Index in October 2025.
- Office for National Statistics. (2025, December 17). Consumer price inflation, UK: November 2025.
- Direction de l’information légale et administrative. (2026, August 17). Indice des prix à la consommation : quelle évolution ? [Consumer price index: What is the trend?]. Service-Public.fr.
- Soil Association Certification. (2026). Organic Market Report, 2026.
- U.S. Department of Agriculture, Economic Research Service. (2026, August 13). Organic agriculture.
- U.S. Department of Agriculture, Foreign Agricultural Service. (2025, November 19). South Korea: Retail foods annual (GAIN Report No. KS2025-0038).
- U.S. Department of Agriculture, National Agricultural Statistics Service. (2026, May 1). Flour Milling Products 2025 Summary.
This Report Addresses
- The report provides strategic intelligence on the Non-GMO Flour Market across product and application choices that shape certified flour and starch procurement.
- Segment analysis covers Wheat Starch and Bakery Products And Confectionery as the share leaders within the 2026 market.
- Country outlook evaluates South Korea and the USA alongside the U.K., France, Germany, Italy and Japan.
- Competitive analysis profiles directly verified flour participants King Arthur Baking, Bob’s Red Mill and Eden Foods, with United Natural Foods (UNFI) included as a wholesale distributor.
- Application assessment covers bakery, confectionery, pasta, noodles and selected non-food starch uses.
What does the Non-GMO Flour Market cover?
The Non-GMO Flour Market covers flour and starch ingredients sold with non-GMO sourcing claims. It includes wheat, rice, maize, barley, potato and tapioca sources used in food and selected non-food applications.
Adjacent Fact.MR coverage helps separate this report from finished bakery products. Flour processing remains relevant where milling capacity shapes ingredient availability. Modified starch helps explain texture functions in food and non-food formulas. Waxy maize starch gives maize-based starch context. Whole grain foods clarifies adjacent cereal claims.
What is included in the scope?
The scope includes non-GMO flour and starch products used by food brands, bakeries, pasta producers, confectionery makers and selected industrial users. It also covers identity preservation, batch records, label clarity and recipe performance.
What is excluded from the scope?
The scope excludes conventional flour sold without non-GMO positioning, unrelated bakery additives, enzymes, sweeteners, finished bakery products and retail breads. General grain trading is excluded unless it becomes non-GMO flour or starch.
How Was the Analysis Built?
The analysis draws on 120+ sources, 35+ company portfolios, 25+ countries, and more than 20 industry interviews.
- Primary Research: Primary research includes discussions with manufacturers, service providers, technology developers, distributors, end users, procurement teams, and subject-matter experts. These conversations examine purchasing priorities, product adoption, operational challenges, approval requirements, competitive positioning, and the factors that influence wider market acceptance.
- Desk Research: Desk research covers government statistics, regulatory publications, company filings, trade data, technical studies, industry associations, standards, public policy, and other authoritative sources. Every source used in the analysis is documented in the bibliography.
- Market Sizing and Forecasting: Market estimates combine historical performance, demand indicators, pricing and volume trends, segment shares, company participation, country-level growth, adoption patterns, investment activity, and barriers to market expansion.
- Data Validation and Update Cycle: Findings are validated by comparing primary interviews with public data, company activity, regulatory changes, trade patterns, and industry developments. Regular updates review new product launches, capacity changes, partnerships, approvals, procurement trends, and shifts in commercial adoption.
Segmentation
How is the market segmented?
-
By Product
- Wheat Starch
- Native Wheat Starch
- Modified Wheat Starch
- Rice Starch
- Native Rice Starch
- Modified Rice Starch
- Maize Starch
- Native Maize Starch
- Modified Maize Starch
- Barley Starch
- Native Barley Starch
- Modified Barley Starch
- Other Starch Sources
- Potato Starch
- Tapioca Starch
- Wheat Starch
-
By Application
- Bakery Products And Confectionery
- Bakery Products
- Confectionery Products
- Pasta And Noodles
- Dried Pasta
- Noodles
- Non Food Applications
- Paper Industry
- Textile Industry
- Adhesives
- Pharmaceuticals
- Other Applications
- Processed Foods
- Animal Feed
- Bakery Products And Confectionery
-
By Region
- North America
- Latin America
- Western Europe
- Eastern Europe
- East Asia
- South Asia and Pacific
- Middle East & Africa
Frequently Asked Questions
How big is the non-GMO flour market in 2026?
What is the CAGR of the non-GMO flour market from 2026 to 2036?
Which product leads the non-GMO flour market?
Which application leads the non-GMO flour market?
Who are the leading companies in the non-GMO flour market?
Who worked on this report


Preview the report firsthand - request a free sample
Free SampleGet the brochure for pricing and purchase details
Download PDF