Ammonium Chloride Market
Ammonium Chloride Market Analysis, By Grade, By Application, and Region - Market Insights 2025 to 2035
Analysis Of Ammonium Chloride Market Covering 30+ Countries Including Analysis Of US, Canada, UK, Germany, France, Nordics, GCC Countries, Japan, Korea And Many More
Ammonium Chloride Market Outlook 2025 to 2035
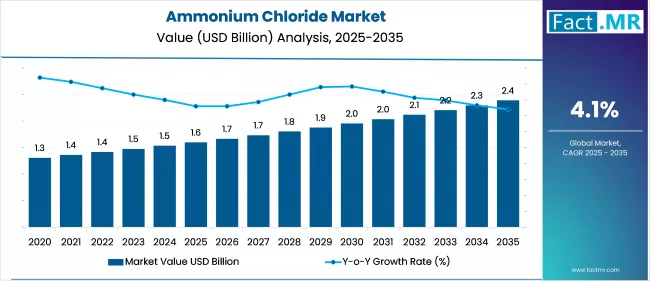
The global ammonium chloride market is projected to increase from USD 1.6 billion in 2025to USD 2.4 billion by 2035, with a CAGR of 4.1% during the forecast period. Growth is driven by rising demand for nitrogen-rich fertilizers, especially in Asia, to boost crop yields. Global manufacturing standards and specialty chemical innovation are driving pharmaceutical and battery-grade applications.
What are the Drivers of Ammonium Chloride Market?
Ammonium chloride demand in agriculture, especially fertilizer, is a major market driver. Crop yield and global food production depend on fertilizers with ammonium chloride. The growth of ammonium chloride fertilizer will continue to be driven by agriculture. The UN predicts 9.8 billion people by 2050. This pressures the agriculture sector to produce more food on limited land, which increases demand for fertilizers that improve soil fertility and crop yields. Precision agriculture maximizes crop yields by using ammonium chloride more efficiently.
Many nations are encouraging agricultural improvements to meet food security goals. Most countries, including India, China, and Nigeria, have increased public sector investments in fertilizers, including ammonium chloride. As ammonium chloride maintains soil fertility, it helps farmers overcome modern agricultural challenges and boosts market growth.
Ammonium chloride has numerous applications in industries such as pharmaceuticals, textiles, and chemicals. It is used as an expectorant in cough medications by the pharmaceutical industry and in the textile industry for dyeing and tanning. Ammonium chloride's versatile nature makes it an essential component in many industrial processes, which contributes to market growth.
Ammonium chloride is used as a livestock feed additive to supplement essential nutrients and improve animal health. As the demand for animal products such as meat and dairy rises, so will the use of ammonium chloride in animal feed, boosting the market growth of ammonium chloride.
What are the Regional Trends of Ammonium Chloride Market?
Ammonium chloride demand in North America remains strong, primarily driven by the agriculture sector. In the U.S. and Canada, it is widely used in fertilizers, metal treatment, and various industrial processes. Growing emphasis on sustainable farming and environmentally responsible manufacturing is influencing market trends.
Both countries are actively enhancing ammonium chloride production methods and expanding their application scope. A well-established distribution network and a robust base of industrial users further support market growth in the region.
Environmental and safety regulations in the EU affect the market. Europe is adopting more sustainable production methods and developing advanced textile and pharmaceutical applications. With public and private sector investments, Germany, France, and the Netherlands are improving production processes and regulatory compliance.
China, India, and Japan are major producers of ammonium chloride fertilizers for crop and industrial use. Meeting rising demand requires significant production capacity and infrastructure investments. The region is also investigating advances in production technology and manufacturing sustainability. In addition, economic growth and agricultural activities drive the ammonium chloride market share in this region.
The ammonium chloride market is growing in LAMEA, with a focus on agricultural development and industrial diversification. Countries in this region are investing in ammonium chloride solutions for the agriculture industry. New ammonium chloride production facilities and infrastructure are being built to use local resources. Due to vast agricultural areas and industrial growth prospects, the market potential is high, but economic constraints and infrastructure development are slowing growth.
What are the Challenges and Restraining Factors of Ammonium Chloride Market?
The presence of alternative fertilizers and chemicals on the market may pose a challenge to the ammonium chloride market. Substitutes, such as urea and ammonium sulfate, provide comparable benefits and are widely available. The availability of these alternatives may cause a shift in consumer preferences, reducing the demand for ammonium chloride.
Ammonium chloride is produced using raw materials like ammonia and hydrochloric acid. Price fluctuations in these raw materials can affect ammonium chloride production costs. Price volatility can make the market less predictable and negatively impact profitability, stifling market growth.
Environmental concerns about the use and production of ammonium chloride also act as a major constraint. The chemical's manufacturing process produces byproducts that, if not managed properly, can contribute to water and air pollution. Countries with strict environmental regulations, such as the European Union, are enforcing tighter controls on emissions and waste management, resulting in higher compliance costs and operational burdens for manufacturers.
Exposure to ammonium chloride poses health and safety risks, particularly in industrial and laboratory settings, which limit its use. If not handled properly, the compound can cause respiratory irritation and other health problems, prompting industries to put in place strict safety measures and worker protection protocols. These additional requirements drive up the overall cost of handling and storage.
Furthermore, competition from substitutes such as urea and ammonium sulfate in the fertilizer segment presents a new challenge, particularly in markets where these alternatives are more cost-effective or preferred due to regulatory or agronomic considerations.
Country-Wise Outlook
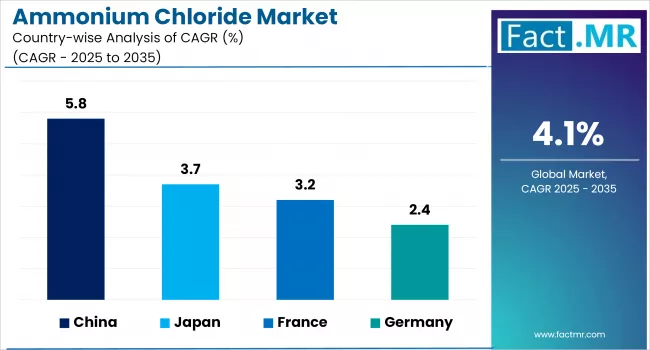
Germany’s Industrial Demand Fuels Ammonium Chloride Market Growth
Germany is a major player in the European ammonium chloride market, due to its well-developed chemical industry and emphasis on environmental sustainability. The country's demand is primarily driven by applications in metalworking, pharmaceuticals, and specialty chemicals, rather than large-scale agriculture, which is more common in Asia. In Germany, ammonium chloride is widely used for galvanizing processes, as a fluxing agent in soldering, and metal cleaningall of which are critical functions in the country's robust automotive and machinery manufacturing sectors.
Germany has strict regulatory oversight, particularly under the European Union's REACH framework (Registration, Evaluation, Authorization, and Restriction of Chemicals). This influences the production, storage, and use of ammonium chloride. German manufacturers frequently have to meet high purity standards while also adhering to environmental protocols for emissions and waste disposal. While this increases operational costs, it also promotes innovation in cleaner production technologies.
In Germany, the goal is to reduce waste and emissions from industrial applications that use ammonium chloride, such as textile printing and battery electrolyte production. The pharmaceutical industry also sees consistent demand for ammonium chloride, which is used as an expectorant in cough medications and controlled-release tablets.
China witnesses Rapid Market Growth Backed by Strong Agricultural Utilization
China is the world's largest producer and consumer of ammonium chloride, accounting for the vast majority of global production. A major driver of this demand is its vast agricultural sector, where ammonium chloride is widely used as a nitrogenous fertilizer, particularly for rice and wheat cultivation. It is the preferred fertilizer in many Chinese provinces with alkaline soils, particularly in northern and central China, due to its low cost and high nitrogen content.
A significant portion of China's ammonium chloride is produced as a byproduct of the soda ash (Solvay) process, making it a cost-effective and widely available compound. This byproduct utilization contributes to China's strategy of reducing industrial waste and increasing resource efficiency throughout chemical production chains.
Regulatory dynamics in China are changing, particularly under the "Blue Sky" policy, which aims to reduce industrial pollution. While ammonium chloride production is boosted by strong domestic demand, companies are under pressure to improve waste management, emissions control, and environmental sustainability. As a result, clean production technologies and advanced filtration systems are becoming increasingly important in major manufacturing hubs.
China has opportunities for exporting surplus ammonium chloride to countries in Southeast Asia, Africa, and Latin America, where fertilizer demand is increasing. Additionally, the Chinese government's support for high-efficiency fertilizers and smart agriculture may encourage more targeted use of ammonium chloride in blends and specialty formulations.
France Embraces Ammonium Chloride for Specialized Agricultural Applications
France is one of Europe's leading agricultural producers, growing crops such as wheat, barley, and sugar beet. Ammonium chloride is a nitrogen source in fertilizers, especially for rice and cereal crops grown in alkaline soils. Although urea and ammonium nitrate dominate the French nitrogen fertilizer market, ammonium chloride is gaining popularity in areas with chloride-deficient soils and special crop requirements.
France's emphasis on green chemistry and sustainable manufacturing encourages industries to use environmentally friendly formulations. While ammonium chloride is still required in many processes, manufacturers are looking into alternative buffer systems and less corrosive salts, which may limit long-term industrial demand unless greener production methods are adopted.
China and India, which dominate global production, provide the majority of France's ammonium chloride imports. Supply chain disruptions in 2022-2023 highlighted France's reliance on Asian chemical markets, prompting discussions among French industry bodies about diversifying sources and improving local manufacturing capabilities.
Category-wise Analysis
Industrial to Exhibit Leading by Grade
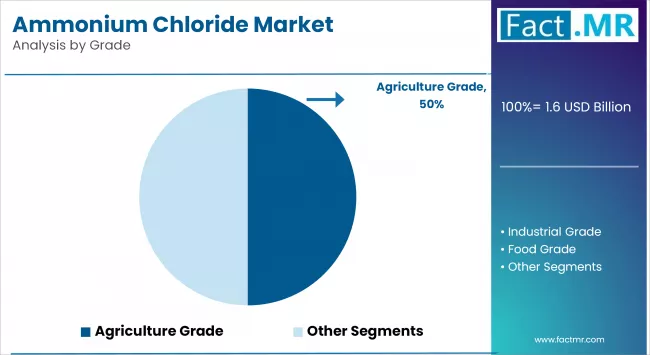
Industrial grade ammonium chloride dominates the ammonium chloride market due to its use in a variety of industries, including metalworking, textiles, and chemical manufacturing. This grade provides the high purity levels required for specific processes like galvanizing and soldering, where the purity of the ammonium chloride used has a direct impact on the quality of the finished product.
Industrial grade ammonium chloride is also used to make other chemicals, making it a versatile compound with applications in a variety of industries. Its use in industrial applications emphasizes its importance in manufacturing processes that require high levels of quality and consistency.
Food grade ammonium chloride is the fastest-growing segment, due to its highest purity and use in food processing and pharmaceutical applications. This grade is safe to consume and meets the strict safety and quality standards required by the food and pharmaceutical industries. It is widely used as a food additive in baking and confectionery to improve flavor and texture.
In pharmaceuticals, food grade ammonium chloride is used to formulate expectorants and other medications, ensuring that the products are safe to consume. The production and use of food-grade ammonium chloride are strictly regulated to ensure the highest levels of safety and quality.
Fertilizers to Exhibit Leading by Application
Fertilizers dominate the ammonium chloride market, as these are vital nitrogen source, which are commonly used in agriculture for crops such as rice and wheat. Its high nitrogen content boosts crop yield and soil fertility, making it especially useful in areas with alkaline soils.
Ammonium chloride contains essential nutrients that promote healthy plant growth, ensuring that crops receive an appropriate nitrogen balance, which is critical for photosynthesis and overall plant development. It is commonly used in fertilizers in Asian countries, where it helps to sustain food production and increase agricultural productivity.
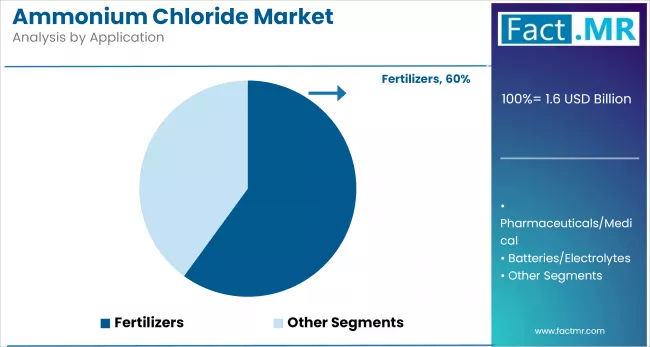
Metalworking is the fastest-growing segment, as ammonium chloride is used extensively in surface treatment processes. It is commonly used in galvanizing, tinning, and soldering to clean metal surfaces and remove impurities such as oxides. The compound acts as a flux, promoting metal adhesion while soldering by cleaning the surfaces and preventing oxidation.
This application is especially important in industries that require precise and clean metal joints, such as the production of electronic components and automotive parts. Ammonium chloride ensures that metal surfaces are properly prepared for subsequent processes, resulting in higher quality and longer-lasting finished products.
Competitive Analysis
The global ammonium chloride market is becoming increasingly competitive, with the presence of several international and regional players competing across key application segments. Major companies focus on capacity expansion, strategic partnerships, and cost-effective production methods to strengthen their market position, particularly in high-demand regions such as Asia-Pacific. China remains a dominant producer and exporter, benefiting from low production costs and high domestic demand, especially in the fertilizer sector.
Ammonium chloride is used in industrial manufacturing to treat metal surfaces such as galvanizing, soldering, and electroplating. The compound cleans metal surfaces and ensures coating adhesion. Ammonium chloride's pH-regulating properties make it useful in dyeing and tanning processes in the textile and leather industries.
Pharmaceutical applications are another promising area. Ammonium chloride is an active ingredient in expectorants and cough syrups, which aid in the clearance of the respiratory tract. It is also used in intravenous solutions to treat hypochloremia and metabolic alkalosis. Regulatory support for affordable essential medicines boosts their demand in healthcare.
Competitive dynamics in the ammonium chloride market are driven by application-specific innovations, raw material price fluctuations (particularly ammonia and hydrochloric acid), and regulatory compliance. As industries transition to more sustainable and high-purity chemical inputs, suppliers with advanced manufacturing capabilities and diverse portfolios are better positioned to seize emerging growth opportunities.
Key players in the ammonium chloride industry include Zaclon LLC, BASF SE, Liuzhou Chemical, GFS Chemicals, The Chemical Company, Dallas Group, Central Glass, Tuticorin Alkali, Tinco, Hubei Yihua, Jinshan Chemical, and other players.
Recent Development
- In March 2024, Actylis and Novo Nordisk Pharmatech A/S partnered to distribute pharmaceutical-grade Benzalkonium Chloride (BKC) to pharmaceutical and medical device markets in Germany, Spain, Portugal, the UK, and Ireland. This collaboration combines Novo Nordisk Pharmatech's manufacturing expertise in high-standard quaternary ammonium compounds (Quats) with Actylis's experience and infrastructure in distributing critical raw materials.
- In January 2024, Southern Petrochemical Industries Corporation (SPIC) Ltd unveiled plans for a major expansion with a total investment of ₹1,900 crore over two years. This expansion aims to enhance production capacity, diversify operations, and drive sustainable growth..
Segmentation of Ammonium Chloride Market
-
By Grade :
- Agriculture Grade
- Industrial Grade
- Food Grade
-
By Application :
- Fertilizers
- Agrochemicals
- Medical/Pharmaceuticals
- Food Additives
- Leather & Textiles
- Batteries
- Metal Works
-
By Region :
- North America
- Latin America
- Western Europe
- Eastern Europe
- East Asia
- South Asia & Pacific
- Middle East & Africa
Table of Content
- Executive Summary
- Global Market Outlook
- Demand-side Trends
- Supply-side Trends
- Technology Roadmap Analysis
- Analysis and Recommendations
- Market Overview
- Market Coverage / Taxonomy
- Market Definition / Scope / Limitations
- Market Background
- Market Dynamics
- Drivers
- Restraints
- Opportunity
- Trends
- Scenario Forecast
- Demand in Optimistic Scenario
- Demand in Conservative Scenario
- Opportunity Map Analysis
- Product Life Cycle Analysis
- Supply Chain Analysis
- Supply Side Participants and their Roles
- Producers
- Mid-Level Participants (Traders/ Agents/ Brokers)
- Wholesalers and Distributors
- Value Added and Value Created at Node in the Supply Chain
- List of Raw Material Suppliers
- List of Existing and Potential Buyers
- Supply Side Participants and their Roles
- Investment Feasibility Matrix
- Value Chain Analysis
- Profit Margin Analysis
- Wholesalers and Distributors
- Retailers
- PESTLE and Porter’s Analysis
- Regulatory Landscape
- By Key Regions
- By Key Countries
- Production and Consumption Statistics
- Import and Export Statistics
- Market Dynamics
- Global Market Analysis 2020-2024 and Forecast, 2025-2035
- Historical Market Size Value (USD Bn) & Volume (Tons) Analysis, 2020-2024
- Current and Future Market Size Value (USD Bn) & Volume (Tons) Projections, 2025-2035
- Y-o-Y Growth Trend Analysis
- Absolute $ Opportunity Analysis
- Global Market Pricing Analysis 2020-2024 and Forecast 2025-2035
- Global Market Analysis 2020-2024 and Forecast 2025-2035, By Grade
- Introduction / Key Findings
- Historical Market Size Value (USD Bn) & Volume (Tons) Analysis By Grade, 2020-2024
- Current and Future Market Size Value (USD Bn) & Volume (Tons) Analysis and Forecast By Grade, 2025-2035
- Agriculture Grade
- Industrial Grade
- Food Grade
- Y-o-Y Growth Trend Analysis By Grade, 2020-2024
- Absolute $ Opportunity Analysis By Grade, 2025-2035
- Global Market Analysis 2020-2024 and Forecast 2025-2035, By Application
- Introduction / Key Findings
- Historical Market Size Value (USD Bn) & Volume (Tons) Analysis By Application, 2020-2024
- Current and Future Market Size Value (USD Bn) & Volume (Tons) Analysis and Forecast By Application, 2025-2035
- Fertilizers
- Agrochemicals
- Medical/Pharmaceuticals
- Food Additives
- Leather & Textiles
- Batteries
- Metal Works
- Y-o-Y Growth Trend Analysis By Application, 2020-2024
- Absolute $ Opportunity Analysis By Application, 2025-2035
- Global Market Analysis 2020-2024 and Forecast 2025-2035, By Region
- Introduction
- Historical Market Size Value (USD Bn) & Volume (Tons) Analysis By Region, 2020-2024
- Current Market Size Value (USD Bn) & Volume (Tons) Analysis and Forecast By Region, 2025-2035
- North America
- Latin America
- Western Europe
- East Asia
- South Asia Pacific
- Eastern Europe
- Middle East & Africa
- Market Attractiveness Analysis By Region
- North America Market Analysis 2020-2024 and Forecast 2025-2035, By Country
- Historical Market Size Value (USD Bn) & Volume (Tons) Trend Analysis By Market Taxonomy, 2020-2024
- Market Size Value (USD Bn) & Volume (Tons) Forecast By Market Taxonomy, 2025-2035
- By Country
- U.S.
- Canada
- Mexico
- By Grade
- By Application
- By Country
- Market Attractiveness Analysis
- By Country
- By Grade
- By Application
- Key Takeaways
- Latin America Market Analysis 2020-2024 and Forecast 2025-2035, By Country
- Historical Market Size Value (USD Bn) & Volume (Tons) Trend Analysis By Market Taxonomy, 2020-2024
- Market Size Value (USD Bn) & Volume (Tons) Forecast By Market Taxonomy, 2025-2035
- By Country
- Brazil
- Chile
- Rest of Latin America
- By Grade
- By Application
- By Country
- Market Attractiveness Analysis
- By Country
- By Grade
- By Application
- Key Takeaways
- Western Europe Market Analysis 2020-2024 and Forecast 2025-2035, By Country
- Historical Market Size Value (USD Bn) & Volume (Tons) Trend Analysis By Market Taxonomy, 2020-2024
- Market Size Value (USD Bn) & Volume (Tons) Forecast By Market Taxonomy, 2025-2035
- By Country
- Germany
- Italy
- France
- U.K.
- Spain
- Russia
- BENELUX
- Rest of Europe
- By Grade
- By Application
- By Country
- Market Attractiveness Analysis
- By Country
- By Grade
- By Application
- Key Takeaways
- East Asia Market Analysis 2020-2024 and Forecast 2025-2035, By Country
- Historical Market Size Value (USD Bn) & Volume (Tons) Trend Analysis By Market Taxonomy, 2020-2024
- Market Size Value (USD Bn) & Volume (Tons) Forecast By Market Taxonomy, 2025-2035
- By Country
- China
- Japan
- South Korea
- By Grade
- By Application
- By Country
- Market Attractiveness Analysis
- By Country
- By Grade
- By Application
- Key Takeaways
- South Asia Pacific Market Analysis 2020-2024 and Forecast 2025-2035, By Country
- Historical Market Size Value (USD Bn) & Volume (Tons) Trend Analysis By Market Taxonomy, 2020-2024
- Market Size Value (USD Bn) & Volume (Tons) Forecast By Market Taxonomy, 2025-2035
- By Country
- India
- ASEAN Countries
- Australia & New Zealand
- Rest of South Asia Pacific
- By Grade
- By Application
- By Country
- Market Attractiveness Analysis
- By Country
- By Grade
- By Application
- Key Takeaways
- Eastern Europe Market Analysis 2020-2024 and Forecast 2025-2035, By Country
- Historical Market Size Value (USD Bn) & Volume (Tons) Trend Analysis By Market Taxonomy, 2020-2024
- Market Size Value (USD Bn) & Volume (Tons) Forecast By Market Taxonomy, 2025-2035
- By Country
- Russia
- Poland
- Hungary
- Balkan & Baltics
- Rest of Eastern Europe
- By Grade
- By Application
- By Country
- Market Attractiveness Analysis
- By Country
- By Grade
- By Application
- Key Takeaways
- Middle East & Africa Market Analysis 2020-2024 and Forecast 2025-2035, By Country
- Historical Market Size Value (USD Bn) & Volume (Tons) Trend Analysis By Market Taxonomy, 2020-2024
- Market Size Value (USD Bn) & Volume (Tons) Forecast By Market Taxonomy, 2025-2035
- By Country
- KSA
- Other GCC Countries
- Turkiye
- South Africa
- Rest of MEA
- By Grade
- By Application
- By Country
- Market Attractiveness Analysis
- By Country
- By Grade
- By Application
- Key Takeaways
- Key Countries Market Analysis
- China
- Pricing Analysis
- Market Share Analysis, 2024
- By Grade
- By Application
- India
- Pricing Analysis
- Market Share Analysis, 2024
- By Grade
- By Application
- U.S.
- Pricing Analysis
- Market Share Analysis, 2024
- By Grade
- By Application
- Germany
- Pricing Analysis
- Market Share Analysis, 2024
- By Grade
- By Application
- Japan
- Pricing Analysis
- Market Share Analysis, 2024
- By Grade
- By Application
- China
- Market Structure Analysis
- Competition Dashboard
- Competition Benchmarking
- Market Share Analysis of Top Players
- By Regional
- By Grade
- By Application
- Competition Analysis
- Competition Deep Dive
- Zaclon LLC
- Overview
- Product Portfolio
- Profitability by Market Segments (Product/Age /Sales Channel/Region)
- Sales Footprint
- Strategy Overview
- Marketing Strategy
- Product Strategy
- Channel Strategy
- BASF SE
- Overview
- Product Portfolio
- Profitability by Market Segments (Product/Age /Sales Channel/Region)
- Sales Footprint
- Strategy Overview
- Marketing Strategy
- Product Strategy
- Channel Strategy
- Liuzhou Chemical
- Overview
- Product Portfolio
- Profitability by Market Segments (Product/Age /Sales Channel/Region)
- Sales Footprint
- Strategy Overview
- Marketing Strategy
- Product Strategy
- Channel Strategy
- GFS Chemicals
- Overview
- Product Portfolio
- Profitability by Market Segments (Product/Age /Sales Channel/Region)
- Sales Footprint
- Strategy Overview
- Marketing Strategy
- Product Strategy
- Channel Strategy
- The Chemical Company
- Overview
- Product Portfolio
- Profitability by Market Segments (Product/Age /Sales Channel/Region)
- Sales Footprint
- Strategy Overview
- Marketing Strategy
- Product Strategy
- Channel Strategy
- Dallas Group
- Overview
- Product Portfolio
- Profitability by Market Segments (Product/Age /Sales Channel/Region)
- Sales Footprint
- Strategy Overview
- Marketing Strategy
- Product Strategy
- Channel Strategy
- Central Glass
- Overview
- Product Portfolio
- Profitability by Market Segments (Product/Age /Sales Channel/Region)
- Sales Footprint
- Strategy Overview
- Marketing Strategy
- Product Strategy
- Channel Strategy
- Tuticorin Alkali
- Overview
- Product Portfolio
- Profitability by Market Segments (Product/Age /Sales Channel/Region)
- Sales Footprint
- Strategy Overview
- Marketing Strategy
- Product Strategy
- Channel Strategy
- Tinco
- Overview
- Product Portfolio
- Profitability by Market Segments (Product/Age /Sales Channel/Region)
- Sales Footprint
- Strategy Overview
- Marketing Strategy
- Product Strategy
- Channel Strategy
- Hubei Yihua
- Overview
- Product Portfolio
- Profitability by Market Segments (Product/Age /Sales Channel/Region)
- Sales Footprint
- Strategy Overview
- Marketing Strategy
- Product Strategy
- Channel Strategy
- Jinshan Chemica
- Overview
- Product Portfolio
- Profitability by Market Segments (Product/Age /Sales Channel/Region)
- Sales Footprint
- Strategy Overview
- Marketing Strategy
- Product Strategy
- Channel Strategy
- Zaclon LLC
- Competition Deep Dive
- Assumptions & Acronyms Used
- Research Methodology
List Of Table
- Table 1: Global Market Value (USD Bn) Forecast by Region, 2020 to 2035
- Table 2: Global Market Volume (Tons) Forecast by Region, 2020 to 2035
- Table 3: Global Market Value (USD Bn) Forecast by Grade, 2020 to 2035
- Table 4: Global Market Volume (Tons) Forecast by Grade, 2020 to 2035
- Table 5: Global Market Value (USD Bn) Forecast by Application, 2020 to 2035
- Table 6: Global Market Volume (Tons) Forecast by Application, 2020 to 2035
- Table 7: North America Market Value (USD Bn) Forecast by Country, 2020 to 2035
- Table 8: North America Market Volume (Tons) Forecast by Country, 2020 to 2035
- Table 9: North America Market Value (USD Bn) Forecast by Grade, 2020 to 2035
- Table 10: North America Market Volume (Tons) Forecast by Grade, 2020 to 2035
- Table 11: North America Market Value (USD Bn) Forecast by Application, 2020 to 2035
- Table 12: North America Market Volume (Tons) Forecast by Application, 2020 to 2035
- Table 13: Latin America Market Value (USD Bn) Forecast by Country, 2020 to 2035
- Table 14: Latin America Market Volume (Tons) Forecast by Country, 2020 to 2035
- Table 15: Latin America Market Value (USD Bn) Forecast by Grade, 2020 to 2035
- Table 16: Latin America Market Volume (Tons) Forecast by Grade, 2020 to 2035
- Table 17: Latin America Market Value (USD Bn) Forecast by Application, 2020 to 2035
- Table 18: Latin America Market Volume (Tons) Forecast by Application, 2020 to 2035
- Table 19: Western Europe Market Value (USD Bn) Forecast by Country, 2020 to 2035
- Table 20: Western Europe Market Volume (Tons) Forecast by Country, 2020 to 2035
- Table 21: Western Europe Market Value (USD Bn) Forecast by Grade, 2020 to 2035
- Table 22: Western Europe Market Volume (Tons) Forecast by Grade, 2020 to 2035
- Table 23: Western Europe Market Value (USD Bn) Forecast by Application, 2020 to 2035
- Table 24: Western Europe Market Volume (Tons) Forecast by Application, 2020 to 2035
- Table 25: East Asia Market Value (USD Bn) Forecast by Country, 2020 to 2035
- Table 26: East Asia Market Volume (Tons) Forecast by Country, 2020 to 2035
- Table 27: East Asia Market Value (USD Bn) Forecast by Grade, 2020 to 2035
- Table 28: East Asia Market Volume (Tons) Forecast by Grade, 2020 to 2035
- Table 29: East Asia Market Value (USD Bn) Forecast by Application, 2020 to 2035
- Table 30: East Asia Market Volume (Tons) Forecast by Application, 2020 to 2035
- Table 31: South Asia Pacific Market Value (USD Bn) Forecast by Country, 2020 to 2035
- Table 32: South Asia Pacific Market Volume (Tons) Forecast by Country, 2020 to 2035
- Table 33: South Asia Pacific Market Value (USD Bn) Forecast by Grade, 2020 to 2035
- Table 34: South Asia Pacific Market Volume (Tons) Forecast by Grade, 2020 to 2035
- Table 35: South Asia Pacific Market Value (USD Bn) Forecast by Application, 2020 to 2035
- Table 36: South Asia Pacific Market Volume (Tons) Forecast by Application, 2020 to 2035
- Table 37: Eastern Europe Market Value (USD Bn) Forecast by Country, 2020 to 2035
- Table 38: Eastern Europe Market Volume (Tons) Forecast by Country, 2020 to 2035
- Table 39: Eastern Europe Market Value (USD Bn) Forecast by Grade, 2020 to 2035
- Table 40: Eastern Europe Market Volume (Tons) Forecast by Grade, 2020 to 2035
- Table 41: Eastern Europe Market Value (USD Bn) Forecast by Application, 2020 to 2035
- Table 42: Eastern Europe Market Volume (Tons) Forecast by Application, 2020 to 2035
- Table 43: Middle East & Africa Market Value (USD Bn) Forecast by Country, 2020 to 2035
- Table 44: Middle East & Africa Market Volume (Tons) Forecast by Country, 2020 to 2035
- Table 45: Middle East & Africa Market Value (USD Bn) Forecast by Grade, 2020 to 2035
- Table 46: Middle East & Africa Market Volume (Tons) Forecast by Grade, 2020 to 2035
- Table 47: Middle East & Africa Market Value (USD Bn) Forecast by Application, 2020 to 2035
- Table 48: Middle East & Africa Market Volume (Tons) Forecast by Application, 2020 to 2035
List Of Figures
- Figure 1: Global Market Volume (Tons) Forecast 2020 to 2035
- Figure 2: Global Market Pricing Analysis
- Figure 3: Global Market Value (USD Bn) Forecast 2020 to 2035
- Figure 4: Global Market Value Share and BPS Analysis by Grade, 2025 and 2035
- Figure 5: Global Market Y-o-Y Growth Comparison by Grade, 2025 to 2035
- Figure 6: Global Market Attractiveness Analysis by Grade
- Figure 7: Global Market Value Share and BPS Analysis by Application, 2025 and 2035
- Figure 8: Global Market Y-o-Y Growth Comparison by Application, 2025 to 2035
- Figure 9: Global Market Attractiveness Analysis by Application
- Figure 10: Global Market Value (USD Bn) Share and BPS Analysis by Region, 2025 and 2035
- Figure 11: Global Market Y-o-Y Growth Comparison by Region, 2025 to 2035
- Figure 12: Global Market Attractiveness Analysis by Region
- Figure 13: North America Market Incremental $ Opportunity, 2025 to 2035
- Figure 14: Latin America Market Incremental $ Opportunity, 2025 to 2035
- Figure 15: Western Europe Market Incremental $ Opportunity, 2025 to 2035
- Figure 16: East Asia Market Incremental $ Opportunity, 2025 to 2035
- Figure 17: South Asia Pacific Market Incremental $ Opportunity, 2025 to 2035
- Figure 18: Eastern Europe Market Incremental $ Opportunity, 2025 to 2035
- Figure 19: Middle East & Africa Market Incremental $ Opportunity, 2025 to 2035
- Figure 20: North America Market Value Share and BPS Analysis by Country, 2025 and 2035
- Figure 21: North America Market Value Share and BPS Analysis by Grade, 2025 and 2035
- Figure 22: North America Market Y-o-Y Growth Comparison by Grade, 2025 to 2035
- Figure 23: North America Market Attractiveness Analysis by Grade
- Figure 24: North America Market Value Share and BPS Analysis by Application, 2025 and 2035
- Figure 25: North America Market Y-o-Y Growth Comparison by Application, 2025 to 2035
- Figure 26: North America Market Attractiveness Analysis by Application
- Figure 27: Latin America Market Value Share and BPS Analysis by Country, 2025 and 2035
- Figure 28: Latin America Market Value Share and BPS Analysis by Grade, 2025 and 2035
- Figure 29: Latin America Market Y-o-Y Growth Comparison by Grade, 2025 to 2035
- Figure 30: Latin America Market Attractiveness Analysis by Grade
- Figure 31: Latin America Market Value Share and BPS Analysis by Application, 2025 and 2035
- Figure 32: Latin America Market Y-o-Y Growth Comparison by Application, 2025 to 2035
- Figure 33: Latin America Market Attractiveness Analysis by Application
- Figure 34: Western Europe Market Value Share and BPS Analysis by Country, 2025 and 2035
- Figure 35: Western Europe Market Value Share and BPS Analysis by Grade, 2025 and 2035
- Figure 36: Western Europe Market Y-o-Y Growth Comparison by Grade, 2025 to 2035
- Figure 37: Western Europe Market Attractiveness Analysis by Grade
- Figure 38: Western Europe Market Value Share and BPS Analysis by Application, 2025 and 2035
- Figure 39: Western Europe Market Y-o-Y Growth Comparison by Application, 2025 to 2035
- Figure 40: Western Europe Market Attractiveness Analysis by Application
- Figure 41: East Asia Market Value Share and BPS Analysis by Country, 2025 and 2035
- Figure 42: East Asia Market Value Share and BPS Analysis by Grade, 2025 and 2035
- Figure 43: East Asia Market Y-o-Y Growth Comparison by Grade, 2025 to 2035
- Figure 44: East Asia Market Attractiveness Analysis by Grade
- Figure 45: East Asia Market Value Share and BPS Analysis by Application, 2025 and 2035
- Figure 46: East Asia Market Y-o-Y Growth Comparison by Application, 2025 to 2035
- Figure 47: East Asia Market Attractiveness Analysis by Application
- Figure 48: South Asia Pacific Market Value Share and BPS Analysis by Country, 2025 and 2035
- Figure 49: South Asia Pacific Market Value Share and BPS Analysis by Grade, 2025 and 2035
- Figure 50: South Asia Pacific Market Y-o-Y Growth Comparison by Grade, 2025 to 2035
- Figure 51: South Asia Pacific Market Attractiveness Analysis by Grade
- Figure 52: South Asia Pacific Market Value Share and BPS Analysis by Application, 2025 and 2035
- Figure 53: South Asia Pacific Market Y-o-Y Growth Comparison by Application, 2025 to 2035
- Figure 54: South Asia Pacific Market Attractiveness Analysis by Application
- Figure 55: Eastern Europe Market Value Share and BPS Analysis by Country, 2025 and 2035
- Figure 56: Eastern Europe Market Value Share and BPS Analysis by Grade, 2025 and 2035
- Figure 57: Eastern Europe Market Y-o-Y Growth Comparison by Grade, 2025 to 2035
- Figure 58: Eastern Europe Market Attractiveness Analysis by Grade
- Figure 59: Eastern Europe Market Value Share and BPS Analysis by Application, 2025 and 2035
- Figure 60: Eastern Europe Market Y-o-Y Growth Comparison by Application, 2025 to 2035
- Figure 61: Eastern Europe Market Attractiveness Analysis by Application
- Figure 62: Middle East & Africa Market Value Share and BPS Analysis by Country, 2025 and 2035
- Figure 63: Middle East & Africa Market Value Share and BPS Analysis by Grade, 2025 and 2035
- Figure 64: Middle East & Africa Market Y-o-Y Growth Comparison by Grade, 2025 to 2035
- Figure 65: Middle East & Africa Market Attractiveness Analysis by Grade
- Figure 66: Middle East & Africa Market Value Share and BPS Analysis by Application, 2025 and 2035
- Figure 67: Middle East & Africa Market Y-o-Y Growth Comparison by Application, 2025 to 2035
- Figure 68: Middle East & Africa Market Attractiveness Analysis by Application
- Figure 69: Global Market - Tier Structure Analysis
- Figure 70: Global Market - Company Share Analysis
- FAQs -
What was the global aviation connector market size reported by Fact.MR for 2025?
The global aviation connector market was valued at USD 6.2 billion in 2025.
Who are the major players operating in the aviation connector market?
Prominent players in the market Fischer Connectors SA, IEH Corporation, Amphenol Corporation, Smith Group Plc, and others.
What is the estimated valuation of the aviation connector market in 2035?
The market is expected to reach a valuation of USD 10.4 billion in 2035.
What value CAGR did the aviation connector market exhibit over the last five years?
The historic growth rate of the aviation connector market was 5.1% from 2020-2024.