- Market Value (2025): USD 9.24 Bn
- Estimated Value (2026): USD 9.74 Bn
- Forecast Value (2036): USD 16.6 Bn
- CAGR (2026-2036): 5.5%
What is the Air Quality Control System Market forecast to be worth by 2036?
USD 9.74 billion in 2026 to USD 16.6 billion by 2036, at a 5.5% CAGR.
- According to Fact.MR analysis, air quality control system market reached USD 9.24 billion in 2025.
- Demand will increase from USD 9.74 billion in 2026 to USD 16.6 billion by 2036 as industrial site owners replace older collection and treatment equipment.
- The market is forecast to grow 5.5% CAGR from 2026 to 2036, with industrial exhaust treatment and power generation remaining central applications.
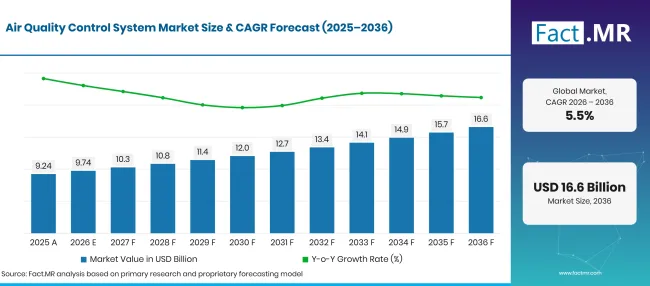
Factmr Air Quality Control System Market Forecast Global | Source: Fact.MR
| Year | Basis | Market Value (USD billion) |
|---|---|---|
| 2025 | Estimated baseline | 9.24 |
| 2036 | Forecast | 16.6 |
| CAGR 2026 to 2036 | Forecast period | 5.5% |
Source: Fact.MR analysis. Updated Oct 15, 2026
What are the defining numbers behind Air Quality Control System Market growth?
Fact.MR estimates that USD 6.9 billion additional market value through 2026 to 2036.
- Demand Drivers in the Market
- Power station site owners review dust and gas-control equipment around their existing boilers and fuel mix.
- Fact.MR estimates that cement site owners need equipment that captures fine dust from grinding and kiln exhaust. Filter selection depends on temperature, dust loading and how much space is available around the production line.
- Steelmanufacturers assess dust collection alongside furnace work and material transfer. Local exhaust capture and filter upkeep affect working conditions as well as emissions released from a plant.
- Industrial facility managers compare the cost of a new collection system with the cost of modifying existing fans and ductwork. Installation scheduling often affects the final equipment decision as much as the purchase price.
- Key Segments Analyzed
- By Product Type: Outdoor Air Quality Control Systems lead with 62.3% share in 2026, mainly at industrial exhaust points.
- By Application: Industrial accounts for a 42.5% share in 2026, reflecting dust and gas treatment within production facilities.
- By Pollutant Type: Particulate Matter represents 41.2% share in 2026, reflecting collection requirements for dust-bearing process air.
- By Technology: Electrostatic Precipitators captures 38.2% share in 2026 where large exhaust streams require particle removal.
- By End-User: Power Generation accounts for a 35.8% share in 2026, reflecting continuous exhaust treatment at thermal power stations.
- Analyst Opinion at Fact.MR
- Shambhu Nath Jha, Principal Consultant at Fact.MR, states, “Air quality control system purchases depend on how well the equipment performs under the dust or gas conditions at a specific plant. Industrial operators compare dust collection performance, installation requirements, energy consumption and maintenance needs before deciding on an upgrade.”
- Strategic Implications
- Equipment manufacturers can clearly explain expected system performance and operating conditions during the design stage, helping plant teams compare proposals more easily.
- Plant engineers need to review the space around existing ducts before deciding whether to replace equipment or upgrade it in stages.
- Service providers can tie maintenance plans to pressure levels and equipment condition so plant owners can spot issues before a scheduled shutdown.
- Industrial companies benefit from separating dust collection needs from acid-gas treatment requirements when planning budgets for air-cleaning projects.
Germany is forecast to grow at a 4.4% CAGR, while Brazil records 4.0% as industrial plants review dust control. The USA carries a 5.4% outlook around power generation and production. The UK is projected to rise at 6.6%, while Japan reaches 6.0% as industrial users keep strict process controls.
How does the Air Quality Control System Market break down by segment?
Outdoor Systems 62.3%; Industrial 42.5%; Particulate Matter 41.2%; Electrostatic Precipitators 38.2%; Power Generation 35.8% in 2026.
Which Product Type holds the larger share?
Outdoor Air Quality Control Systems accounts for a 62.3% share in 2026.
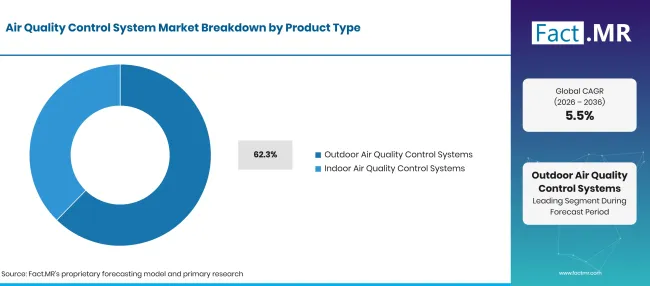
Factmr Air Quality Control System Market Breakdown Product Type | Source: Fact.MR
| Product Type holds the larger share | Share (2026) |
|---|---|
| Outdoor Air Quality Control Systems (Leading segment) | 62.3% |
| Other segments combined | 37.7% |
| Total | 100.0% |
Source: Fact.MR analysis. Updated Oct 15, 2026
Outdoor equipment treats emissions from plant stacks and outdoor production areas where capture systems connect directly to process machinery. Indoor systems focus on occupied spaces or internal process zones. Outdoor purchases generally involve higher airflow volumes and more site engineering because exhaust streams must be handled under changing daily use.
What leads the Application segment?
Industrial accounts for a 42.5% share in 2026.
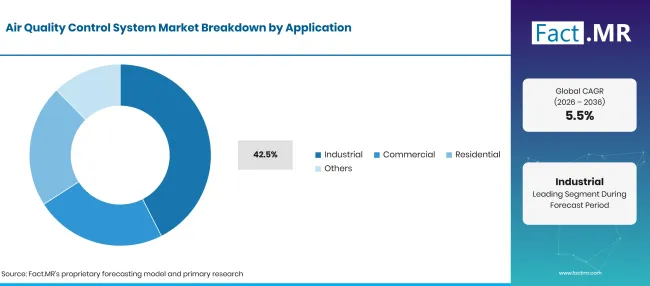
Factmr Air Quality Control System Market Breakdown Application | Source: Fact.MR
| Application segment | Share (2026) |
|---|---|
| Industrial (Leading segment) | 42.5% |
| Other segments combined | 57.5% |
| Total | 100.0% |
Source: Fact.MR analysis. Updated Oct 15, 2026
Industrial uses cover process exhaust from cement plants and metalworking operations where pollutant type determines the collection method. Business sites often focus on ventilation and workplace conditions.
How does Pollutant Type influence equipment spending?
Particulate Matter accounts for a 41.2% share in 2026.
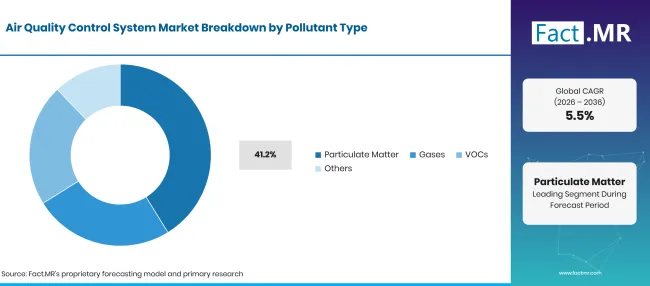
Factmr Air Quality Control System Market Breakdown Pollutant Type | Source: Fact.MR
| Pollutant Type influence equipment spending | Share (2026) |
|---|---|
| Particulate Matter (Leading segment) | 41.2% |
| Other segments combined | 58.8% |
| Total | 100.0% |
Source: Fact.MR analysis. Updated Oct 15, 2026
Particulate matter includes the dust and fine solid material carried in process exhaust. Electrostatic collection and fabric-based filtration address different particle properties and inlet conditions.
Which Technology accounts for the larger share?
Electrostatic Precipitators accounts for a 38.2% share in 2026.
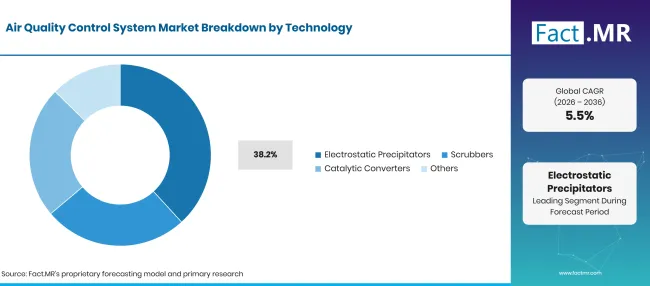
Factmr Air Quality Control System Market Breakdown Technology | Source: Fact.MR
| Technology accounts for the larger share | Share (2026) |
|---|---|
| Electrostatic Precipitators (Leading segment) | 38.2% |
| Other segments combined | 61.8% |
| Total | 100.0% |
Source: Fact.MR analysis. Updated Oct 15, 2026
Electrostatic precipitators charge dust and collect them on plates within the exhaust stream. They suit certain high-volume industrial flows where site owners need continuous dust removal. Scrubbers treat selected gases or particle-bearing streams by contact with a liquid. Catalytic converters serve specific chemical conversion duties under suitable temperature and gas conditions.
How does End-User activity shape sales?
Power Generation accounts for a 35.8% share in 2026.
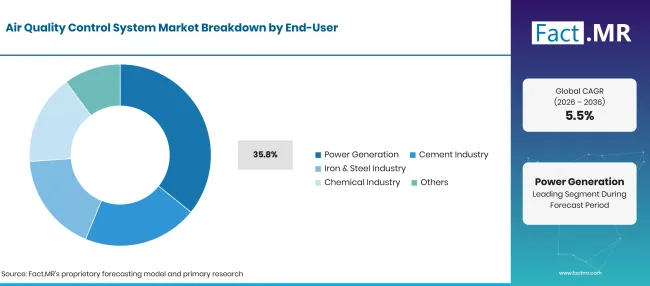
Factmr Air Quality Control System Market Breakdown End User | Source: Fact.MR
| End-User activity shape sales | Share (2026) |
|---|---|
| Power Generation (Leading segment) | 35.8% |
| Other segments combined | 64.2% |
| Total | 100.0% |
Source: Fact.MR analysis. Updated Oct 15, 2026
Power generation sites use air-cleaning equipment according to the fuel burned and the exhaust produced. Cement plants need steady dust handling around kilns and grinding operations. Steel and chemical producers often need site-specific combinations of collection and gas treatment because their process emissions differ from those of electricity producers.
What is accelerating Air Quality Control System Market adoption, and what is holding it back?
Site-specific engineering and shutdown costs can delay installations, but equipment purchases are supported by upgrades to dust collection.
Drivers Impact Analysis
| DRIVER | (~) % IMPACT ON CAGR | GEOGRAPHIC RELEVANCE | IMPACT TIMELINE |
|---|---|---|---|
| Industrial dust collection | +1.0% | Global | Medium term (2–4 years) |
| Power-station retrofit work | +0.9% | USA, Germany, Japan | Medium term (2–4 years) |
| Tighter particulate control | +0.8% | UK, Germany | Long term (≥ 4 years) |
| Condition-based servicing | +0.7% | Global | Short term (≤ 2 years) |
| New factory installations | +0.5% | Brazil, USA | Long term (≥ 4 years) |
Source: Fact.MR analysis. Updated Oct 15, 2026
Opportunity Impact Analysis
| OPPORTUNITY | (~) % IMPACT ON CAGR | GEOGRAPHIC RELEVANCE | IMPACT TIMELINE |
|---|---|---|---|
| Retrofit of existing collectors | +0.8% | Global | Medium term (2–4 years) |
| High-temperature dust handling | +0.7% | Japan, Germany | Medium term (2–4 years) |
| Integrated emissions monitoring | +0.6% | UK, USA | Short term (≤ 2 years) |
| Localized service networks | +0.5% | Brazil | Long term (≥ 4 years) |
Source: Fact.MR analysis. Updated Oct 15, 2026
Restraints Impact Analysis
| RESTRAINTS | (~) % IMPACT ON CAGR | GEOGRAPHIC RELEVANCE | IMPACT TIMELINE |
|---|---|---|---|
| High installation cost | -0.9% | Global | Short term (≤ 2 years) |
| Complex ductwork retrofits | -0.7% | Industrial regions | Medium term (2–4 years) |
| Energy and maintenance expense | -0.6% | Global | Medium term (2–4 years) |
| Shifts in plant fuel mix | -0.5% | Europe, USA | Long term (≥ 4 years) |
Source: Fact.MR analysis. Updated Oct 15, 2026
Which countries are scaling the Air Quality Control System Market through 2036?
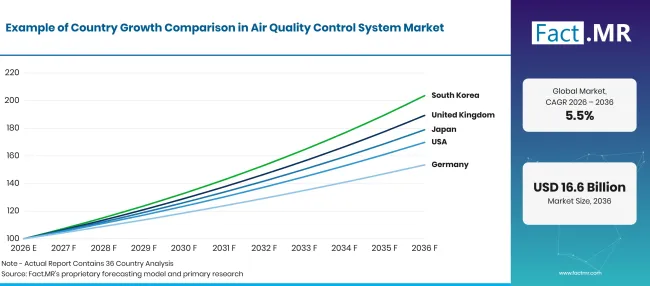
Factmr Air Quality Control System Market Growth Index | Source: Fact.MR
| Country | CAGR (2026–2036) |
|---|---|
| United Kingdom | 6.6% |
| Japan | 6.0% |
| United States | 5.4% |
| Germany | 4.4% |
| Brazil | 4.0% |
Source: Fact.MR analysis. Updated Oct 15, 2026
How is the United Kingdom expanding air-quality control system adoption?
6.6% CAGR, driven by industrial combustion, particulate control, and retrofit activity.
UK industrial facilities continue to invest in dust collection and exhaust-treatment equipment around existing production lines. The Department for Energy Security and Net Zero reported that gas generated 33.7% of major producers’ electricity in the fourth quarter of 2025 [2]. Defra also reported that industrial combustion accounted for 10% of UK PM2.5 emissions in 2024 [5]. Many older plants still require equipment upgrades, emissions monitoring and regular maintenance to keep operations running efficiently.
What supports Japan’s air-quality control system growth?
6.0% CAGR, shaped by thermal generation and specialist industrial filtration.
Japan has a large base of thermal power and industrial facilities that rely on exhaust-control equipment, creating steady demand for servicing and replacement. METI reported that thermal generation accounted for 67.5% of the country’s FY2024 electricity mix [6]. Plant operators look for equipment that can perform reliably in high-temperature conditions and can be serviced efficiently during planned shutdowns.
What is driving air-quality control system sales in the United States?
5.4% CAGR, supported by industrial filtration and power-station exhaust treatment.
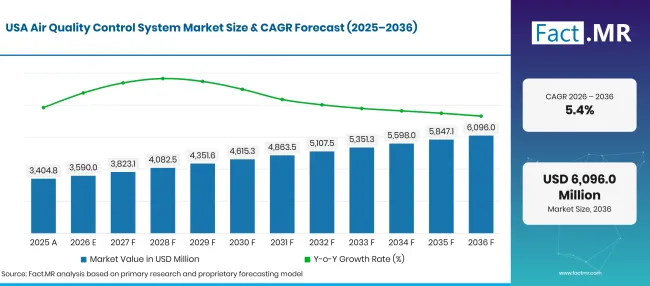
Factmr Air Quality Control System Market Forecast Usa | Source: Fact.MR
U.S. power plants and industrial facilities operate a wide range of dust collection and gas-treatment equipment. The U.S. Energy Information Administration reported about 4.43 thousand TWh of electricity generation in 2025 [1]. When upgrading existing systems, plant operators compare cleaning performance, ease of installation and maintenance costs. They also look for equipment that can fit into current operations without major changes to the facility.
How is Germany developing air-quality control system demand?
4.4% CAGR, influenced by factory exhaust treatment and plant retrofit requirements.
Germany's industrial facilities continue to deal with dust from power generation, material handling and long-running manufacturing operations. Destatis reported that coal-fired generation supplied 96.8 billion kWh to Germany's grid in 2025 [3]. When reviewing new equipment, buyers look at whether existing ductwork, fans and maintenance access can support better filtration. They also weigh the installation and operating costs before moving ahead with an upgrade.
How is Brazil expanding industrial air-treatment investment?
4.0% CAGR, linked to factory activity and industrial dust-control needs.
Brazilian factories use extraction and filtration equipment in mineral handling and manufacturing operations where dust control is important. IBGE reported that industrial production increased 0.6% during 2025 [4]. Plant operators rely on regular filter maintenance, airflow inspections and local service support to keep equipment running well. Many companies focus on extending equipment life before investing in major upgrades or new installations.
Who leads the Air Quality Control System Market?
GE Vernova and Mitsubishi Power address power-industry emissions applications, while Thermax and Babcock & Wilcox offer industrial air-cleaning capabilities.
GE Vernova supplies equipment and solutions used at power plants, with systems designed around each site's operating requirements. Mitsubishi Power, part of Mitsubishi Heavy Industries, provides power-generation equipment and related environmental technologies.
Babcock & Wilcox supplies combustion and environmental equipment for power and industrial facilities. Donaldson focuses on filtration and dust collection systems used across manufacturing sites. Siemens offers automation and industrial control systems that can support emissions monitoring and plant operations, although its product range extends well beyond dust collection equipment.
Which companies are the key providers?
Key companies include GE Vernova Inc.; Siemens Energy AG; Mitsubishi Power; Thermax Ltd.; Babcock & Wilcox Enterprises, Inc.; and Donaldson Company, Inc.
- GE Vernova Inc.
- Siemens Energy AG
- Mitsubishi Power (formerly Mitsubishi Hitachi Power Systems)
- Thermax Ltd.
- Babcock & Wilcox Enterprises, Inc.
- Donaldson Company, Inc.
Bibliography
- [1] U.S. Energy Information Administration. (2026, March 5). U.S. electricity generation in 2025 hit a record, again.
- [2] Department for Energy Security and Net Zero. (2026, February 26). Energy Trends and Prices statistical release: 26 February 2026.
- [3] Statistisches Bundesamt (Destatis). (2026, March 6). Stromerzeugung aus Photovoltaik und Erdgas erreicht im Jahr 2025 neue Höchstwerte.
- [4] Instituto Brasileiro de Geografia e Estatística. (2026, February 3). Produção industrial recua 1,2% em dezembro.
- [5] Department for Environment, Food & Rural Affairs. (2026, February 12). Emissions of air pollutants in the UK: Summary.
- [6] Ministry of Economy, Trade and Industry. (2026, April 14). FY2024 Energy Supply and Demand Report (Revised Report).
- [7] Ministry of the Environment, Japan. (2025). Annual Report on the Environment, the Sound Material-Cycle Society and Biodiversity in Japan 2025.
- [8] Ministry of Economy, Trade and Industry. (2025, April 25). FY2023 Energy Supply and Demand Report (Revised Report).
- [9] U.S. Environmental Protection Agency. (2025). Our Nation’s Air 2025: Trends through 2024.
- [10] Umweltbundesamt. (2026, June 25). Emission von Feinstaub der Partikelgröße PM2,5.
- [11] Umweltbundesamt. (2026, June 25). Emission von Feinstaub der Partikelgröße PM10.
This Report Answers
- The market examines purchase conditions for outdoor and indoor pollution-control equipment.
- Application review covers industrial exhaust treatment alongside commercial and residential use.
- Technology assessment explains collection by electrostatic precipitators and treatment using scrubbers or catalytic systems.
- Country comparisons cover the UK, Japan, USA, Germany and Brazil using country growth rates.
- Competitive review distinguishes direct air-treatment equipment from adjacent industrial automation services.
What does the Air Quality Control System Market cover?
The market covers equipment used to remove dust or treat specified gases within industrial and other air streams. Its technology boundaries include electrostatic precipitation and scrubber-based treatment. The analysis also discusses adjacent applications involving industrial filtration and equipment maintenance. Related equipment categories include dust collector systems used at industrial sites.
What is included in the scope?
Included systems capture particulates or reduce selected gas pollutants as part of a defined air-treatment duty. Both outdoor stack treatment and suitable indoor control installations fall within the market. The assessment considers system selection in relation to pollutant type and practical installation conditions. Buyers also compare equipment with broader industrial filtration solutions for compatible uses.
What is excluded from the scope?
The analysis excludes instruments used only to measure ambient air without treatment capability. Routine factory ventilation without a dedicated pollutant-control function is also outside the central equipment definition. Vehicle emissions equipment is covered only where directly applicable to the stated technology categories. Adjacent systems include industrial bag dust filters suited to different collection duties.
How Was the Analysis Built?
The analysis draws on 120+ sources, 35+ company portfolios, 25+ countries, and more than 20 industry interviews.
- Primary Research: Primary research includes discussions with manufacturers, service providers, technology developers, distributors, end users, and subject-matter experts. These conversations examine purchasing priorities, product adoption, operational challenges, approval requirements, competitive positioning, and the factors that influence wider market acceptance.
- Desk Research: Desk research covers government statistics, regulatory publications, company filings, trade data, technical studies, industry associations, standards, public policy, and other authoritative sources. Every source used in the analysis is documented in the bibliography.
- Market Sizing and Forecasting: Market estimates combine historical performance, demand indicators, pricing and volume trends, segment shares, company participation, country-level growth, adoption patterns, investment activity, and barriers to market expansion.
- Data Validation and Update Cycle: Findings are validated by comparing primary interviews with public data, company activity, regulatory changes, trade patterns, and industry developments. Regular updates review new product launches, capacity changes, partnerships, approvals, and shifts in commercial adoption.
Segmentation
What is the report’s scope and coverage?
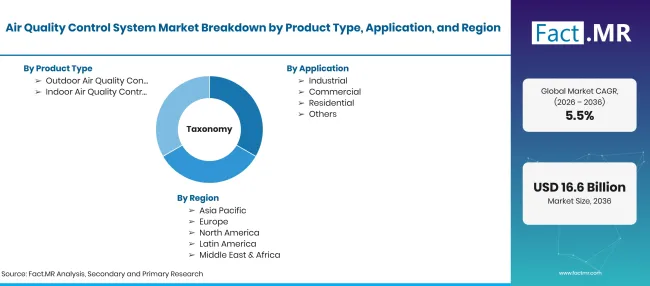
Factmr Air Quality Control System Market Taxonomy 1 | Source: Fact.MR
| Attribute | Details |
|---|---|
| Quantitative Units | USD billion |
| Market Definition | Systems installed to collect particulate matter or treat selected pollutants in indoor and outdoor air streams. The scope includes equipment used for industrial dust collection, stack treatment, and suitable gas-control applications. |
| Product Type | Outdoor Air Quality Control Systems; Indoor Air Quality Control Systems |
| Application | Industrial; Commercial; Residential; Others |
| Pollutant Type | Particulate Matter; Gases; VOCs; Others |
| Technology | Electrostatic Precipitators; Scrubbers; Catalytic Converters; Others |
| End-User | Power Generation; Cement Industry; Iron & Steel Industry; Chemical Industry; Others |
| Regions Covered | North America; Latin America; Western Europe; Eastern Europe; East Asia; South Asia & Pacific; Middle East & Africa |
| Countries Covered | United Kingdom; Japan; United States; Germany; Brazil |
| Companies Profiled | GE Vernova Inc.; Siemens Energy AG; Mitsubishi Power; Thermax Ltd.; Babcock & Wilcox Enterprises, Inc.; Donaldson Company, Inc. |
| Forecast Period | 2026 to 2036 |
| Approach | Assessment of equipment applications, pollutant-control requirements, installation conditions, technology mix, country outlook, supplier portfolios, and publicly available electricity and emissions data. |
Source: Fact.MR analysis. Updated Oct 15, 2026
How is the market segmented?
-
By Product Type:
- Outdoor Air Quality Control Systems
- Indoor Air Quality Control Systems
-
By Application:
- Industrial
- Commercial
- Residential
- Others
-
By Pollutant Type:
- Particulate Matter
- Gases
- VOCs
- Others
-
By Technology:
- Electrostatic Precipitators
- Scrubbers
- Catalytic Converters
- Others
-
By End-User:
- Power Generation
- Cement Industry
- Iron & Steel Industry
- Chemical Industry
- Others
-
By Region:
- North America
- Latin America
- Western Europe
- Eastern Europe
- East Asia
- South Asia & Pacific
- Middle East & Africa
Frequently Asked Questions
How big is the air quality control system market in 2026?
What is the market CAGR from 2026 to 2036?
Which product type leads?
Which application holds the larger share?
Which companies are included?
Who worked on this report


Preview the report firsthand - request a free sample
Free SampleGet the brochure for pricing and purchase details
Download PDF