- Market Value (2025): USD 16.3 Bn
- Estimated Value (2026): USD 18.9 Bn
- Forecast Value (2036): USD 82.7 Bn
- CAGR (2026-2036): 15.9%
What is the Artificial Intelligence Supply Chain Market forecast to be worth by 2036?
USD 18.9 billion in 2026 to USD 82.7 billion by 2036 at 15.9% CAGR.
- The artificial intelligence supply chain market was valued at USD 16.3 billion in 2025
- Demand is projected to rise from USD 18.9 billion in 2026 to USD 82.7 billion by 2036.
- The market is forecast to record 15.9% CAGR from 2026 to 2036 as enterprises use AI to improve planning speed and stock allocation.
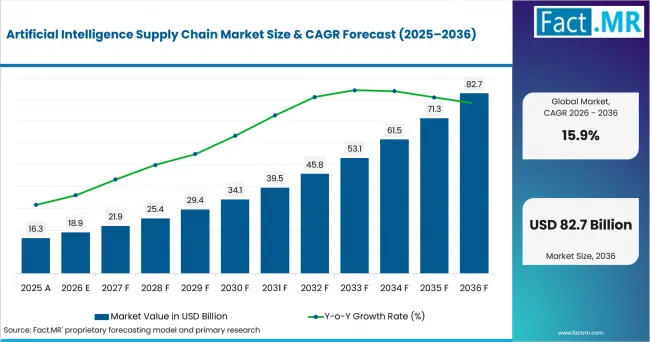
Artificial Intelligence Supply Chain Market Value Analysis | Source: Fact.MR
What are the defining numbers behind Artificial Intelligence Supply Chain Market growth?
USD 63.8 billion absolute opportunity by 2036, led by demand forecasting platforms and demand planning alongside manufacturing.
- Demand Drivers in the Market
- Demand planners need faster responses when promotions, product changes and seasonal shifts alter order patterns before a cycle closes.
- Inventory teams need cleaner allocation across plants and stores when excess stock and stockouts appear inside the same network.
- Transportation teams need route and carrier choices to adjust when capacity or service rules change during daily execution. Related needs may draw on transportation management system functions.
- Key Segments Analyzed
- By AI Supply Chain Solution: Demand Forecasting Platforms are expected to hold 40% share in 2026 through recurring use of predictive demand analytics.
- By Supply Chain Function: Demand Planning is projected to account for 38% share in 2026 since it sets volume assumptions for supply teams.
- By Application Area: Manufacturing is anticipated to capture 42% share in 2026 as production teams align material availability with customer orders.
- By End User: Large Enterprises are estimated to represent 44% share in 2026 owing to multi-region networks and larger data estates.
- By Artificial Intelligence Technology: Machine Learning is forecast to account for 39% share in 2026 through predictive analytics and time-series modeling.
- Analyst Opinion at Fact.MR
- Shambhu Nath Jha, Principal Consultant at Fact.MR, states, “The commercial value of artificial intelligence in supply chains comes from improving a decision that someone can execute. Forecasts must fit inventory and capacity rules. Logistics recommendations must respect service limits. Supplier alerts must lead to a defined response.”
- Strategic Implications
- Supply-chain leaders need named decision owners before AI alerts influence service cost or operating commitments.
- Data teams can first reconcile product and supplier definitions so that model output is not weakened by inconsistent records.
- Operations teams may test AI against capacity and service limits before automated replenishment or routing is approved.
The USA leads at 17.2% CAGR through enterprise software depth and public-private freight data initiatives. China follows at 16.8% through national digital supply-chain policy. Germany records 16.3% through industrial data exchange. Japan reaches 15.8%. India posts 15.2%, the UK records 14.7% and Singapore closes the range at 14.1% through 2036.
How does the Artificial Intelligence Supply Chain Market break down by segment?
Demand Forecasting Platforms lead AI Supply Chain Solution at 40%. Demand Planning leads Supply Chain Function at 38%.
Which AI Supply Chain Solution dominates?
Demand Forecasting Platforms hold 40% share in 2026.
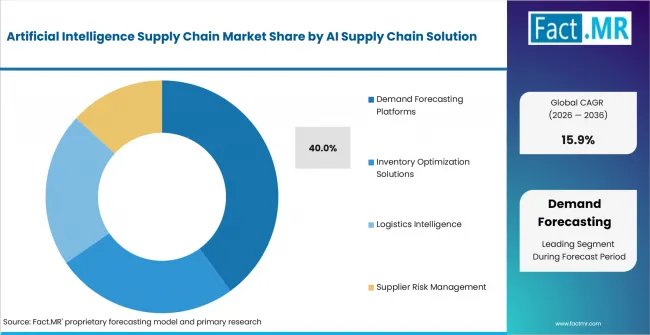
Artificial Intelligence Supply Chain Market Analysis By Ai Supply Chain Solution | Source: Fact.MR
Forecasting work repeats across products and channels. Predictive Demand Analytics helps planners read order history against promotions. Inventory Forecasting turns that view into stock choices before replenishment decisions are made.
What leads the Supply Chain Function segment?
Demand Planning holds 38% share in 2026.
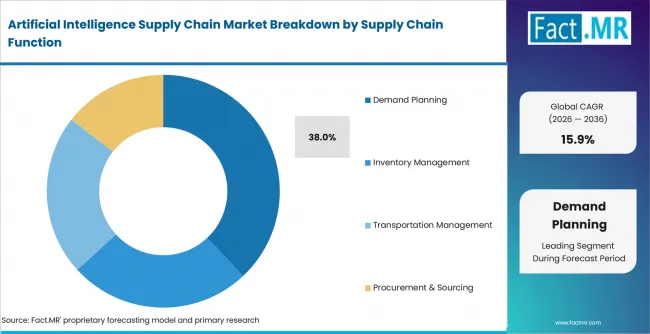
Artificial Intelligence Supply Chain Market Analysis By Supply Chain Function | Source: Fact.MR
Demand Planning sets the volume view used by supply teams. Forecasts must refresh when orders or lead times change. Demand planning solutions remain useful when buyers need clearer review steps.
How does Application Area shape demand?
Manufacturing holds 42% share in 2026.
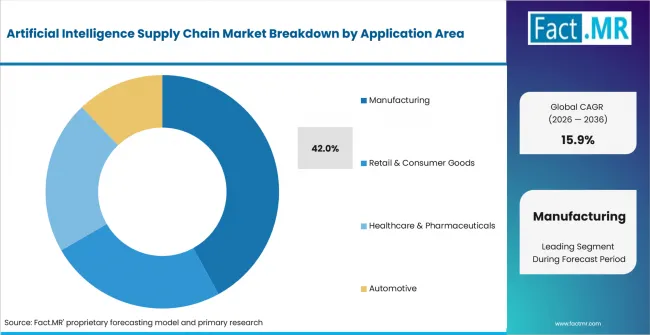
Artificial Intelligence Supply Chain Market Analysis By Application Area | Source: Fact.MR
Manufacturing has the clearest commercial case when a forecast changes a build plan. Material signals can protect a line from shortage. Supplier alerts may prompt sourcing review before service slips.
Why do Large Enterprises lead End User demand?
Large Enterprises hold 44% share in 2026.
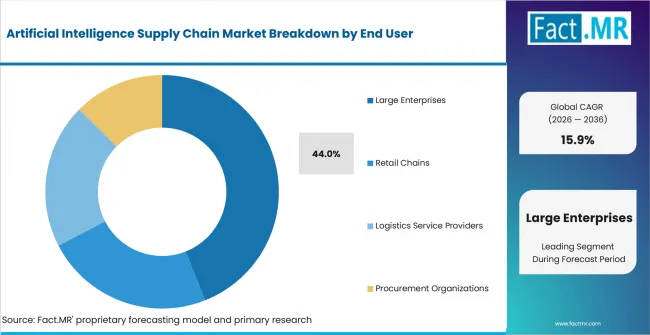
Artificial Intelligence Supply Chain Market Analysis By End User | Source: Fact.MR
Global Manufacturers and Industrial Conglomerates operate many facilities and supplier lanes. Their scale supports central data systems. Enterprise software market needs rise when platforms must work across many business units.
Which Artificial Intelligence Technology leads?
Machine Learning holds 39% share in 2026.
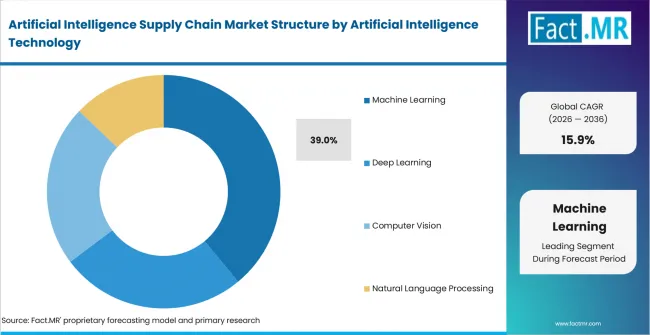
Artificial Intelligence Supply Chain Market Analysis By Artificial Intelligence Technology | Source: Fact.MR
Machine Learning answers routine questions about demand and lead time. It can flag a supplier or lane outside its usual range. Natural Language Processing helps users query fragmented records.
What is accelerating Artificial Intelligence Supply Chain Market adoption, and what is holding it back?
Demand volatility and multi-enterprise visibility support adoption. Logistics pressure and supplier-risk needs add separate routes. Fragmented data and control concerns slow wider use when recommendations affect live commitments.
Drivers Impact Analysis
| DRIVER | COMMERCIAL EFFECT | GEOGRAPHIC RELEVANCE | IMPACT TIMELINE |
|---|---|---|---|
| Volatile demand and shorter planning cycles | Supports forecasting and inventory software renewal | Global with USA and China emphasis | Short to medium term |
| Cross-enterprise data visibility | Supports control towers and exception management | North America, Europe and Asia Pacific | Medium term |
| Supplier risk and traceability needs | Supports procurement and risk analytics | Manufacturing and healthcare networks | Medium term |
| Logistics cost and service pressure | Supports routing and carrier decisions | India, China, USA and Singapore | Current forecast period |
| Agent-assisted planning workflows | Supports wider user attachment | USA, UK, Germany and Japan | Medium to long term |
Source: Fact.MR analysis. Updated Aug 6, 2026
- Demand volatility: Forecast accuracy influences purchasing and production choices. Platforms gain value when they explain assumptions and update plans without manual rebuilds.
- Multi-enterprise visibility: Supply chains cross partners that use different systems. Decision tools become useful when partner signals are turned into clear exceptions.
- Supplier-risk requirements: Procurement teams need earlier warning on performance and compliance before production or service is affected.
Opportunity Impact Analysis
| OPPORTUNITY | COMMERCIAL EFFECT | GEOGRAPHIC RELEVANCE | IMPACT TIMELINE |
|---|---|---|---|
| Agentic planning with bounded approvals | Creates workflow and automation attachment | USA, UK, Germany and Japan | Short to medium term |
| Supplier knowledge graphs | Creates higher-value sourcing use cases | Europe, USA, China and automotive hubs | Medium term |
| Logistics digital twins | Expands route and facility planning | USA, Germany, Singapore and China | Medium term |
| Industry-specific planning | Supports specialized data models and services | Regulated and complex supply chains | Medium to long term |
Source: Fact.MR analysis. Updated Aug 6, 2026
- Agentic planning: Controlled workflow automation is the clearest opportunity. Software can gather evidence and check constraints before action is approved.
- Decision optimization and simulation: Routing and warehouse scenarios create demand when tools can compare more choices than a planner can review manually.
- Industry-specific planning: Healthcare and retail buyers are expected to favor models that reflect service levels and inventory rules inside daily work.
Restraints Impact Analysis
| RESTRAINT | COMMERCIAL EFFECT | GEOGRAPHIC RELEVANCE | IMPACT TIMELINE |
|---|---|---|---|
| Fragmented master and partner data | Delays model use and weakens recommendations | Global enterprise estates | Current forecast period |
| Integration with enterprise systems | Extends implementation and validation cycles | Established manufacturers and retailers | Medium term |
| Model drift and exception accountability | Raises monitoring and human-review needs | Large enterprises worldwide | Medium term |
| Cybersecurity and data-sharing concerns | Limits cross-company automation scope | Europe, public sector and regulated industries | Medium to long term |
Source: Fact.MR analysis. Updated Aug 6, 2026
- Data and integration burden: Records for products and suppliers may differ across business units. Buyers often begin with limited decisions before wider rollout. Warehouse data often feeds the same review through warehouse management system workflows.
- Control and accountability: Supply-chain recommendations can commit stock and money. Approval thresholds and audit logs reduce the risk of poor actions.
- Organizational trust: Planners may resist tools that do not explain the reason for a recommendation. Training and override rules help teams adopt the system.
Which countries are scaling Artificial Intelligence Supply Chain Market fastest?
- The country comparison spans 3.1 percentage points and forms three practical growth bands across the forecast period.
- The USA remains 0.4 percentage point above China through enterprise software depth and freight data work.
- China remains 0.5 percentage point above Germany as digital supply-chain policy supports local enterprise demand.
- Germany remains 0.5 percentage point above Japan through industrial networks and cross-company data exchange.
- Japan remains 0.6 percentage point above India as manufacturing digitalization supports formal planning review.
- India remains 0.5 percentage point above the UK through logistics digitization and e-commerce fulfillment.
- Singapore closes the displayed range through regional logistics and control-tower demand.
Comparable CAGRs create different entry conditions due to network scale and data readiness. Full coverage includes North America and Europe. Asia Pacific and Central and South America are included. The Middle East and Africa complete the regional view.
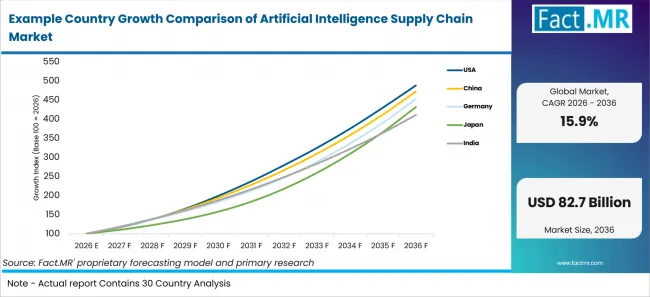
Example Country Growth Comparison Of Artificial Intelligence Supply Chain Market | Source: Fact.MR
| Country | CAGR (2026-2036) |
|---|---|
| USA | 17.2% |
| Germany | 16.3% |
| Japan | 15.8% |
| India | 15.2% |
| UK | 14.7% |
| Singapore | 14.1% |
Source: Fact.MR analysis. Updated Aug 6, 2026
What is driving the USA’s growth through 2036?
17.2% CAGR, driven by enterprise software depth and public-private freight data initiatives.
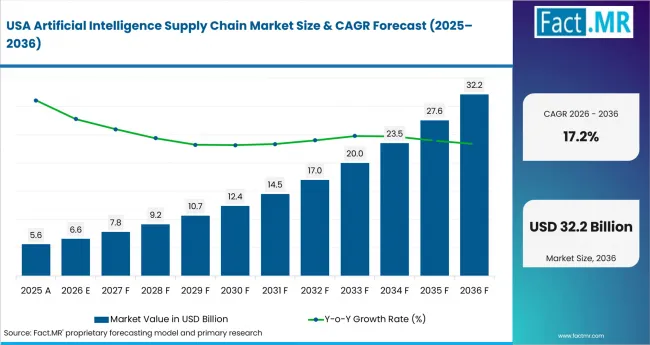
Artificial Intelligence Supply Chain Market Country Value Analysis | Source: Fact.MR
The USA has large software and logistics buyers that operate continent-scale networks. These buyers need planning tools that can read demand and freight signals before commitments are made.
How is China scaling demand?
16.8% CAGR, supported by national policy for digital and intelligent supply chains.
China’s demand route comes through manufacturing clusters and domestic logistics platforms. Large retail and e-commerce networks add another use case for faster planning.
What supports Germany’s outlook?
16.3% CAGR, shaped by industrial supply-chain depth and interoperability requirements.
Germany’s market is anchored in automotive and machinery networks that depend on many independent suppliers. Buyers need trusted data exchange before AI can affect production or sourcing.
What underpins Japan’s growth?
15.8% CAGR, attributable to mobility and manufacturing digitalization.
Japan’s supply-chain demand reflects careful manufacturing review and high service expectations. Enterprises need systems that join demand, supplier and transport decisions without removing human approval.
How is India building demand?
15.2% CAGR, driven by logistics digitization and manufacturing expansion.
India’s supply chains cover national manufacturers and fast-moving retail networks. Buyers need better shipment visibility and stock allocation across a wide operating base. AI tools are expected to help when they simplify daily exceptions for planners.
What shapes the UK outlook?
14.7% CAGR, supported by transport AI policy and data infrastructure work.
The UK combines retail, consumer goods and pharmaceutical supply chains with mature logistics services. Buyers are expected to expand from forecasting into planning and transport review.
How is Singapore developing demand?
14.1% CAGR, driven by its regional logistics role and control-tower demand.
Singapore is a regional trade and distribution hub. Supply-chain tools must coordinate international suppliers and customer commitments across a compact market. Cloud planning and exception management are expected to fit this operating need.
Who leads the Artificial Intelligence Supply Chain Market?
SAP SE and Oracle Corporation show direct relevance through enterprise planning and execution platforms. Microsoft Corporation and International Business Machines Corporation compete through data, workflow and artificial intelligence market capabilities.
Blue Yonder Group, Inc. and Kinaxis Inc. broaden the provider set through supply-chain planning software. Manhattan Associates, Inc. and Infor Inc. add warehouse and network execution depth. Coupa Software Inc. supports sourcing and procurement analytics. NVIDIA Corporation and Amazon Web Services, Inc. support optimization and cloud delivery.
Which companies are the key providers?
Key companies include SAP SE and Oracle Corporation. Microsoft Corporation and International Business Machines Corporation are profiled. Blue Yonder Group, Inc. and Kinaxis Inc. are included. Manhattan Associates, Inc. and Infor Inc. follow. Coupa Software Inc. and NVIDIA Corporation appear with Amazon Web Services, Inc.
- SAP SE
- Oracle Corporation
- Microsoft Corporation
- International Business Machines Corporation
- Blue Yonder Group, Inc.
- Kinaxis Inc.
- Manhattan Associates, Inc.
- Infor Inc.
- Coupa Software Inc.
- NVIDIA Corporation
- Amazon Web Services, Inc.
Bibliography
- Amazon Web Services. (2025, January 16). Maximize business value with the AWS Supply Chain demand planning process. AWS Supply Chain and Logistics Blog.
- NVIDIA. (2025, March 18). NVIDIA open-sources cuOpt for decision optimization. NVIDIA Technical Blog.
- SAP. (2025, July 24). SAP Business AI: Release highlights Q2 2025. SAP News Center.
- U.S. Department of Transportation. (2024, July 24). Freight Logistics Optimization Works platform orientation. U.S. Department of Transportation.
This Report Answers
- The report provides strategic intelligence on solution and function choices that shape AI supply-chain software purchases.
- Segment analysis covers Demand Forecasting Platforms and Demand Planning as the share leaders within the 2026 market.
- Country outlook evaluates the USA and China alongside Germany and Japan. India, the UK and Singapore complete the growth comparison.
- Competitive analysis profiles SAP SE and Oracle Corporation alongside Microsoft Corporation and International Business Machines Corporation.
- Technology assessment covers Machine Learning and Deep Learning. Computer Vision and Natural Language Processing follow. Generative AI and Knowledge Graphs complete the technology view.
What does the Artificial Intelligence Supply Chain Market cover?
AI supply-chain tools improve demand and inventory decisions.
Logistics and supplier-risk decisions complete the market use case. The market covers software and cloud services where AI supports a supply-chain function. Related services are included when they guide planning or execution choices.
What is included in the scope?
The scope includes AI Supply Chain Solution and Supply Chain Function alongside Application Area, End User and Artificial Intelligence Technology.
Coverage spans Demand Forecasting Platforms and Inventory Optimization Solutions. Logistics Intelligence and Supplier Risk Management complete the solution scope.
What is excluded from the scope?
Conventional software without AI support remains outside the scope of this market.
The scope excludes freight revenue and warehouse labor costs. General cloud spending is excluded unless it is sold as part of an AI supply-chain system.
How Was the Analysis Built?
The analysis draws on 120+ sources, 35+ company portfolios, 25+ countries, and more than 20 industry interviews.
- Primary Research: Primary research includes discussions with manufacturers, service providers, technology developers, distributors, end users, procurement teams, and subject-matter experts. These conversations examine purchasing priorities, product adoption, operational challenges, approval requirements, competitive positioning, and the factors that influence wider market acceptance.
- Desk Research: Desk research covers government statistics, regulatory publications, company filings, trade data, technical studies, industry associations, standards, public policy, and other authoritative sources. Every source used in the analysis is documented in the bibliography.
- Market Sizing and Forecasting: Market estimates combine historical performance, demand indicators, pricing and volume trends, segment shares, company participation, country-level growth, adoption patterns, investment activity, and barriers to market expansion.
- Data Validation and Update Cycle: Findings are validated by comparing primary interviews with public data, company activity, regulatory changes, trade patterns, and industry developments. Regular updates review new product launches, capacity changes, partnerships, approvals, procurement trends, and shifts in commercial adoption.
Segmentation
What is the report’s scope and coverage?
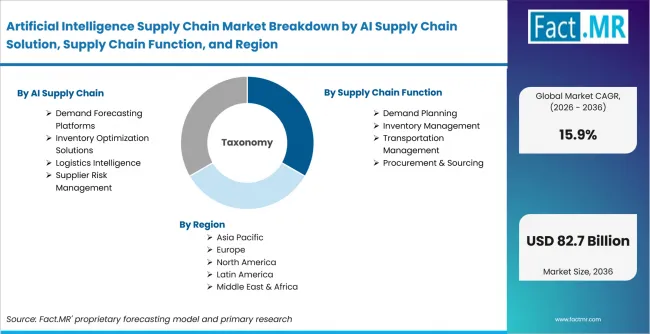
Artificial Intelligence Supply Chain Market Breakdown By Ai Supply Chain Solution, Supply Chain Function, And Region | Source: Fact.MR
| Attribute | Details |
|---|---|
| Quantitative Units | USD Billion |
| Market Definition | AI software, cloud services, analytics platforms, optimization systems and related services bought to improve demand, inventory, logistics, supplier-risk, procurement and connected supply-chain decisions |
| AI Supply Chain Solution | Demand Forecasting Platforms; Inventory Optimization Solutions; Logistics Intelligence; Supplier Risk Management |
| Supply Chain Function | Demand Planning; Inventory Management; Warehouse Management; Transportation Management; Procurement and Sourcing |
| Application Area | Manufacturing; Retail and Consumer Goods; Healthcare and Pharmaceuticals; Automotive |
| End User | Large Enterprises; Retail Chains; Logistics Service Providers; Procurement Organizations |
| Artificial Intelligence Technology | Machine Learning; Deep Learning; Computer Vision; Natural Language Processing; Generative AI; Knowledge Graphs |
| Regions Covered | North America; Europe; Asia Pacific; Central and South America; Middle East and Africa |
| Countries Covered | USA; China; Germany; Japan; India; UK; Singapore |
| Key Companies Profiled | SAP SE; Oracle Corporation; Microsoft Corporation; International Business Machines Corporation; Blue Yonder Group, Inc.; Kinaxis Inc.; Manhattan Associates, Inc.; Infor Inc.; Coupa Software Inc.; NVIDIA Corporation; Amazon Web Services, Inc. |
| Forecast Period | 2026 to 2036 |
| Approach | Hybrid top-down and bottom-up approach using supply-chain software demand; planning and logistics use cases; supplier-risk workflows; country adoption patterns; company portfolio review and analyst validation |
Source: Fact.MR analysis. Updated Aug 6, 2026
How is the market segmented?
-
By AI Supply Chain Solution:
- Demand Forecasting Platforms
- Predictive Demand Analytics
- Inventory Forecasting
- Inventory Optimization Solutions
- Automated Inventory Replenishment
- Stock Level Optimization
- Logistics Intelligence
- Route Optimization
- Last-mile Delivery Optimization
- Supplier Risk Management
- Supplier Performance Analytics
- Risk Monitoring
- Demand Forecasting Platforms
-
By Supply Chain Function:
- Demand Planning
- Sales Forecasting
- Seasonal Demand Planning
- Inventory Management
- Warehouse Optimization
- Safety Stock Planning
- Transportation Management
- Fleet Scheduling
- Carrier Selection
- Procurement & Sourcing
- Strategic Sourcing
- Contract Management
- Demand Planning
-
By Application Area:
- Manufacturing
- Discrete Manufacturing
- Process Manufacturing
- Retail & Consumer Goods
- E-commerce Fulfillment
- Fast-moving Consumer Goods
- Healthcare & Pharmaceuticals
- Pharmaceutical Distribution
- Medical Supply Chains
- Automotive
- Automotive Components
- Electric Vehicle Manufacturing
- Manufacturing
-
By End User:
- Large Enterprises
- Global Manufacturers
- Industrial Conglomerates
- Retail Chains
- E-commerce Companies
- Distribution Companies
- Logistics Service Providers
- Third-party Logistics Providers
- Freight Operators
- Procurement Organizations
- Supply Chain Consulting Firms
- Public Sector Organizations
- Large Enterprises
-
By Artificial Intelligence Technology:
- Machine Learning
- Predictive Analytics
- Time Series Modeling
- Deep Learning
- Intelligent Automation
- Reinforcement Learning
- Computer Vision
- Vision Analytics
- Real-time Decision Intelligence
- Natural Language Processing
- Generative Artificial Intelligence
- Knowledge Graphs
- Machine Learning
-
By Region:
- North America
- Latin America
- Western Europe
- Eastern Europe
- East Asia
- South Asia and Pacific
- Middle East & Africa
Frequently Asked Questions
How big is the artificial intelligence supply chain market in 2026?
What is the CAGR of the artificial intelligence supply chain market from 2026 to 2036?
Which AI supply chain solution leads the artificial intelligence supply chain market?
Which end-user segment leads the artificial intelligence supply chain market?
Who are the leading companies in the artificial intelligence supply chain market?
Who worked on this report


Preview the report firsthand - request a free sample
Free SampleGet the brochure for pricing and purchase details
Download PDF