- Market Value (2025): USD 246.2 Mn
- Estimated Value (2026): USD 262.1 Mn
- Forecast Value (2036): USD 489.2 Mn
- CAGR (2026-2036): 6.4%
What is the Bioactive Vitamin K2 Formulations Market forecast to be worth by 2036?
USD 262.1 million in 2026 to USD 489.2 million by 2036 at a 6.4% CAGR.
- The bioactive vitamin K2 formulations market reached a value of USD 246.2 million in 2025, with most revenue coming from menaquinone ingredients sold into general nutrition and bone support supplements.
- Revenue will expand from USD 262.1 million in 2026 to USD 489.2 million by 2036 as brands place vitamin K2 into vitamin D3 pairings, multivitamins and fortified foods for aging consumers.
- A 6.4% CAGR reflects steady supplement demand in mature markets and quicker uptake in India and China, where nutrition spending among older adults keeps widening.
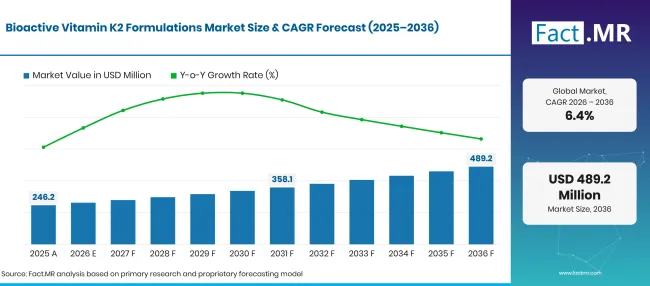
Bioactive Vitamin K2 Formulations Forecast Global | Source: Fact.MR
| Year | Basis | Market Value (USD million) |
|---|---|---|
| 2025 | Actual | 246.2 |
| 2026 | Estimate | 262.1 |
| 2036 | Forecast | 489.2 |
| CAGR 2026 to 2036 | Forecast period | 6.4% |
Source: Fact.MR analysis. Updated Nov 9, 2026
What are the defining numbers behind Bioactive Vitamin K2 Formulations Market growth?
The 2026 to 2036 period will add USD 227.1 million in new value, with MK-9 ingredients, capsule and tablet formats and general nutrition products carrying the core of that gain.
- Demand Drivers in the Market
- Scientific interest in menaquinones gives formulators a clear basis for product design. The NIH Office of Dietary Supplements identifies MK-4, MK-7 and MK-9 as the most well-studied menaquinones and sets adequate intakes of 120 mcg a day for men and 90 mcg for women [1]. Those reference points help brands set dose levels on labels.
- Population aging keeps bone and joint nutrition in focus. WHO states that by 2030 one in six people in the world will be aged 60 years or over [2]. Older shoppers form the core audience for vitamin K2 and vitamin D3 combinations.
- Europe offers a deep base of older consumers. Eurostat reports that people aged 65 and over accounted for 22.0% of the EU population on 1 January 2025, up from 21.6% a year earlier [3].
- Delivery technology is widening where vitamin K2 can go. Microencapsulated grades protect the molecule from minerals, heat and oxygen, which lets food and drink makers add it to powders and fortified products that once ruled it out.
- Key Segments Analyzed
- By Vitamin K2 Active Type: MK-9 will hold 33.0% share in 2026, as long-chain menaquinones gain ground in specialty ingredient blends and fermented food based formulations.
- By Product Delivery Form: Capsule / Tablet will account for 28.5% of 2026 value, since fixed daily doses and easy pairing with vitamin D3 suit the habits of regular supplement users.
- By Health Application: General Nutrition will capture 30.1% in 2026, given that most K2 reaches consumers through multivitamins and everyday wellness formulas.
- By Customer Channel: Ingredient Manufacturers will represent 26.3% of 2026 revenue, because fermentation, purification and stabilization steps concentrate value at the start of the supply chain.
- Analyst Opinion at Fact.MR
- Shambhu Nath Jha, Principal Consultant at Fact.MR, states, “Vitamin K2 will grow as a companion nutrient, sold next to vitamin D3 and calcium in products aimed at aging consumers. Suppliers that can prove the active form and purity of each batch will win longer contracts with supplement brands, since buyers now read the menaquinone type on the label. The next wave of value will come from stabilized grades that survive mineral blends and food processing, which opens fortified foods and drinks to an ingredient once limited to softgels.”
- Strategic Implications
- Ingredient manufacturers should publish clear data on menaquinone form, all-trans content and shelf stability, because brand buyers compare suppliers on those three points.
- Supplement brands should build vitamin K2 into vitamin D3 and calcium combinations for adults over 50, with dose levels tied to national intake guidance.
- Functional food and drink makers should test microencapsulated grades in powders and fortified products before scaling launches across markets with different claim rules.
- Investors should favor suppliers with clinical study programs and regulatory files in several regions, as these assets shorten customer approval cycles.
India heads the profiled group at 9.6%, 1.3 points ahead of China at 8.3%, as a younger but fast aging population begins to buy supplements through pharmacies and online stores. China keeps a 1.9-point lead over the United States, helped by an over-60 population that now counts in the hundreds of millions. The United States and the United Kingdom share a 6.4% pace, reflecting mature supplement habits in both countries, with growth coming from product upgrades instead of first-time buyers. Germany closes the range at 5.5%, 0.9 points behind, since its shoppers already use vitamin products widely and labelling rules keep claims cautious.
How does the Bioactive Vitamin K2 Formulations Market break down by segment?
MK-9 will lead Vitamin K2 Active Type at 33.0%; Capsule / Tablet will head Product Delivery Form at 28.5%; General Nutrition will top Health Application at 30.1%; Ingredient Manufacturers will hold Customer Channel at 26.3% in 2026.
Which Vitamin K2 Active Type leads?
MK-9 represents 33.0% of 2026 market revenue.
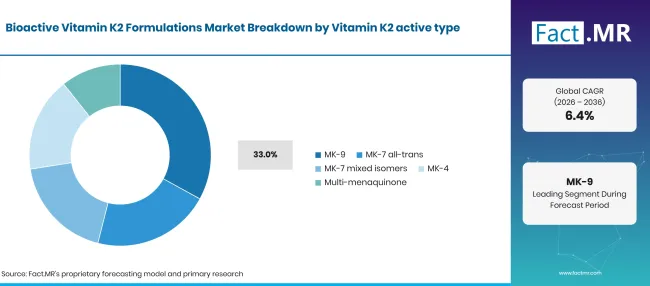
Bioactive Vitamin K2 Formulations Breakdown Vitamin K2 Active Type | Source: Fact.MR
| Vitamin K2 Active Type | Share (2026) |
|---|---|
| MK-9 (Leading segment) | 33.0% |
| Other segments combined | 67.0%* |
| Total | 100.0% |
Source: Fact.MR analysis. Updated Nov 9, 2026
Long-chain menaquinones attract formulators who want an active form with a distinct profile from the more familiar MK-7. MK-9 occurs naturally in some fermented foods and cheeses, which supports its use in food-linked and specialty blends. MK-7 all-trans grades remain the reference form for many supplements, and NIH notes that MK-7 has a longer half-life than vitamin K1 in one absorption study [1]. MK-7 mixed isomer grades serve price-sensitive buyers, while MK-4 appears in specific clinical and Asian formulas. Multi-menaquinone blends combine several forms in a single dose.
What supports Capsule / Tablet within Product Delivery Form?
Capsule / Tablet takes 28.5% of 2026 sales.
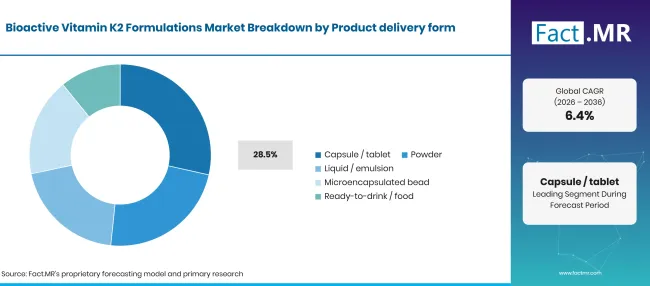
Bioactive Vitamin K2 Formulations Breakdown Product Delivery Form | Source: Fact.MR
| Product Delivery Form | Share (2026) |
|---|---|
| Capsule / Tablet (Leading segment) | 28.5% |
| Other segments combined | 71.5%* |
| Total | 100.0% |
Source: Fact.MR analysis. Updated Nov 9, 2026
Regular supplement users prefer a fixed dose they can take with breakfast, and capsules and tablets deliver microgram-level K2 with little waste. These formats also suit combination products with vitamin D3 and calcium, a pairing that fits the wider OTC vitamins and dietary supplements aisle. Oil-based K2 often goes into the softgel capsules that brands already use for vitamin D. Powders serve stick packs and drink mixes, a format tracked in the powder dietary supplements category. Liquid and emulsion drops reach children and adults who avoid pills, in line with demand for liquid dietary supplements. Microencapsulated beads protect K2 in mineral premixes, and ready-to-drink and food products open the ingredient to fortified dairy and beverages.
What leads the Health Application segment?
General Nutrition accounts for 30.1% of 2026 demand.
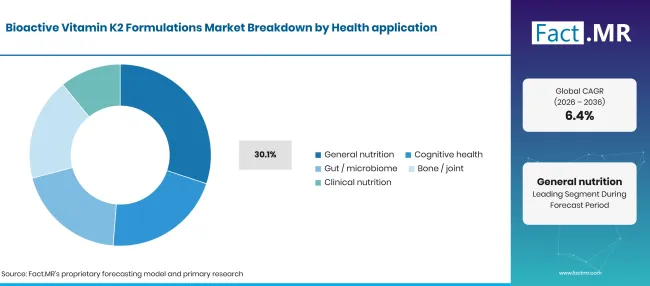
Bioactive Vitamin K2 Formulations Breakdown Health Application | Source: Fact.MR
| Health Application | Share (2026) |
|---|---|
| General Nutrition (Leading segment) | 30.1% |
| Other segments combined | 69.9%* |
| Total | 100.0% |
Source: Fact.MR analysis. Updated Nov 9, 2026
Most consumers meet vitamin K2 inside a multivitamin or a daily wellness formula, not as a single targeted product. Brands add it to general nutrition ranges because it pairs well with vitamin D3 and supports a broad health message. Bone and joint products form the next core use. Balchem notes that MK-7 helps activate proteins that support calcium use in the bone matrix, while vitamin D3 supports calcium absorption [4]. Cognitive health and gut and microbiome products are newer uses, often blended with probiotics, while clinical nutrition serves patients under medical supervision.
How does Customer Channel shape demand?
Ingredient Manufacturers capture 26.3% of 2026 value.
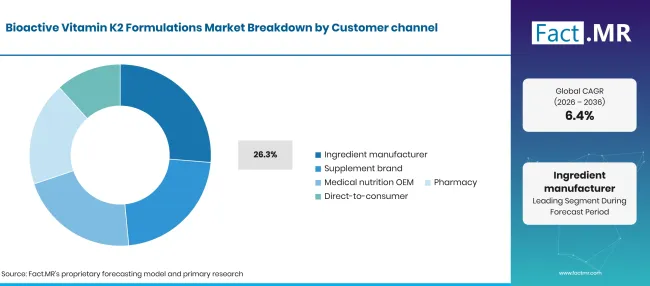
Bioactive Vitamin K2 Formulations Breakdown Customer Channel | Source: Fact.MR
| Customer Channel | Share (2026) |
|---|---|
| Ingredient Manufacturers (Leading segment) | 26.3% |
| Other segments combined | 73.7%* |
| Total | 100.0% |
Source: Fact.MR analysis. Updated Nov 9, 2026
Fermentation, purification and stabilization are the hardest steps in making bioactive K2, so value collects with the firms that run them. These producers sell bulk oils, powders and encapsulated grades to brands, premix houses and contract manufacturers. Supplement brands turn these ingredients into finished capsules, tablets and drops for the wider dietary supplement shelf. Medical nutrition OEMs formulate products for clinical and elderly care settings. Pharmacies give shoppers advice on dosing and drug interactions, and direct-to-consumer sellers use subscriptions to keep repeat buyers.
What is accelerating Bioactive Vitamin K2 Formulations Market adoption, and what is holding it back?
Aging populations, interest in bone health and the steady pairing of K2 with vitamin D3 keep demand rising across supplement ranges. Stabilized grades are bringing the ingredient into foods and drinks. Growth is slowed by low consumer awareness of the different menaquinone forms. Health claim rules also vary, and the U.S. Food and Drug Administration has not approved a bone health claim that European authorities accept [1].
Drivers Impact Analysis
| DRIVER | (~) % IMPACT ON CAGR | GEOGRAPHIC RELEVANCE | IMPACT TIMELINE |
|---|---|---|---|
| Consumer interest in preventive nutrition and daily wellness supplements | +2.0% | Global | Medium term (2-4 years) |
| Interest in vitamin K2 for bone metabolism among aging adults | +1.2% | North America, Western Europe, East Asia | Medium term (2-4 years) |
| Expansion of functional foods and fortified nutrition products | +0.8% | Global | Long term (>=4 years) |
| Adoption of specific menaquinone forms in supplement portfolios | +0.6% | North America, Western Europe, East Asia | Medium term (2-4 years) |
| Development of convenient delivery formats | +0.4% | Global | Short term (<=2 years) |
Source: Fact.MR analysis. Updated Nov 9, 2026
Opportunity Impact Analysis
| OPPORTUNITY | (~) % IMPACT ON CAGR | GEOGRAPHIC RELEVANCE | IMPACT TIMELINE |
|---|---|---|---|
| MK-7 and MK-9 formulations for specialty nutrition | +0.6% | Global | Medium term (2-4 years) |
| Vitamin K2 in functional foods and ready-to-drink products | +0.5% | North America, Western Europe, East Asia | Long term (>=4 years) |
| Rising supplement use across emerging economies | +0.4% | South Asia & Pacific, East Asia, Latin America | Long term (>=4 years) |
| Microencapsulated grades for mineral and food formulations | +0.3% | Global | Medium term (2-4 years) |
Source: Fact.MR analysis. Updated Nov 9, 2026
Restraints Impact Analysis
| RESTRAINT | (~) % IMPACT ON CAGR | GEOGRAPHIC RELEVANCE | IMPACT TIMELINE |
|---|---|---|---|
| Higher cost of pure, stabilized vitamin K2 ingredients | -0.2% | Global | Short term (<=2 years) |
| Low consumer awareness of different menaquinone forms | -0.2% | Latin America, South Asia & Pacific, Middle East & Africa | Medium term (2-4 years) |
| Differences in health claim and novel food rules across countries | -0.1% | Global | Medium term (2-4 years) |
| Mixed clinical evidence for some application-specific benefits | -0.1% | Global | Long term (>=4 years) |
Source: Fact.MR analysis. Updated Nov 9, 2026
Which countries are scaling the Bioactive Vitamin K2 Formulations Market through 2036?
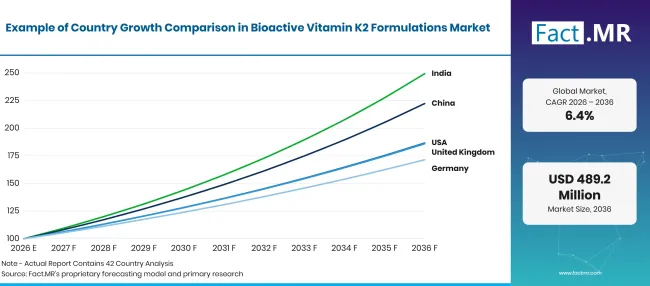
Bioactive Vitamin K2 Formulations Growth Index | Source: Fact.MR
| Country | CAGR (2026 to 2036) |
|---|---|
| India | 9.6% |
| China | 8.3% |
| United States | 6.4% |
| United Kingdom | 6.4% |
| Germany | 5.5% |
Source: Fact.MR analysis. Updated Nov 9, 2026
What supports adoption in India?
9.6% CAGR, driven by a fast growing older population and wider pharmacy reach.
India’s senior population is growing quickly. A Press Information Bureau backgrounder states that the number of people aged 60 and over will more than double from 100 million in 2011 to about 230 million by 2036 [5]. Domestic producers already make menaquinone-7 by fermentation, which keeps local supply prices within reach. Pharmacy chains and online stores give K2 and D3 combinations national reach.
How is China developing demand?
8.3% CAGR, backed by a large and aging consumer base.
China’s statistics bureau reports 323.38 million people aged 60 and above at the end of 2025, or 23.0% of the population [6]. That base gives brands a large pool of shoppers interested in bone and joint nutrition. Cross-border e-commerce and domestic health food brands are adding K2 to calcium and vitamin D3 products for this group.
What is supporting United States adoption?
6.4% CAGR, reflecting mature supplement habits and an aging population.
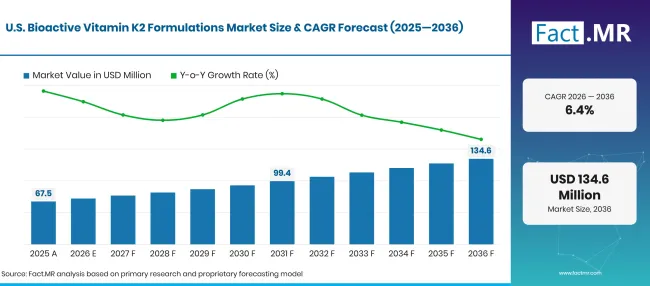
Bioactive Vitamin K2 Formulations Forecast Usa | Source: Fact.MR
The U.S. Census Bureau reports that the population aged 65 and older rose 3.1% to 61.2 million between 2023 and 2024 [7]. NIH data show average vitamin K intake among women rises from 122 mcg a day from food to 164 mcg when supplements are counted [1]. Growth will come from upgraded D3 and K2 combinations and clearer labelling of the active form.
How is the United Kingdom developing demand?
6.4% CAGR, helped by an established novel food route.
The Office for National Statistics reports that the number of people aged 65 and over grew in every UK country in the year to mid-2024, including a 1.8% rise in England [8]. The Food Standards Agency lists vitamin K2 (menaquinone) as an authorised novel food in Great Britain, to be labelled as “Menaquinone” or “Vitamin K2” [9].
How does Germany perform?
5.5% CAGR, as a mature and cautious market.
Destatis reports that the number of people aged 60 and over rose by 387,000 in 2025 and reached 31% of the population [10]. Eurostat puts Germany’s median age at 45.5 years in 2025 [3]. Drugstore chains and pharmacies sell K2 widely, but strict claim rules keep marketing close to approved wording on bones and blood clotting.
Who leads the Bioactive Vitamin K2 Formulations Market?
The market splits into three groups. Specialist menaquinone producers such as Balchem, Gnosis by Lesaffre and Synergia Life Sciences compete on fermentation know-how, all-trans purity and clinical evidence.
Balchem is building the deepest science base for its K2VITAL ingredient, stating in 2026 that it has run 13 double-blind, placebo-controlled trials [11]. In October 2026 it hosted a webinar on new clinical evidence for vitamin K2 in cardiovascular nutrition [12]. Broad nutrition suppliers DSM-Firmenich and Glanbia Nutritionals place vitamin K inside wider vitamin portfolios and custom premixes, so they win business from brands that want several nutrients from one source. Finished brands such as NOW Foods sell MK-7 capsules directly to shoppers and judge suppliers on traceable sourcing. Clinical proof, stable delivery grades and regulatory files in several regions will decide which suppliers gain ground through 2036.
Which companies are the key providers?
Key companies in the Bioactive Vitamin K2 Formulations Market include Balchem, Gnosis by Lesaffre, Synergia Life Sciences, DSM-Firmenich, Glanbia Nutritionals and NOW Foods.
- Balchem
- Gnosis by Lesaffre
- Synergia Life Sciences
- DSM-Firmenich
- Glanbia Nutritionals
- NOW Foods
Bibliography
- [1] National Institutes of Health, Office of Dietary Supplements. (2026, October 22). Vitamin K: Fact Sheet for Health Professionals.
- [2] World Health Organization. (2025, October 1). Ageing and health.
- [3] Eurostat. (2026, February 2). Population structure and ageing.
- [4] Balchem. (2026, October 26). Stronger Bones with Vitamin K2: How Calcium, Vitamin D3, and MK-7 Work Together for Bone Health.
- [5] Press Information Bureau, Government of India. (2025, October 28). Elderly in India: Population, Challenges, and Government Initiatives.
- [6] National Bureau of Statistics of China. (2026, February 28). Statistical Communiqué of the People’s Republic of China on the 2025 National Economic and Social Development.
- [7] U.S. Census Bureau. (2025, June 26). Older Adults Outnumber Children in 11 States and Nearly Half of U.S. Counties.
- [8] Office for National Statistics. (2025, September 26). Population estimates for the UK, England, Wales, Scotland and Northern Ireland: mid-2024.
- [9] Food Standards Agency. (2025, April 1). Vitamin K2 (menaquinone): Authorised novel food NOVEL-146.
- [10] Statistisches Bundesamt (Destatis). (2026, June 16). Bevölkerung Deutschlands sinkt im Jahr 2025 um 0,1 %.
- [11] Balchem. (2026, October 1). K2VITAL Science Done Right.
- [12] Balchem. (2026, October 13). Science Done Right: New Clinical Evidence Advancing Cardiovascular Nutrition, K2VITAL.
This Report Answers
- How is vitamin K2 revenue split between MK-9, MK-7, MK-4 and multi-menaquinone ingredients?
- Why do capsules and tablets carry more K2 value than powders, drops or fortified foods?
- What role does general nutrition play compared with bone, cognitive, gut and clinical uses?
- How much value stays with ingredient manufacturers before K2 reaches brands, pharmacies and online sellers?
- Where will growth be quickest among India, China, the United States, the United Kingdom and Germany?
- Which suppliers compete on clinical evidence, and which compete on broad vitamin portfolios?
What does the Bioactive Vitamin K2 Formulations Market cover?
This report tracks vitamin K2 in its bioactive menaquinone forms, from bulk ingredients to finished products. It follows each active type through the delivery formats and health uses that carry it to consumers and patients.
Value is measured at the first point of sale for each layer, so ingredient revenue and finished formulation revenue are both counted. For multi-nutrient products, only the vitamin K2 share of value is counted.
What is included in the scope?
Menaquinone ingredients in MK-4, MK-7 all-trans, MK-7 mixed isomer, MK-9 and multi-menaquinone forms, sold as oils, powders or encapsulated grades.
Finished capsules, tablets, softgels, powders, drops and emulsions in which vitamin K2 is a named active, including vitamin D3 and calcium combinations.
Ready-to-drink products and fortified foods that carry vitamin K2 on the label, along with medical nutrition products for clinical settings.
Sales through ingredient manufacturers, supplement brands, medical nutrition OEMs, pharmacies and direct-to-consumer channels in all covered regions.
What is excluded from the scope?
Vitamin K1 (phylloquinone) products and vitamin K injections used in hospitals.
Prescription anticoagulants and other medicines that interact with vitamin K.
Multivitamins in which vitamin K2 is not a declared active ingredient.
Natto, cheese and other foods that contain menaquinones naturally without added vitamin K2.
How Was the Analysis Built?
The analysis draws on 120+ sources, 35+ company portfolios, 25+ countries, and more than 20 industry interviews.
- Primary Research: Primary research includes discussions with manufacturers, service providers, technology developers, distributors, end users, and subject-matter experts. These conversations examine purchasing priorities, product adoption, operational challenges, approval requirements, competitive positioning, and the factors that influence wider market acceptance.
- Desk Research: Desk research covers government statistics, regulatory publications, company filings, trade data, technical studies, industry associations, standards, public policy, and other authoritative sources. Every source used in the analysis is documented in the bibliography.
- Market Sizing and Forecasting: Market estimates combine historical performance, demand indicators, pricing and volume trends, segment shares, company participation, country-level growth, adoption patterns, investment activity, and barriers to market expansion.
- Data Validation and Update Cycle: Findings are validated by comparing primary interviews with public data, company activity, regulatory changes, trade patterns, and industry developments. Regular updates review new product launches, capacity changes, partnerships, approvals, and shifts in commercial adoption.
Segmentation
What is the report’s scope and coverage?
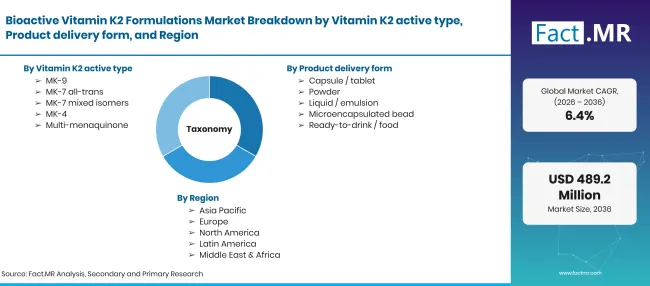
Bioactive Vitamin K2 Formulations Taxonomy | Source: Fact.MR
| Attribute | Details |
|---|---|
| Quantitative Units | USD million in 2026 to USD million by 2036 at CAGR |
| Market Definition | Bioactive vitamin K2 (menaquinone) ingredients and finished formulations sold for dietary supplements, functional foods and medical nutrition, covering MK-4, MK-7, MK-9 and multi-menaquinone forms. |
| Vitamin K2 Active Type | MK-9; MK-7 all-trans; MK-7 mixed isomers; MK-4; Multi-menaquinone |
| Product Delivery Form | Capsule / Tablet; Powder; Liquid / Emulsion; Microencapsulated Bead; Ready-to-drink / Food |
| Health Application | General Nutrition; Cognitive Health; Gut / Microbiome; Bone / Joint; Clinical Nutrition |
| Customer Channel | Ingredient Manufacturers; Supplement Brands; Medical Nutrition OEM; Pharmacy; Direct-to-Consumer |
| Regions Covered | North America; Latin America; Western Europe; Eastern Europe; East Asia; South Asia & Pacific; Middle East & Africa |
| Countries Covered | India; China; United States; United Kingdom; Germany |
| Companies Profiled | Balchem; Gnosis by Lesaffre; Synergia Life Sciences; DSM-Firmenich; Glanbia Nutritionals; NOW Foods |
| Forecast Period | 2026 to 2036 |
| Approach | Revenue built from menaquinone ingredient volumes and prices by active form, checked against finished supplement launches, delivery formats and channel mix in each country. |
Source: Fact.MR analysis. Updated Nov 9, 2026
How is the market segmented?
-
By Vitamin K2 Active Type
- MK-9
- MK-7 all-trans
- MK-7 mixed isomers
- MK-4
- Multi-menaquinone
-
By Product Delivery Form
- Capsule / Tablet
- Powder
- Liquid / Emulsion
- Microencapsulated Bead
- Ready-to-drink / Food
-
By Health Application
- General Nutrition
- Cognitive Health
- Gut / Microbiome
- Bone / Joint
- Clinical Nutrition
-
By Customer Channel
- Ingredient Manufacturers
- Supplement Brands
- Medical Nutrition OEM
- Pharmacy
- Direct-to-Consumer
-
By Region
- North America
- Latin America
- Western Europe
- Eastern Europe
- East Asia
- South Asia & Pacific
- Middle East & Africa
Frequently Asked Questions
How large is the bioactive vitamin K2 formulations market in 2026?
What growth rate will the bioactive vitamin K2 formulations market record?
Which vitamin K2 active type leads?
Which product delivery form leads?
Which health application leads?
Which customer channel leads?
Which country will grow quickest?
Who are the main companies?
What holds the market back?
Who worked on this report


Preview the report firsthand - request a free sample
Free SampleGet the brochure for pricing and purchase details
Download PDF