- Market Value (2025): USD 998.3 Mn
- Estimated Value (2026): USD 1057.2 Mn
- Forecast Value (2036): USD 1897.7 Mn
- CAGR (2026-2036): 5.9%
What is the Chili Oil Market forecast to be worth by 2036?
USD 1,057.2 million in 2026 to USD 1,897.7 million by 2036, at a 5.9% CAGR.
- The market reached USD 998.3 million in 2025.
- Demand is projected to increase from USD 1,057.2 million in 2026 to USD 1,897.7 million by 2036.
- The market is forecast to record a 5.9% CAGR from 2026 to 2036, creating an absolute opportunity of USD 840.5 million.
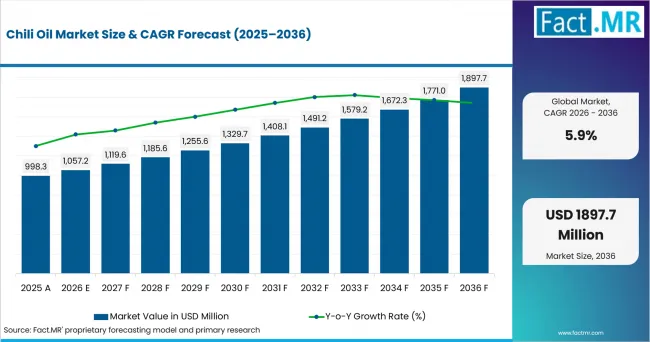
Chili Oil Market Value Analysis | Source: Fact.MR
What are the defining numbers behind Chili Oil Market growth?
USD 840.5 million absolute opportunity is expected between 2026 and 2036.
- Demand Drivers in the Market
- Chili oil benefits from the spread of Asian cooking habits into everyday home meals, where one jar can season noodles, eggs as well as rice bowls as well as dumplings as well as roasted vegetables and takeout-style dishes.
- The product works across both cooking and finishing use. That dual role gives processed-with-oil formats a stronger repeat-purchase base than single-use sauces.
- Supermarkets, specialty grocers, online stores and restaurant supply channels are all widening access as well as especially for garlic chili oil as well as chili crisp as well as Sichuan-style oil and other texture-led formats.
- Vegetable oil and chili pepper sourcing remain important because a low-ticket condiment can lose margin quickly when oil prices, freight, glass packaging or chili supply move against suppliers.
- Key Segments Analyzed
- By Type: Processed with Oil is the leading type, accounting for 64.6% share in 2026.
- By Application: Home leads with 30.8% share in 2026.
- Analyst Opinion at Fact.MR
- Buyer preference in chili oil is decided less by heat alone and more by use case. A home user may want a spoonable chili crisp that makes simple meals taste complete. A restaurant buyer may look for stable flavor, consistent color, controllable heat and pack sizes that suit back-of-house use. Suppliers gain share when they define the oil base, chili profile, texture and recommended use clearly. This is because the category now competes as both a condiment and a cooking ingredient. Shambhu Nath Jha, Principal Consultant, Fact.MR.
- Strategic Implications
- Suppliers should position products by use occasion, such as cooking oil, finishing oil as well as chili crisp as well as dipping condiment or restaurant bulk format.
- Retail packs need clear heat cues and ingredient visibility, especially where consumers are trying chili oil for the first time.
- Foodservice formats should emphasize consistency, cost per serving, allergen controls and suitability for noodles as well as rice bowls as well as snacks and grilled dishes.
Australia records the highest country CAGR at 8.8%, while the UK and USA follow at 8.1%. Canada advances at 7.3%, and Germany expands at 6.5% through 2036.
How does the Chili Oil Market break down by segment?
Processed with Oil leads Type with 64.6% share and Home leads Application with 30.8% share in 2026.
Why does Processed with Oil lead Type?
Processed with Oil is projected to account for 64.6% share in 2026.
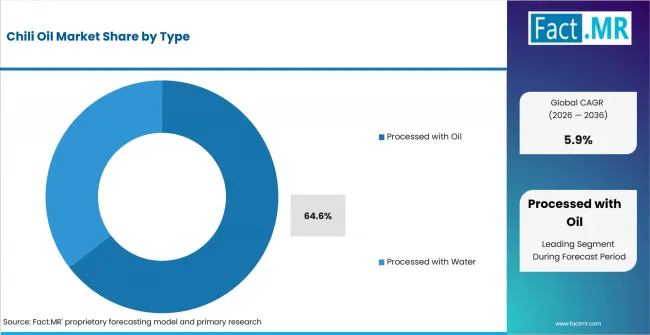
Chili Oil Market Analysis By Type | Source: Fact.MR
Processed with Oil leads because chili oil is built around fat-based flavor transfer. Heat, color, aroma as well as roasted chili notes as well as garlic as well as sesame as well as onion and spice particles are carried more effectively in oil than in water-led formats. The format also fits the way consumers use the product: a spoonful can finish dumplings or noodles, flavor fried eggs, season rice or act as a base for quick stir-fry dishes. Processed with Water remains relevant where buyers want a lighter sauce profile, but it does not offer the same visual oil layer, mouthfeel or pantry-condiment identity that has made chili oil and chili crisp more visible in retail.
Why does Home lead Application?
Home is projected to account for 30.8% share in 2026.
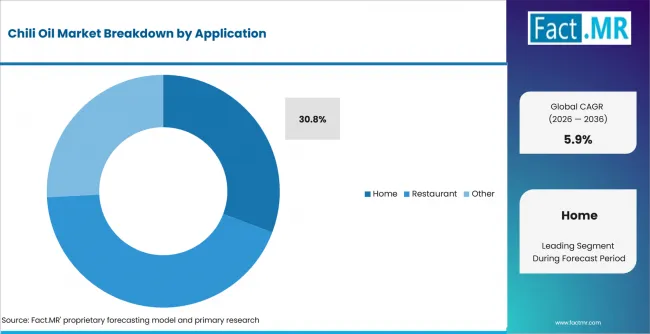
Chili Oil Market Analysis By Application | Source: Fact.MR
Home leads because chili oil solves a practical cooking problem: it adds heat, aroma, texture and a restaurant-style finish without requiring a long ingredient list. The product fits the rise of quick scratch cooking, meal bowls, instant noodles as well as air-fryer meals as well as frozen dumplings and homemade Asian-inspired dishes. Restaurants remain important for discovery, but household use creates more frequent consumption because the same jar can move across breakfast, snacks as well as leftovers and dinner preparation.
What is accelerating Chili Oil Market adoption, and what is holding it back?
Adoption is being pulled by global flavor migration, home cooking convenience, restaurant menu use and supermarket visibility. The main restraints sit on the supply side: vegetable oil price pressure, chili pepper variability, packaging cost and different rules for sauces as well as condiments and mixed seasonings across markets.
Drivers Impact Analysis
| DRIVER | (~) % IMPACT ON CAGR | GEOGRAPHIC RELEVANCE | IMPACT TIMELINE |
|---|---|---|---|
| Global flavor migration | +1.5% | Australia, USA and UK | Short term (<= 2 years) |
| Home meal upgrading | +1.2% | USA, UK and Canada | Short term (<= 2 years) |
| Foodservice discovery | +0.9% | Australia, USA and UK | Medium term (2-4 years) |
| Online visibility | +0.7% | Australia, USA and UK | Medium term (2-4 years) |
Source: Fact.MR analysis. Updated Aug 4, 2026
- Global flavor migration: Chili oil travels well across Chinese, Korean, Thai as well as Japanese as well as Indian as well as Mexican-inspired and fusion meals. It is not limited to one cuisine aisle.
- Home meal upgrading: Consumers use a small amount of chili oil to make everyday staples feel more flavorful, which supports repeat use even when household budgets are watched closely.
- Foodservice discovery: Restaurants introduce diners to chili oil through dumplings, noodles, fried chicken as well as pizza as well as burgers as well as eggs and snack plates as well as then retail demand follows at home.
- Online visibility: Short-form recipe content makes the category easier to explain because texture, pour, color and serving ideas are highly visual.
Opportunity Impact Analysis
| OPPORTUNITY | (~) % IMPACT ON CAGR | GEOGRAPHIC RELEVANCE | IMPACT TIMELINE |
|---|---|---|---|
| Heat and flavour differentiation | +1.0% | Australia, USA and UK | Medium term (2-4 years) |
| Trial and premium retail formats | +0.8% | Australia, USA and UK | Medium term (2-4 years) |
| Foodservice pack expansion | +0.6% | Australia, USA and UK | Long term (>= 4 years) |
Source: Fact.MR analysis. Updated Aug 4, 2026
- Suppliers can build clearer product ladders around mild, hot, extra hot as well as garlic as well as fermented as well as sesame as well as Sichuan pepper and crunchy chili formats.
- Retailers can use smaller trial packs and premium glass jars to convert shoppers who already buy Asian sauces but have not yet made chili oil a regular pantry item.
- Restaurant and catering packs can grow where operators want stable flavor but do not want to prepare chili oil in-house every day.
Restraints Impact Analysis
| RESTRAINT | (~) % IMPACT ON CAGR | GEOGRAPHIC RELEVANCE | IMPACT TIMELINE |
|---|---|---|---|
| Vegetable-oil price volatility | -1.1% | Global sourcing and import-dependent markets | Short term (<= 2 years) |
| Labelling and import complexity | -0.8% | Australia, USA and UK | Short term (<= 2 years) |
| Batch texture consistency | -0.6% | Established and price-sensitive markets | Medium term (2-4 years) |
Source: Fact.MR analysis. Updated Aug 4, 2026
- Vegetable oil price volatility can pressure margins because oil is not a minor ingredient in the leading format.
- Different rules for sauce, seasoning, allergen as well as additive and nutrition labelling can slow market entry for imported products.
- Texture-led formats can separate, settle, or vary by batch. Suppliers need reliable processing and filling controls.
Which countries are scaling the Chili Oil Market fastest?
Country growth rates differ from the global 5.9% CAGR. Australia leads the listed set at 8.8% CAGR because prepared sauces and imported condiment formats already have strong channel space.
The UK and USA both sit at 8.1% CAGR, but they scale differently: the UK is led by retail sauce experimentation and eating-out occasions, while the USA grows from a much larger condiment base. Canada advances at 7.3% CAGR through foodservice recovery and household condiment spending. Germany expands at 6.5% CAGR, supported by cooking-ingredient demand but moderated by a mature food market and sharper cost discipline.
- Australia leads the country set at 8.8% CAGR.
- The UK and USA each record 8.1% CAGR.
- Canada advances at 7.3% CAGR.
- Germany expands at 6.5% CAGR.
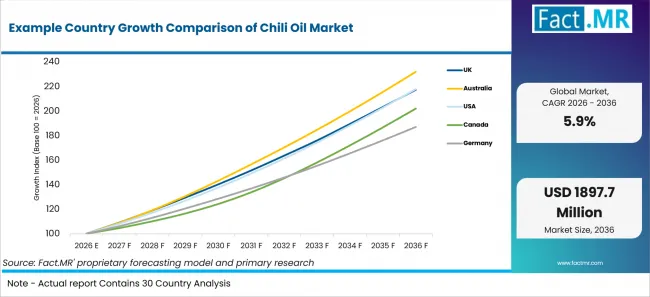
Example Country Growth Comparison Of Chili Oil Market | Source: Fact.MR
| COUNTRY | CAGR, 2026 to 2036 |
|---|---|
| Australia | 8.8% |
| UK | 8.1% |
| USA | 8.1% |
| Canada | 7.3% |
| Germany | 6.5% |
Source: Fact.MR analysis. Updated Aug 4, 2026
What is driving Australia's growth through 2036?
Australia is forecast to grow at 8.8% CAGR through 2036, the fastest pace in the listed country set. The country already imports a wide range of sauces and condiments, and prepared sauces are the largest product group within that trade. That matters for chili oil because the category often enters through Asian grocery, mainstream supermarket import shelves, and online specialty food channels before becoming a regular pantry item. Australia’s overseas-born population also supports broad exposure to Asian cooking habits. With 32.0% of residents born overseas in 2025, food retailers have a larger consumer base familiar with chili-led condiments and a larger group of shoppers willing to try imported or fusion formats.
What is driving the UK's growth through 2036?
The UK is forecast to grow at 8.1% CAGR through 2036. Growth is helped by strong retail demand for sauces, dips, and condiments as well as especially cooking and table sauces. UK food spending also remains split between home and out-of-home occasions, which suits chili oil because the same flavor cue travels from restaurants to home kitchens. In practical terms, the UK shopper may first meet chili oil on noodles, dumplings as well as eggs or pizza at a restaurant as well as then buy a jar as a low-cost way to recreate that flavor at home. This gives suppliers room to sell both everyday jars and more premium chili crisp formats.
What is driving the USA's growth through 2036?
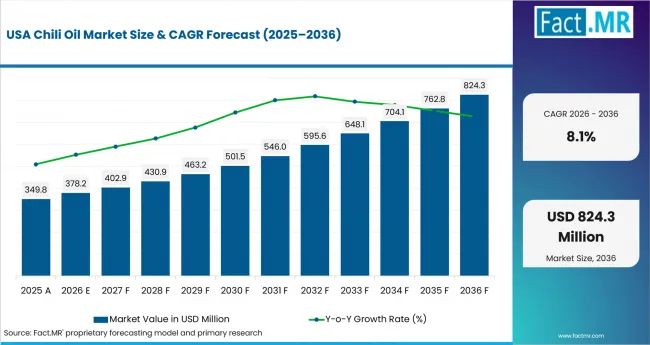
Chili Oil Market Country Value Analysis | Source: Fact.MR
The USA is projected to expand at 8.1% CAGR through 2036. The country is adopting chili oil through more than trend cycles; it has the scale to absorb the category through supermarkets, club stores, Asian grocers as well as e-commerceas well as food trucks as well as quick-service restaurants and casual dining. U.S. government food-expenditure data show why both channels matter: food sales are measured across at-home and away-from-home outlets, while foodservice, processing as well as wholesale and retail each take meaningful shares of the food dollar. Chili oil benefits from that structure because a product can move from restaurant use to retail purchase without needing a separate consumer education cycle.
What is driving Canada's growth through 2036?
Canada is forecast to grow at 7.3% CAGR through 2036. Demand is supported by foodservice activity and household condiment use, with growth strongest where chili oil sits between cooking sauce and table seasoning. Statistics Canada reported annual sales of food services and drinking places at CAD 101.4 billion in 2025, up 5.6% from 2024, giving restaurants and quick-service outlets more room to introduce chili-led toppings and sauces. Canada also has clear customs guidance for sauces, mixed condiments, and mixed seasonings. This includes chili oil with garlic as an example of a mixed condiment. That classification clarity helps importers and distributors treat chili oil as a mainstream condiment category rather than an undefined specialty item.
What is driving Germany's growth through 2036?
Germany is forecast to expand at 6.5% CAGR through 2036. The country’s pace is above the global rate but more measured than Australia, the UK, or the USA because Germany already has a mature packaged food and condiment market. Demand is supported by cooking ingredients, meals, organic packaged foodas well as Asian-style sauces and supermarket-led product discovery. At the same time, the category faces stricter cost control. FAO data show vegetable oil prices remained well above year-earlier levels in June 2026, and the OECD-FAO outlook expects vegetable oil prices to stay relatively stronger because of sustained demand and slower production growth. For chili oil suppliers, that means Germany can grow, but margins and price points will matter more than novelty alone.
Who leads the Chili Oil Market?
Lao Gan Ma is the largest named company in the assessed set, with 11.5% share. Other listed participants are Lee Kum Kee, CHUNG JUNG ONE, Huy Fong and Tabasco.
Competition is shaped by brand trust, recipe familiarity, texture as well as heat consistency as well as pack size and distribution reach. Lao Gan Ma benefits from strong association with chili crisp and oil-based condiment formats. Lee Kum Kee has wider Asian sauce recognition. Huy Fong and Tabasco bring hot-sauce familiarity, while CHUNG JUNG ONE connects the market with Korean pantry usage. Buyers are likely to compare flavor identity and use occasion before they compare technical specifications.
Which companies are the key providers?
Key companies include Lao Gan Ma; Lee Kum Kee; CHUNG JUNG ONE; Huy Fong; Tabasco.
- Lao Gan Ma
- Lee Kum Kee
- CHUNG JUNG ONE
- Huy Fong
- Tabasco
Bibliography
- Agriculture and Agri-Food Canada. (2025, September 17). Sector Trend Analysis: Sauces, dips and condiment trends in Australia. Government of Canada.
- Agriculture and Agri-Food Canada. (2025, October 15). Sector Trend Analysis: Sauces, dips and condiment trends in the United Kingdom. Government of Canada.
- Agriculture and Agri-Food Canada. (2023). Sector Trend Analysis: Sauces, dips and condiment trends in the United States. Government of Canada.
- Agriculture and Agri-Food Canada. (2026, April 29). Health and Wellness Series: Organic packaged food trends in Germany. Government of Canada.
- Australian Bureau of Statistics. (2026). Australia’s population by country of birth, June 2025. Australian Bureau of Statistics.
- Canada Border Services Agency. (2026, April 28). Memorandum D10-14-35: Tariff Classification of Sauces, Mixed Condiments and Mixed Seasonings. Government of Canada.
- Codex Alimentarius Commission. (2026). Standard for Named Vegetable Oils, CXS 210-1999. FAO and WHO.
- Department for Environment, Food and Rural Affairs. (2026). Food statistics in your pocket. Government of the United Kingdom.
- Food and Agriculture Organization of the United Nations. (2026). FAO price indices for oilseeds, vegetable oils and oilmeals. FAO Markets and Trade.
- OECD and Food and Agriculture Organization of the United Nations. (2025). OECD-FAO Agricultural Outlook 2025-2034: Oilseeds and oilseed products. OECD Publishing.
- Statistics Canada. (2025, May 21). Table 11-10-0125-01: Detailed food spending, Canada, regions and provinces. Government of Canada.
- Statistics Canada. (2026, February 25). Food services and drinking places, December 2025. Government of Canada.
- U.S. Department of Agriculture, Economic Research Service. (2026). Ag and Food Statistics: Charting the Essentials, Food Prices and Spending. USDA ERS.
- U.S. Department of Agriculture, Economic Research Service. (2024). Food Expenditure Series. USDA ERS.
This Report Answers
- The report provides strategic intelligence on the Chili Oil Market across Type and Application choices that shape product use and purchasing decisions.
- Segment analysis covers Processed with Oil and Home as the share leaders within the 2026 market.
- Country outlook evaluates the UK and Australia alongside the USA and Canada. Germany completes the growth comparison across the profiled markets.
- Competitive analysis profiles Lao Gan Ma and Lee Kum Kee alongside CHUNG JUNG ONE and Huy Fong. Tabasco completes the provider view.
- Application assessment covers Home and Restaurant use. Other settings complete the commercial view.
What does the Chili Oil Market cover?
The market covers chili oil products and related offerings across the defined Type, Application, and Region categories. It includes oil-based and water-processed chili condiment formats used in home kitchens, restaurants, and other foodservice or retail settings.
What is included in the scope?
The scope includes products sold as chili oil or closely related chili-oil preparations, including oil-led formats, water-processed formats as well as home-use jars as well as restaurant-use packs and products distributed through retail as well as foodservice as well as specialty grocery and online channels.
What is excluded from the scope?
Products outside the defined Type, Application, and Region categories are excluded. The scope does not treat plain dried chili, whole spices, generic cooking oils without chili infusion or unrelated hot sauces as chili oil unless they compete directly within the assessed chili oil use case.
How Was the Analysis Built?
The analysis combines structured desk research, company and product mapping, expert validation. Demand-side checks across major regions.
- Primary Research: Interviews with buyers, suppliers, distributors as well as foodservice users and category specialists test purchasing criteria as well as usage patterns as well as adoption barriers and replacement behavior.
- Desk Research: Public food statistics, trade classification material, ingredient standards as well as retail-channel information as well as company literature and official market context establish market boundaries and demand mechanisms.
- Market Sizing and Forecasting: Demand indicators, channel patterns, application intensity as well as product-format adoption and supplier participation are reconciled across top-down and bottom-up views.
- Data Validation and Update Cycle: Findings are cross-checked across independent evidence routes and reviewed when material market, regulatory, input-cost or company changes occur.
Segmentation
What is the report's scope and coverage?
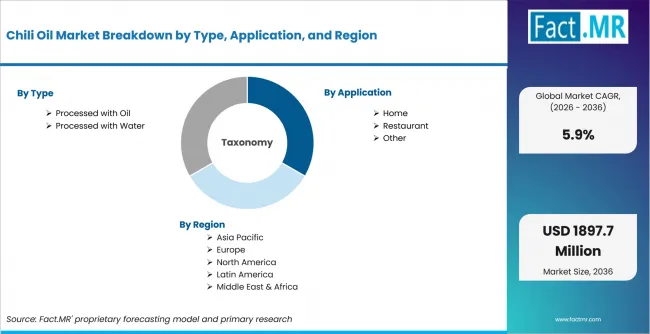
Chili Oil Market Breakdown By Type, Application, And Region | Source: Fact.MR
| Attribute | Details |
|---|---|
| Quantitative Units | USD 1,057.2 million in 2026 to USD 1,897.7 million by 2036, at a 5.9% CAGR |
| Market Definition | Chili oil products and related offerings across the assessed categories |
| Type | Processed with Oil; Processed with Water |
| Application | Home; Restaurant; Other |
| Regions Covered | North America; Latin America; Europe; East Asia; South Asia & Oceania; Middle East & Africa |
| Countries Covered | UK; Australia; USA; Canada; Germany |
| Key Companies Profiled | Lao Gan Ma; Lee Kum Kee; CHUNG JUNG ONE; Huy Fong; Tabasco |
| Forecast Period | 2026 to 2036 |
| Approach | Hybrid top-down and bottom-up market assessment |
Source: Fact.MR analysis. Updated Aug 4, 2026
How is the market segmented?
-
By Type
- Processed with Oil
- Processed with Water
-
By Application
- Home
- Restaurant
- Other
-
By Region
- North America
- Latin America
- East Asia
- South Asia & Oceania
- Australia
- Middle East & Africa
Frequently Asked Questions
How big is the Chili Oil Market in 2026?
What is the CAGR of the Chili Oil Market from 2026 to 2036?
Which type leads the Chili Oil Market?
How much will the Chili Oil Market add between 2026 and 2036?
Who are the leading companies in the Chili Oil Market?
Who worked on this report


Preview the report firsthand - request a free sample
Free SampleGet the brochure for pricing and purchase details
Download PDF