- Market Value (2025): USD 268.4 Mn
- Estimated Value (2026): USD 282.4 Mn
- Forecast Value (2036): USD 468.8 Mn
- CAGR (2026-2036): 5.2%
What is the Water Cut Monitors Market forecast to be worth by 2036?
USD 282.4 million in 2026 to USD 468.8 million by 2036, at a 5.2% CAGR.
Measurement demand should be read with Fact.MR's Flow Meter Market, because water cut monitoring often sits inside the same production-measurement budget.
- The water cut monitors market reached USD 268.4 million in 2025 as upstream oil and pipeline measurement teams spent against a clear use case: inline measurement of water content in produced oil streams to control wells, separators, treatment and transfer quality.
- Demand is projected to increase from USD 282.4 million in 2026 to USD 468.8 million by 2036, at a 5.2% CAGR.
- The market is forecast to record 5.2% CAGR from 2026 to 2036 as companies prove inline measurement of water content in produced oil streams to control wells and transfer quality.
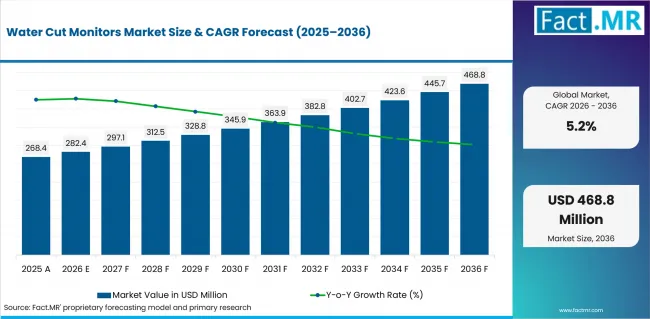
Water Cut Monitors Market Value Analysis | Source: Fact.MR
What are the defining numbers behind Water Cut Monitors Market growth?
USD 186.4 million absolute opportunity is expected by 2036.
Separation and transport control connects with Fact.MR's Gas and Liquid Flow Management Systems Market, where mixed-fluid handling needs reliable instrumentation.
- Demand Drivers in the Market
- Microwave water cut monitors lead as microwave and RF dielectric methods can measure water-in-oil behavior inline without relying only on manual sampling.
- Automatic well testing leads application demand because operators need repeatable water-cut data to compare wells, adjust production and detect changes in reservoir behavior.
- Upstream oil and gas leads because water cut directly affects lifting cost, separation load, corrosion risk, chemical use and production economics.
- Inline installation leads because real-time measurement is more useful than delayed lab results when operators are managing wells and separators.
- Key Segments Analyzed
- By Technology: Microwave Water Cut Monitors is projected to hold 42.2% share in 2026. Microwave water cut monitors lead as dielectric contrast between oil and water supports inline measurement across production and processing conditions.
- By Application: Automatic Well Testing (AWT) is projected to hold 30.9% share in 2026. Automatic well testing leads because operators need repeatable water-cut data to compare wells, adjust production and detect changes in reservoir behavior.
- By End User: Upstream Oil & Gas is projected to hold 40.6% share in 2026. Upstream oil and gas leads because produced-water levels affect operating cost, equipment load and oil-quality decisions.
- By Installation Type: Inline Installation is projected to hold 46.3% share in 2026. Inline installation leads because continuous measurement gives field teams faster control than periodic manual samples.
- By Measurement Principle: Dielectric Measurement is projected to hold 35.6% share in 2026. Dielectric measurement leads because oil and water have different dielectric behavior, making the principle useful for water-content estimation.
- Analyst Opinion at Fact.MR
- Shambhu Nath Jha, Sr. Consultant at Fact.MR, opines, "Water cut monitors matter because every extra barrel of water changes production economics. The market grows when inline measurement is trusted enough to guide well and separator decisions."
- Strategic Implications
- Vendors should prove performance across local crude properties, water ranges, salinity and temperature conditions.
- Operators should connect water-cut monitors to separator control, chemical dosing and well-test workflows.
- Service firms can differentiate through calibration discipline and field support rather than equipment supply alone.
USA continues to be a leading market and is projected to grow at a CAGR of 6.73%; other key markets include Canada, Germany, Australia, UK, Japan and South Korea.
How does the Water Cut Monitors Market break down by segment?
Microwave Water Cut Monitors leads Technology at 42.2%.
Non-intrusive measurement should be compared with Fact.MR's Ultrasonic Flow Meter Market, since ultrasonic techniques support monitoring without adding pressure loss.
Why does Microwave Water Cut Monitors lead Technology?
Microwave Water Cut Monitors is projected to account for 42.2% share in 2026.
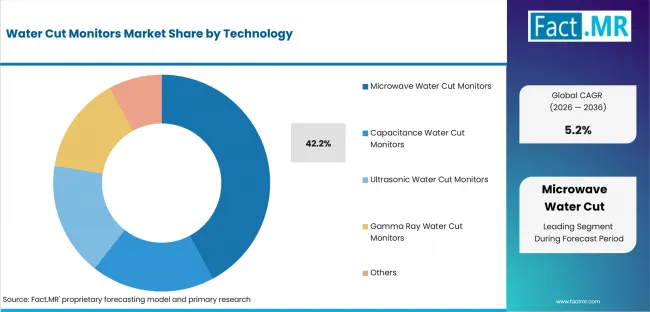
Water Cut Monitors Market Analysis By Technology | Source: Fact.MR
Microwave water cut monitors lead as dielectric contrast between oil and water supports inline measurement across production and processing conditions.
Why does Upstream Oil & Gas lead End User?
Upstream Oil & Gas is projected to account for 40.6% share in 2026.
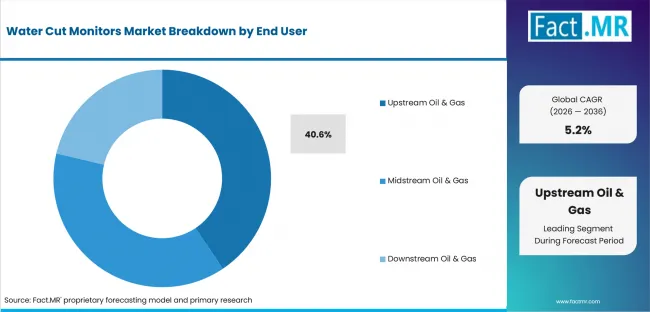
Water Cut Monitors Market Analysis By End User | Source: Fact.MR
Upstream oil and gas leads because produced-water levels affect operating cost, equipment load and oil-quality decisions.
Why does Inline Installation lead Installation Type?
Inline Installation is projected to account for 46.3% share in 2026.
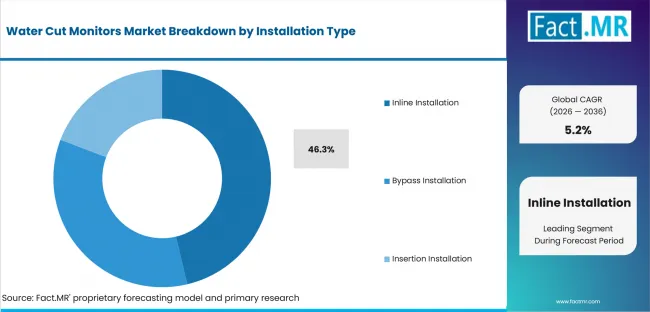
Water Cut Monitors Market Analysis By Installation Type | Source: Fact.MR
Inline installation leads because continuous measurement gives field teams faster control than periodic manual samples.
Why does Dielectric Measurement lead Measurement Principle?
Dielectric Measurement is projected to account for 35.6% share in 2026.
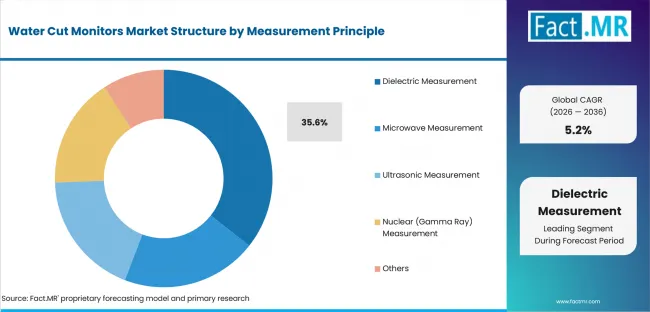
Water Cut Monitors Market Analysis By Measurement Principle | Source: Fact.MR
Dielectric measurement leads because oil and water have different dielectric behavior, making the principle useful for water-content estimation.
What is accelerating Water Cut Monitors Market adoption, and what is holding it back?
Adoption is strongest where buyers can see the product's practical job and the proof needed to approve it. The main drag is buyer doubt around safety, cost, performance or documentation. Field installation choices link to Fact.MR's Oil and Gas Flow Control Equipment Market, where operators weigh reliability, maintenance access and control-room integration.
Drivers Impact Analysis
| DRIVER | QUALITATIVE RELEVANCE | GEOGRAPHIC RELEVANCE | IMPACT TIMELINE |
|---|---|---|---|
| Microwave inline measurement | High | South Korea | Short term (<=2 years) |
| Automatic well testing workflows | High | USA | Short term (<=2 years) |
| Produced-water cost control | Moderate | Canada | Medium term (2-4 years) |
| Digital oilfield integration | Selective | Germany | Medium term (2-4 years) |
Source: Fact.MR analysis. Updated Jul 30, 2026
- Microwave inline measurement: Microwave water cut monitors lead as microwave and RF dielectric methods can measure water-in-oil behavior inline without relying only on manual sampling.
- Automatic well testing workflows: Automatic well testing leads application demand because operators need repeatable water-cut data to compare wells, adjust production and detect changes in reservoir behavior.
- Produced-water cost control: Upstream oil and gas leads because water cut directly affects lifting cost, separation load, corrosion risk, chemical use and production economics.
- Digital oilfield integration: Inline installation leads because real-time measurement is more useful than delayed lab results when operators are managing wells and separators.
Opportunity Impact Analysis
| OPPORTUNITY | QUALITATIVE RELEVANCE | GEOGRAPHIC RELEVANCE | IMPACT TIMELINE |
|---|---|---|---|
| Production optimization dashboards | High | USA | Medium term (2-4 years) |
| Mature-field produced-water management | Moderate | Canada | Medium term (2-4 years) |
| Calibration and field-validation services | Selective | Australia | Medium term (2-4 years) |
Source: Fact.MR analysis. Updated Jul 30, 2026
- Production optimization dashboards: Digital oilfield programs can add demand where water-cut data feeds production optimization dashboards.
- Mature-field produced-water management: Mature fields can increase monitor use as rising produced water makes separation and lifting cost more sensitive.
- Calibration and field-validation services: Service models that bundle calibration, installation and field validation can help operators trust inline readings.
Restraints Impact Analysis
| RESTRAINT | QUALITATIVE RELEVANCE | GEOGRAPHIC RELEVANCE | IMPACT TIMELINE |
|---|---|---|---|
| Emulsion and crude-property measurement errors | High | USA | Short term (<=2 years) |
| Deferred upstream instrumentation capex | Moderate | Canada | Medium term (2-4 years) |
| Trust gap versus manual sampling | Selective | Australia | Medium term (2-4 years) |
Source: Fact.MR analysis. Updated Jul 30, 2026
- Emulsion and crude-property measurement errors: Emulsions, gas entrainment, salinity and changing crude properties can affect measurement reliability if calibration is weak.
- Deferred upstream instrumentation capex: Low oil prices or deferred upstream capex can delay instrumentation upgrades.
- Trust gap versus manual sampling: Operators may retain manual sampling when inline monitors cannot prove accuracy under local field conditions.
Which countries are scaling Water Cut Monitors Market fastest?
Country rates show where buying conditions and supplier proof are already stronger.
Production chemistry decisions connect with Fact.MR's Specialty Oilfield Chemicals Market, because water cut data can guide demulsifier use and separation strategy.
- South Korea: The market is expected to grow at a CAGR of 3.60% from 2026 to 2036. South Korea's demand is selective and tied to instrumentation capability, refinery-linked expertise and regional upstream service opportunities.
- USA: The market is expected to grow at a CAGR of 6.73% from 2026 to 2036. USA growth is shaped by shale production, mature-field optimization, produced-water management and digital oilfield investment.
- Canada: The market is expected to grow at a CAGR of 4.66% from 2026 to 2036. Canada's market is linked to heavy oil, oil sands and mature production where water handling and measurement reliability affect cost.
- Germany: The market is expected to grow at a CAGR of 5.75% from 2026 to 2036. Germany is more of a precision instrumentation and company-market opportunity than a large upstream demand pool.
- Australia: The market is expected to grow at a CAGR of 4.14% from 2026 to 2036. Australia's demand is tied to offshore and onshore production, remote operations and the need for reliable field service.
- UK: The market is expected to grow at a CAGR of 5.20% from 2026 to 2036. UK adoption is linked to North Sea production, mature assets and strict measurement discipline around offshore operations.
- Japan: The market is expected to grow at a CAGR of 6.21% from 2026 to 2036. Japan's outlook is limited by domestic upstream scale but supported by instrumentation, engineering and regional project participation.
The full report provides country-level CAGR analysis across North America, Latin America, Europe, East Asia, South Asia and Oceania, and the Middle East and Africa.
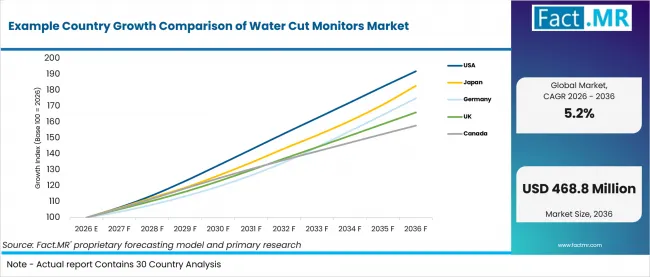
Example Country Growth Comparison Of Water Cut Monitors Market | Source: Fact.MR
| Country | CAGR (2026-2036) |
|---|---|
| South Korea | 3.60% |
| USA | 6.73% |
| Canada | 4.66% |
| Germany | 5.75% |
| Australia | 4.14% |
| UK | 5.20% |
| Japan | 6.21% |
Source: Fact.MR analysis. Updated Jul 30, 2026
What is shaping South Korea's outlook through 2036?
3.60% CAGR from 2026 to 2036.
South Korea's demand is selective and tied to instrumentation capability, refinery-linked expertise and regional upstream service opportunities.
What is shaping USA's outlook through 2036?
6.73% CAGR from 2026 to 2036.
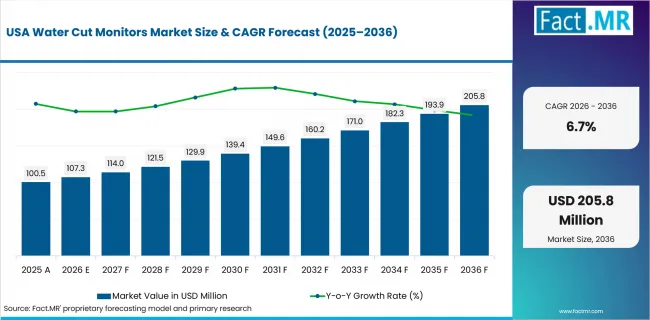
Water Cut Monitors Market Country Value Analysis | Source: Fact.MR
USA growth is shaped by shale production, mature-field optimization, produced-water management and digital oilfield investment.
What is shaping Canada's outlook through 2036?
4.66% CAGR from 2026 to 2036.
Canada's market is linked to heavy oil, oil sands and mature production where water handling and measurement reliability affect cost.
What is shaping Germany's outlook through 2036?
5.75% CAGR from 2026 to 2036.
Germany is more of a precision instrumentation and company-market opportunity than a large upstream demand pool.
What is shaping Australia's outlook through 2036?
4.14% CAGR from 2026 to 2036.
Australia's demand is tied to offshore and onshore production, remote operations and the need for reliable field service.
Who leads the Water Cut Monitors Market?
Weatherford International; Emerson Electric Co.; AMETEK Inc.; SLB (Schlumberger) are among the visible providers in the water cut monitors market.
Weatherford International and Emerson Electric Co. are among the most visible providers. Competition is shaped by product proof, channel access and buyer trust.
Between 2026 and 2036, market rivalry is likely to center on clearer positioning around Microwave Water Cut Monitors, stronger documentation and better support at the point of purchase.
Which companies are the key providers?
Key companies include Weatherford International; Emerson Electric Co.; AMETEK Inc.; SLB (Schlumberger); Halliburton; Phase Dynamics Inc.; Baker Hughes; Agar Corporation.
- Weatherford International
- Emerson Electric Co.
- AMETEK Inc.
- SLB (Schlumberger)
- Halliburton
- Phase Dynamics Inc.
- Baker Hughes
- Agar Corporation
Bibliography
- API MPMS Chapter 10.10, Water Cut Analyzer Guidance.
- Energies, Water-Cut Measurement Techniques in Oil Production and Processing.
- NIST, Report of Investigation Reference Material 8506a.
- NIST, Gulf of Mexico Crude Oil Reference Material.
- BSEE, High Water Content Phase II Analytical Test Methods.
- Fact.MR, Flow Meter Market.
This Report Answers
- The report provides strategic intelligence on the Water Cut Monitors Market across segment choices that shape the 2026 market structure.
- Segment analysis covers Microwave Water Cut Monitors and Automatic Well Testing (AWT) as the share leaders within the 2026 market.
- Country outlook evaluates the listed markets by CAGR and explains the adoption conditions in each country.
- Competitive analysis profiles the named providers and evaluates competition around product proof, channel access and buyer trust.
- The report also places water cut monitoring alongside flow measurement and oilfield-chemicals decisions where produced-water data influences operating control.
What does the Water Cut Monitors Market cover?
The Water Cut Monitors Market covers microwave, RF, capacitance, near-infrared, ultrasonic and related inline or insertion water cut monitors used to measure water content in crude oil and produced-fluid streams.
The Water Cut Monitors Market covers microwave, RF, capacitance, near-infrared, ultrasonic and related inline or insertion water cut monitors used to measure water content in crude oil and produced-fluid streams.
Adjacent spending is included only when it is part of the same purchase decision or operating use case.
What is included in the scope?
The scope includes Technology, Application, End User, Installation Type, Measurement Principle and regional demand.
Coverage includes adjacent segment options only when they are purchased for the same defined market use.
What is excluded from the scope?
laboratory-only moisture analyzers, general flow meters without water-cut measurement, produced-water treatment equipment and manual sampling services sold without monitor hardware or analytics.
The scope excludes laboratory-only moisture analyzers, general flow meters without water-cut measurement, produced-water treatment equipment and manual sampling services sold without monitor hardware or analytics.
How Was the Analysis Built?
The analysis combines primary research with desk research focused on the water cut monitors market, its segment structure and country-level demand.
- Primary Research: Interviews and validation discussions test buyer priorities, adoption barriers, pricing logic and operating requirements.
- Desk Research: The assessment reviews company disclosures, public datasets, regulatory material, technical literature and industry records relevant to the market.
- Market Sizing and Forecasting: Estimates combine top-down and bottom-up checks across demand signals, segment shares, country activity, company participation and adoption constraints.
- Data Validation and Update Cycle: Findings are validated against public evidence, company activity and country-level adoption patterns before final use.
Segmentation
What is the report's scope and coverage?
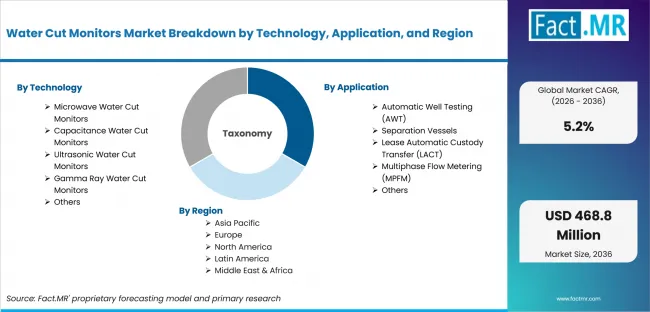
Water Cut Monitors Market Breakdown By Technology, Application, And Region | Source: Fact.MR
| Attribute | Details |
|---|---|
| Quantitative Units | USD 282.4 million in 2026 to USD 468.8 million by 2036, at a 5.2% CAGR. |
| Market Definition | Water Cut Monitors Market covers microwave, RF, capacitance, near-infrared, ultrasonic and related inline or insertion water cut monitors used to measure water content in crude oil and produced-fluid streams. |
| Technology | Microwave Water Cut Monitors; Resonant Microwave; Transmission Microwave; Capacitance Water Cut Monitors; RF Capacitance; High-Frequency Capacitance; Ultrasonic Water Cut Monitors; Transit-Time Ultrasonic; Reflective Ultrasonic; Gamma Ray Water Cut Monitors; Single-Energy Gamma; Dual-Energy Gamma; Others; Infrared (NIR); Density-Based Systems |
| Application | Automatic Well Testing (AWT); Onshore Well Testing; Offshore Well Testing; Separation Vessels; Two-Phase Separators; Three-Phase Separators; Lease Automatic Custody Transfer (LACT); Custody Transfer Skids; Production Metering; Multiphase Flow Metering (MPFM); Production Optimization; Reservoir Monitoring; Others; Pump Protection; Tank Farm & Pipeline Monitoring |
| End User | Upstream Oil & Gas; Onshore Production; Offshore Production; Midstream Oil & Gas; Pipelines; Terminals; Downstream Oil & Gas; Refineries; Petrochemical Plants |
| Installation Type | Inline Installation; Permanent Inline Systems; High-Pressure Inline Systems; Bypass Installation; Process Bypass Systems; Test Loop Systems; Insertion Installation; Retractable Probes; Fixed Probe Systems |
| Measurement Principle | Dielectric Measurement; Capacitance-Based; RF Dielectric; Microwave Measurement; Resonance Method; Attenuation Method; Ultrasonic Measurement; Transit Time; Echo Reflection; Nuclear (Gamma Ray) Measurement; Single Gamma Source; Dual Gamma Source; Others; Optical Sensors; Multi-Sensor Fusion |
| Regions Covered | North America; Latin America; Europe; East Asia; South Asia and Oceania; Middle East and Africa |
| Countries Covered | South Korea; USA; Canada; Germany; Australia; UK; Japan |
| Key Companies Profiled | Weatherford International; Emerson Electric Co.; AMETEK Inc.; SLB (Schlumberger); Halliburton; Phase Dynamics Inc.; Baker Hughes; Agar Corporation |
| Forecast Period | 2026 to 2036 |
| Approach | Hybrid top-down and bottom-up assessment using demand indicators, segment mix, country growth, company participation and public evidence relevant to the category. |
Source: Fact.MR analysis. Updated Jul 30, 2026
How is the market segmented?
-
By Technology:
- Microwave Water Cut Monitors
- Resonant Microwave
- Transmission Microwave
- Capacitance Water Cut Monitors
- RF Capacitance
- High-Frequency Capacitance
- Ultrasonic Water Cut Monitors
- Transit-Time Ultrasonic
- Reflective Ultrasonic
- Gamma Ray Water Cut Monitors
- Single-Energy Gamma
- Dual-Energy Gamma
- Others
- Infrared (NIR)
- Density-Based Systems
-
By Application:
- Automatic Well Testing (AWT)
- Onshore Well Testing
- Offshore Well Testing
- Separation Vessels
- Two-Phase Separators
- Three-Phase Separators
- Lease Automatic Custody Transfer (LACT)
- Custody Transfer Skids
- Production Metering
- Multiphase Flow Metering (MPFM)
- Production Optimization
- Reservoir Monitoring
- Others
- Pump Protection
- Tank Farm & Pipeline Monitoring
-
By End User:
- Upstream Oil & Gas
- Onshore Production
- Offshore Production
- Midstream Oil & Gas
- Pipelines
- Terminals
- Downstream Oil & Gas
- Refineries
- Petrochemical Plants
-
By Installation Type:
- Inline Installation
- Permanent Inline Systems
- High-Pressure Inline Systems
- Bypass Installation
- Process Bypass Systems
- Test Loop Systems
- Insertion Installation
- Retractable Probes
- Fixed Probe Systems
-
By Measurement Principle:
- Dielectric Measurement
- Capacitance-Based
- RF Dielectric
- Microwave Measurement
- Resonance Method
- Attenuation Method
- Ultrasonic Measurement
- Transit Time
- Echo Reflection
- Nuclear (Gamma Ray) Measurement
- Single Gamma Source
- Dual Gamma Source
- Others
- Optical Sensors
- Multi-Sensor Fusion
-
By Region:
- North America
- Latin America
- Europe
- East Asia
- South Asia and Oceania
- Middle East and Africa
Frequently Asked Questions
Which Technology leads the market?
Which Application leads the market?
Which End User leads the market?
Which Installation Type leads the market?
Which Measurement Principle leads the market?
Which country records the highest listed CAGR?
What is the primary driver in this market?
What is the main restraint?
Who worked on this report


Preview the report firsthand - request a free sample
Free SampleGet the brochure for pricing and purchase details
Download PDF