- Market Value (2025): USD 18.4 Bn
- Estimated Value (2026): USD 20.2 Bn
- Forecast Value (2036): USD 20.2 Bn
- CAGR (2026-2036): 9.9%
What is the Water Recycle Reuse Market forecast to be worth by 2036?
USD 20.2 billion in 2026 to USD 51.9 billion by 2036 at 9.9% CAGR.
- The water recycle reuse market reached USD 18.4 billion in 2025 as utilities and industrial operators evaluated reuse systems.
- Demand is projected to rise from USD 20.2 billion in 2026 to USD 51.9 billion by 2036.
- The market is forecast to record 9.9% CAGR from 2026 to 2036 owing to filtration qualification and non-potable reuse.
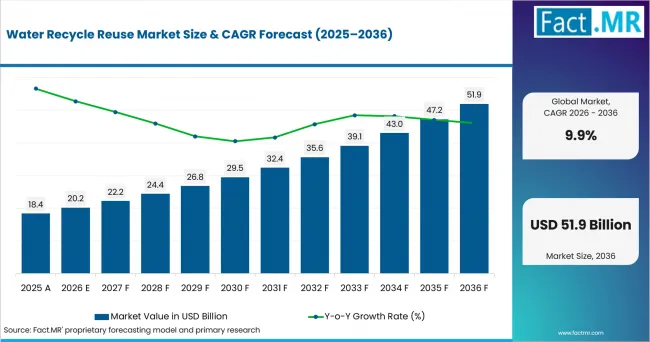
Water Recycle Reuse Market Value Analysis | Source: Fact.MR
What are the defining numbers behind Water Recycle Reuse Market growth?
USD 31.7 billion absolute opportunity by 2036.
- Demand Drivers in the Market
- Filtration system specifications are expected to shape early demand because operators need proof that treated water meets reuse quality requirements.
- Non-potable reuse is anticipated to gain priority where municipalities and industrial sites need dependable water for irrigation and cooling duty.
- Industrial operators are projected to expand reuse review when intake cost and discharge limits make internal recovery valuable.
- Key Segments Analyzed
- By Product Type: Filtration Systems is projected to hold 36.8% share in 2026 because most reuse projects begin with stable solids removal.
- By Application: Non-Potable Water Reuse is projected to account for 31.1% share in 2026 as these uses face fewer public-acceptance hurdles than direct potable reuse.
- By End User: Industrial is anticipated to capture 32.3% share in 2026 since facilities connect reuse with intake control and wastewater management.
- By Distribution Channel: Direct Sales is estimated to represent 30.5% share in 2026 due to the engineering review required for large projects.
- By Treatment Technology: Membrane Filtration is forecast to hold 41.4% share in 2026 as operators use membranes to improve output consistency.
- Analyst Opinion at Fact.MR
- Shambhu Nath Jha, Principal Consultant at Fact.MR, states, “Water recycle reuse providers need to prove fit for the customer’s approved use. Project acceptance is expected to depend on filtration performance and reuse documentation. Maintenance access and stable water quality matter after commissioning.”
- Strategic Implications
- Project developers should separate reuse demand from general industrial water treatment before setting priorities.
- Equipment providers are expected to strengthen proposals by comparing filtration trains with water treatment membrane options.
- Investors should distinguish ordinary wastewater exposure from reuse systems that recover water for repeat use.
South Korea is projected at 7.9% CAGR through industrial reuse readiness. USA is projected at 12.9% as documentation and service response gain weight. Canada reaches 8.9%. Australia reaches 6.9%. Germany reaches 10.9%. UK reaches 9.9%. Japan reaches 11.9%.
How does the Water Recycle Reuse Market break down by segment?
Filtration Systems is expected to lead Product Type at 36.8% share in 2026. Non-Potable Water Reuse leads Application at 31.1% share in 2026.
Which product type dominates?
Filtration Systems is projected to account for 36.8% share in 2026.
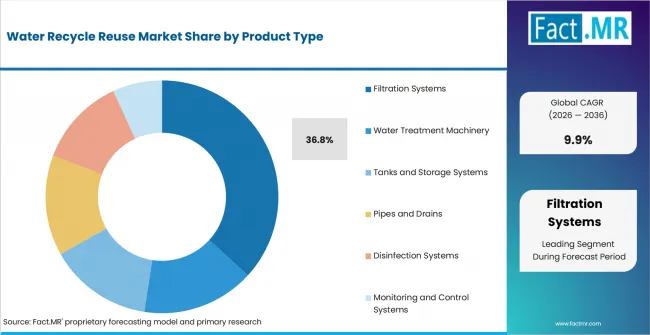
Water Recycle Reuse Market Analysis By Product Type | Source: Fact.MR
Filtration Systems leads because most reuse projects need reliable particle removal before polishing or disinfection. Industrial filtration choices remain central when customers test solids capture and service frequency before approval.
Why does Non-Potable Water Reuse lead Application?
Non-Potable Water Reuse is expected to account for 31.1% share in 2026.
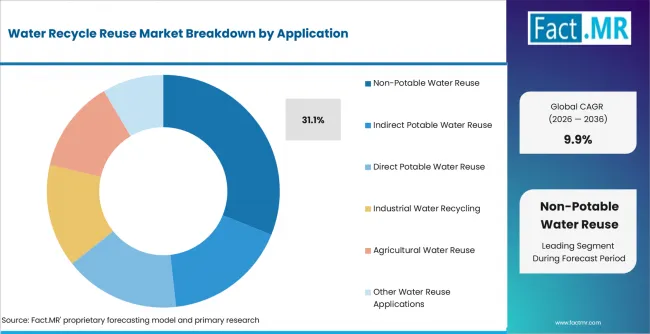
Water Recycle Reuse Market Analysis By Application | Source: Fact.MR
Non-potable uses have a clearer approval route because water does not return directly to drinking supply. Irrigation and process water applications allow operators to set practical quality targets before commissioning.
Why does Industrial lead End User?
Industrial is anticipated to account for 32.3% share in 2026.
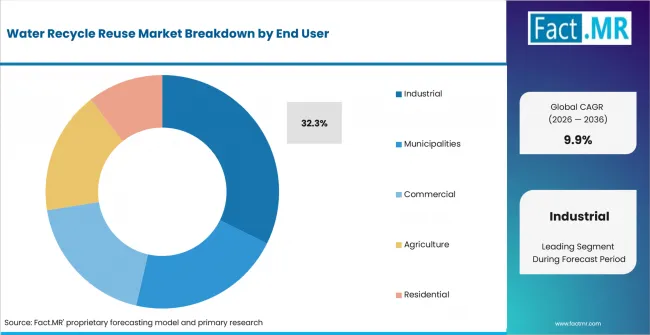
Water Recycle Reuse Market Analysis By End User | Source: Fact.MR
Industrial users lead because reuse is expected to reduce intake exposure and give plants more control over water availability. Demand overlaps with industrial water treatment chemicals when plants need dosing support after filtration.
How does Direct Sales shape demand?
Direct Sales is estimated to account for 30.5% share in 2026.
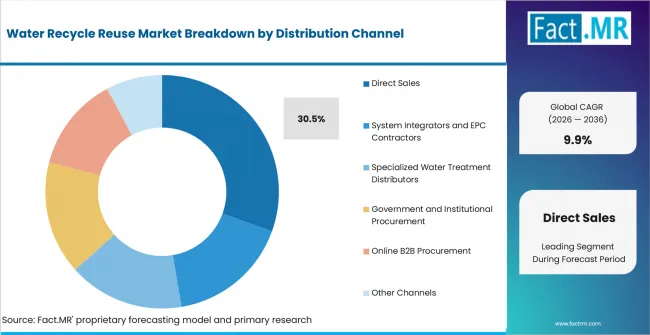
Water Recycle Reuse Market Analysis By Distribution Channel | Source: Fact.MR
Direct Sales leads because large reuse projects need technical review before procurement. Customers compare design support and commissioning terms, then check whether service partners can handle pretreatment system requirements.
Why does Membrane Filtration lead Treatment Technology?
Membrane Filtration is forecast to account for 41.4% share in 2026.
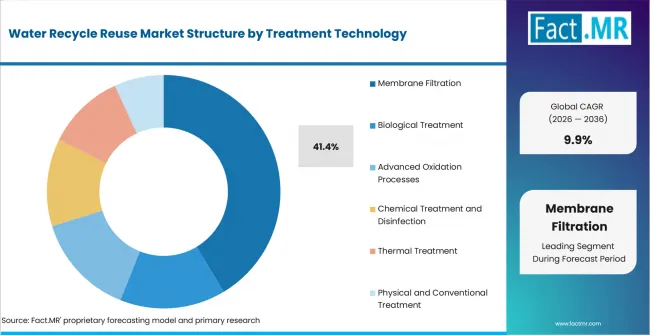
Water Recycle Reuse Market Analysis By Treatment Technology | Source: Fact.MR
Membrane Filtration leads because it supports more consistent water quality before reuse approval. Ultrafiltration systems remain useful where feedwater quality changes and operators need a stable barrier before disinfection.
What is accelerating Water Recycle Reuse Market adoption, and what is holding it back?
Demand is expected to rise through filtration-system approval and wider non-potable water reuse. Growth may be limited by site-specific engineering, capital approvals and water-quality validation.
Drivers Impact Analysis
| DRIVER | (~) % IMPACT ON CAGR | GEOGRAPHIC RELEVANCE | IMPACT TIMELINE |
|---|---|---|---|
| Filtration system specification pull | +2.8% | South Korea, USA | Short term (<= 2 years) |
| Non-potable reuse operating duty | +2.2% | USA, Australia | Short term (<= 2 years) |
| Industrial process water recovery | +1.8% | Germany, South Korea | Medium term (2-4 years) |
| Direct sales and EPC validation | +1.5% | Canada, USA | Medium term (2-4 years) |
| Membrane filtration reliability | +1.0% | Japan, Germany | Long term (>= 4 years) |
Source: Fact.MR analysis. Updated Aug 3, 2026
- Filtration system specification pull: Reuse customers are expected to place early weight on membrane filtration because output quality affects later treatment steps.
- Non-potable reuse operating duty: Municipal and industrial projects are projected to favor stable treatment trains where daily use needs repeatable output.
- Industrial process water recovery: Internal recovery is expected to gain attention when production sites need predictable quality through regular operating cycles.
Opportunity Impact Analysis
| OPPORTUNITY | (~) % IMPACT ON CAGR | GEOGRAPHIC RELEVANCE | IMPACT TIMELINE |
|---|---|---|---|
| Filtration retrofit packages | +1.4% | South Korea and USA | Medium term (2-4 years) |
| Service and inspection contracts | +1.1% | USA and Canada | Medium term (2-4 years) |
| Industrial recovery loops | +0.9% | Germany and Japan | Long term (>= 4 years) |
| Monitoring and automation packages | +0.6% | Australia and UK | Long term (>= 4 years) |
Source: Fact.MR analysis. Updated Aug 3, 2026
- Filtration retrofit packages: Providers are expected to convert replacement work into reuse projects when existing sites need stronger solids removal before disinfection.
- Service and inspection contracts: Ongoing service is expected to matter more where customers want documented water quality after commissioning.
- Industrial recovery loops: Opportunity is expected to increase where biological wastewater treatment prepares process water for later filtration and repeat use.
Restraints Impact Analysis
| RESTRAINT | (~) % IMPACT ON CAGR | GEOGRAPHIC RELEVANCE | IMPACT TIMELINE |
|---|---|---|---|
| Plant-by-plant engineering and capital approval | -1.2% | Global | Short term (<= 2 years) |
| Permitting and public acceptance for reuse | -0.9% | USA, Australia | Short term (<= 2 years) |
| Operating cost and maintenance visibility | -0.8% | Canada, UK | Medium term (2-4 years) |
| Proof gap for smaller reuse projects | -0.5% | Japan, Germany | Medium term (2-4 years) |
Source: Fact.MR analysis. Updated Aug 3, 2026
- Plant-by-plant engineering and capital approval: Reuse projects are expected to slow when plant layout and treated-water targets require more design review.
- Permitting and public acceptance for reuse: Approval can take longer where reuse is visible to communities or potable applications need risk communication.
- Operating cost and maintenance visibility: Customers are expected to delay projects when membrane cleaning and dosing costs remain unclear.
Which countries are scaling Water Recycle Reuse Market fastest?
- South Korea leads as industrial buyers benefit from strong local engineering and clear filtration specifications. The USA follows through wider non-potable reuse across utility and industrial applications.
- Canada remains close to the global rate due to service needs across large territories, while Australia grows through water-security planning. Germany advances through evidence-led industrial adoption.
- The UK remains selective as buyers assess regulatory fit and life-cycle value. Japan expands more slowly because mature infrastructure and quality-focused procurement extend approval cycles.
The full report provides country-level CAGR analysis across North America; Latin America; Europe; East Asia; South Asia; Oceania; and Middle East and Africa.
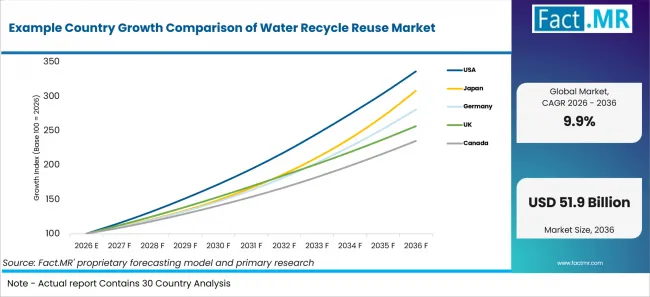
Example Country Growth Comparison Of Water Recycle Reuse Market | Source: Fact.MR
| Country | CAGR (2026-2036) |
|---|---|
| South Korea | 7.9% |
| USA | 12.9% |
| Canada | 8.9% |
| Australia | 6.9% |
| Germany | 10.9% |
| UK | 9.9% |
| Japan | 11.9% |
Source: Fact.MR analysis. Updated Aug 3, 2026
What supports South Korea adoption?
7.9% CAGR, supported by industrial reuse readiness and local engineering support.
South Korea’s industrial customers evaluate reuse through production reliability and serviceable filtration systems. Local engineering support is expected to shorten review where projects need reliable commissioning and maintenance access.
How is USA scaling demand?
12.9% CAGR, driven by non-potable reuse and stronger documentation requirements.
USA demand is tied to municipal and industrial projects that need clear approval records for non-potable reuse. Customers are expected to favor providers that can document output quality after installation.
What shapes Canada’s outlook?
8.9% CAGR, backed by service coverage needs and industrial water management.
Canada’s outlook reflects customers that need equipment support across large operating areas. Reuse decisions are expected to depend on maintenance planning and dependable service response.
How is Australia developing demand?
6.9% CAGR, supported by water security planning and municipal reuse programs.
Australia’s growth is shaped by water security planning and demand for dependable output under variable feedwater conditions. Project timing is expected to depend on approval clarity and operating cost visibility.
How does Germany perform?
10.9% CAGR, led by industrial process discipline and performance validation.
Germany’s growth is expected to remain steady because industrial customers require operating proof before changing water management systems. Providers therefore need clear commissioning records and service responsibility.
What supports UK demand?
9.9% CAGR, supported by selective reuse projects and life-cycle value review.
UK demand is expected to develop where customers justify reuse through water security and predictable maintenance. Procurement review is likely to stay careful when payback depends on custom treatment work.
Why does Japan grow more gradually?
11.9% CAGR, influenced by mature infrastructure and quality-focused procurement.
Japan’s growth is shaped by reliability-focused customers and existing assets that often slow replacement decisions. New reuse configurations are expected to gain approval only after performance proof is clear.
Who leads the Water Recycle Reuse Market?
Veolia Environnement S.A. (Veolia Water Technologies) and Xylem Inc. remain visible across municipal and industrial treatment needs. SUEZ S.A. and Ecolab Inc. (Nalco Water) compete through reuse planning.
Competition is expected to depend on how well each provider matches technology scope with permitted water use. Fluence adds modular reuse exposure. Alfa Laval supports wastewater equipment. Siemens adds automation capability.
Providers are expected to be compared on filtration reliability and commissioning support. Companies that help customers prove water quality after installation are expected to gain stronger consideration.
Which companies are the key providers?
Key companies include Veolia Environnement S.A. (Veolia Water Technologies); Xylem Inc.; SUEZ S.A.; Ecolab Inc. (Nalco Water); DuPont de Nemours, Inc. (DuPont Water Solutions); Fluence Corporation Limited; Alfa Laval AB; and Aquatech International LLC.
- Veolia Environnement S.A. (Veolia Water Technologies)
- Xylem Inc.
- SUEZ S.A.
- Ecolab Inc. (Nalco Water)
- DuPont de Nemours, Inc. (DuPont Water Solutions)
- Fluence Corporation Limited
- Alfa Laval AB
- Aquatech International LLC
Bibliography
- Bureau of Reclamation. (2025, July 16). Reclamation invests almost $200M in water reuse in the Colorado River Basin.
- DuPont de Nemours, Inc. (DuPont Water Solutions). (2026, March 11). DuPont de Nemours, Inc. (DuPont Water Solutions) honored for transformational innovation in industrial water reuse.
- U.S. Environmental Protection Agency. (2025, January). Risk-based framework for developing microbial treatment targets for water reuse (EPA/600/R-25/009).
- Bureau of Reclamation. (2025, January 7). Biden-Harris administration announces $41 million investment in water resources and ecosystem health. U.S. Department of the Interior.
This Report Answers
- The report covers Product Type and Application choices that shape approval.
- Segment analysis covers Filtration Systems and Non-Potable Water Reuse as the 2026 share leaders.
- Country outlook evaluates South Korea and USA alongside Canada and Australia. Germany, UK and Japan complete the comparison.
- Competitive analysis profiles the eight providers listed in the company section.
- Treatment technology assessment covers Membrane Filtration and Biological Treatment. Advanced oxidation completes the process view with chemical disinfection.
What does the Water Recycle Reuse Market cover?
Water recycle reuse systems recover treated water for approved repeat use where treatment reliability determines acceptance.
The market covers filtration systems; membranes; treatment equipment; storage assets; disinfection; and configured services. It includes non-potable reuse, industrial water recycling and approved potable reuse where the system is sold for repeat use.
What is included in the scope?
Water recycle reuse systems are used across industrial; municipal; commercial; agricultural; and residential customers.
The scope includes Product Type and Application alongside End User; Distribution Channel; Treatment Technology; and Region. Sales channels are included only when the system supports a reuse purpose.
What is excluded from the scope?
Unrelated water infrastructure and treatment systems without a repeat-use purpose remain outside the scope of this market.
The scope excludes drinking water systems or discharge treatment with no reuse application. Generic storage tanks are excluded unless they form part of a reuse system. Company revenue without clear reuse exposure is excluded.
How Was the Analysis Built?
The analysis draws on 120+ sources, 35+ company portfolios, 25+ countries, and more than 20 interviews.
- Primary Research: Interviews with manufacturers, retailers, salon operators, and experts examine purchase priorities, adoption, approval requirements, and competitive positioning.
- Desk Research: Desk research covers government statistics, regulatory publications, company filings, trade data, technical studies, industry associations, standards, and public policy.
- Market Sizing and Forecasting: Estimates combine historical performance, demand indicators, pricing, segment shares, company participation, country growth, adoption patterns, and barriers to expansion.
- Data Validation and Update Cycle: Findings are validated against public data, company activity, regulatory changes, product launches, recalls, and adoption shifts.
Segmentation
What is the report’s scope and coverage?
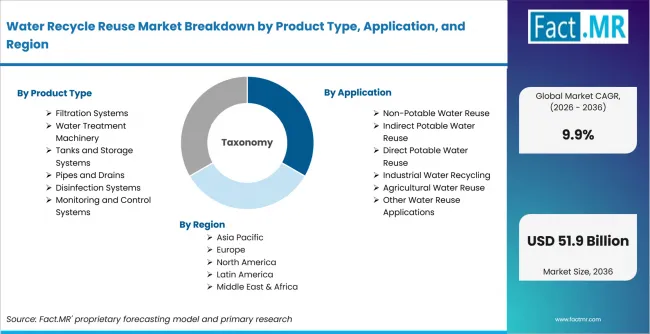
Water Recycle Reuse Market Breakdown By Product Type, Application, And Region | Source: Fact.MR
| Attribute | Details |
|---|---|
| Quantitative Units | USD billion in 2026 to USD billion by 2036 at CAGR |
| Market Definition | Water Recycle Reuse covers systems that recover treated water for approved repeat use. |
| Product Type | Filtration Systems; Membrane Filtration Systems; Media Filtration Systems; Water Treatment Machinery; Monitoring and Control Systems |
| Application | Non-Potable Water Reuse; Indirect Potable Water Reuse; Direct Potable Water Reuse; Industrial Water Recycling; Agricultural Water Reuse |
| End User | Industrial; Municipalities; Commercial; Agriculture; Residential |
| Distribution Channel | Direct Sales; System Integrators and EPC Contractors; Specialized Water Treatment Distributors; Government and Institutional Procurement; Online B2B Procurement |
| Treatment Technology | Membrane Filtration; Biological Treatment; Advanced Oxidation Processes; Chemical Treatment and Disinfection; Physical and Conventional Treatment |
| Regions Covered | North America; Latin America; Europe; East Asia; South Asia & Oceania; Middle East and Africa |
| Countries Covered | South Korea; USA; Canada; Australia; Germany; UK; Japan |
| Key Companies Profiled | Veolia Environnement S.A. (Veolia Water Technologies); Xylem Inc.; SUEZ S.A.; Ecolab Inc. (Nalco Water); DuPont de Nemours, Inc. (DuPont Water Solutions); Fluence Corporation Limited; Alfa Laval AB; Aquatech International LLC |
| Forecast Period | 2026 to 2036 |
| Approach | Hybrid top-down and bottom-up approach using reuse demand; treatment configuration; segment share analysis; country adoption patterns; portfolio review; and interviews |
Source: Fact.MR analysis. Updated Aug 3, 2026
How is the market segmented?
-
By Product Type:
- Filtration Systems
- Membrane Filtration Systems
- Media Filtration Systems
- Water Treatment Machinery
- Water Treatment Pumps
- Water Treatment Processing Equipment
- Tanks and Storage Systems
- Water Storage Tanks
- Equalization and Treatment Tanks
- Pipes and Drains
- Water Reuse Piping Systems
- Drainage and Collection Systems
- Disinfection Systems
- Ultraviolet Disinfection
- Ozone and Chemical Disinfection
- Monitoring and Control Systems
- Water Quality Monitoring Systems
- Automated Process Control Systems
- Filtration Systems
-
By Application:
- Non-Potable Water Reuse
- Irrigation and Landscaping
- Industrial Process Water
- Indirect Potable Water Reuse
- Groundwater Recharge
- Reservoir Augmentation
- Direct Potable Water Reuse
- Advanced Purification Systems
- Direct Drinking Water Reuse
- Industrial Water Recycling
- Process Water Recycling
- Cooling Water Recycling
- Agricultural Water Reuse
- Crop Irrigation
- Livestock and Agricultural Operations
- Other Water Reuse Applications
- Construction Water Reuse
- Street Cleaning and Municipal Applications
- Non-Potable Water Reuse
-
By End User:
- Industrial
- Manufacturing Facilities
- Power Generation and Energy
- Municipalities
- Municipal Water Utilities
- Wastewater Treatment Authorities
- Commercial
- Hotels and Hospitality
- Commercial Buildings and Offices
- Agriculture
- Crop Farming
- Livestock and Agricultural Processing
- Residential
- Single-Family Homes
- Multi-Family Residential Buildings
- Industrial
-
By Distribution Channel:
- Direct Sales
- Direct Sales to Municipalities
- Direct Sales to Industrial Customers
- System Integrators and EPC Contractors
- Engineering Procurement and Construction Firms
- Water Infrastructure Integrators
- Specialized Water Treatment Distributors
- Industrial Water Equipment Distributors
- Municipal Water Solution Distributors
- Government and Institutional Procurement
- Public Water Utility Procurement
- Government Infrastructure Programs
- Online B2B Procurement
- Digital Industrial Marketplaces
- Online Water Equipment Platforms
- Other Channels
- Local Agents and Representatives
- Regional Solution Partners
- Direct Sales
-
By Treatment Technology:
- Membrane Filtration
- Reverse Osmosis
- Ultrafiltration and Microfiltration
- Biological Treatment
- Activated Sludge Treatment
- Membrane Bioreactors
- Advanced Oxidation Processes
- Ozonation
- UV-Based Advanced Oxidation
- Chemical Treatment and Disinfection
- Chlorination
- Coagulation and Flocculation
- Thermal Treatment
- Multi-Effect Distillation
- Membrane Distillation
- Physical and Conventional Treatment
- Sedimentation
- Granular Media Filtration
- Membrane Filtration
-
By Region:
- North America
- Latin America
- Europe
- East Asia
- South Asia and Oceania
- Middle East and Africa
Frequently Asked Questions
Which Product Type leads the market?
Which Application leads the market?
Which End User leads the market?
Which Distribution Channel leads the market?
Which Treatment Technology leads the market?
Which country records the highest listed CAGR?
What is the primary driver in this market?
What is the main restraint?
Who worked on this report


Preview the report firsthand - request a free sample
Free SampleGet the brochure for pricing and purchase details
Download PDF