- Market Value (2025): USD 6.0 Bn
- Estimated Value (2026): USD 6.32 Bn
- Forecast Value (2036): USD 10.6 Bn
- CAGR (2026-2036): 5.3%
What is the Eco Paper Market forecast to be worth by 2036?
USD 6.3 billion in 2026 to USD 10.6 billion by 2036, at a 5.3% CAGR.
- As per Fact.MR analysis, the eco paper market reached USD 6.0 billion in 2025.
- Demand will increase from USD 6.32 billion in 2026 to USD 10.6 billion in 2036.
- The market is forecast to record a 5.3% CAGR during 2026 to 2036 as packaging converters and commercial users purchase certified and recycled paper grades.
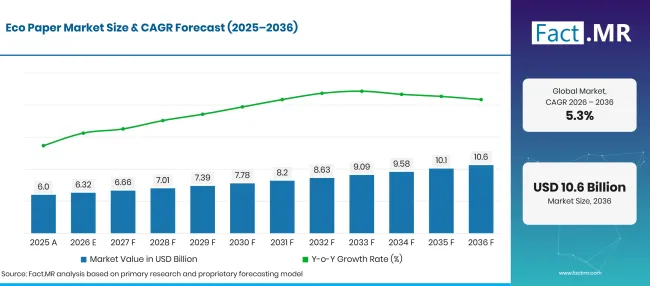
Factmr Eco Paper Market Forecast Global | Source: Fact.MR
| Year | Basis | Market Value (USD billion) |
|---|---|---|
| 2025 | Actual | 6.0 |
| 2026 | Estimate | 6.32 |
| 2036 | Forecast | 10.6 |
| CAGR 2026 to 2036 | Forecast period | 5.3% |
Source: Fact.MR analysis. Updated Oct 13, 2026
What are the defining numbers behind Eco Paper Market growth?
USD 4.3 billion absolute chance between 2026 and 2036, with recycled paper and packaging forming the main purchasing base.
- Demand Drivers in the Market
- Packaging converters increasingly rely on recovered paper that delivers dependable box strength and print quality. The European Commission's packaging framework keeps attention on material recovery and clear recyclability information. Grades that hold their performance through repeated production runs attract stronger buyer interest.
- Brand packaging teams place greater emphasis on documented material origin and recyclability details, especially when several suppliers contribute to one finished pack. Clear records make supplier comparisons easier and strengthen purchasing decisions.
- Mills make wider use of recycled fibre in packaging board and selected commercial paper grades. Consistent sorting and dependable supply schedules allow manufacturers to keep production on track when recovered-paper availability shifts.
- Printers and institutional buyers give preference to papers backed by clear fibre certification when purchasing standards must be met. Familiar print quality and transparent sourcing records carry significant weight during product selection.
- Key Segments Analyzed
- By Product Type: Recycled Paper holds 42.3% share in 2026, as recovered-fibre grades supply packaging and routine commercial printing.
- By Application: Packaging accounts for 54.2% share in 2026 because box and wrapping converters buy large volumes of paper.
- By End-User: Industrial users represent 38.6% share in 2026, reflecting repeat orders from packaging and processing operations.
- By Distribution Channel: Specialty Stores capture 52.4% share in 2026, reflecting purchases through dedicated paper merchants and specialist distributors.
- Analyst Opinion at Fact.MR
- Shambhu Nath Jha, Principal Consultant at Fact.MR, states, “Eco paper demand depends increasingly on a converter's ability to secure the same paper grade without disrupting production. Mills with reliable recovered-fibre sorting and clear certification records are better positioned to serve buyers tracking material origin. Strength and surface-finish checks stay central to supplier approval as purchasers compare paper quality across potential suppliers.”
- Strategic Implications
- Paper mills are set to provide clearer separation between recycled-content claims and chain-of-custody certification, along with records linked to the specific paper grades supplied. Better documentation gives buyers greater confidence during product reviews and purchasing decisions.
- Packaging converters are increasingly evaluating material strength and folding performance before introducing new paper grades across high-volume production lines. Early testing helps confirm that paper performs as intended under regular operating conditions.
- Distributors are placing greater focus on maintaining accurate fibre-content and certification records so commercial buyers can compare paper grades more efficiently. Clear information shortens the review process and makes supplier comparisons easier.
- Brand owners are taking a closer look at paper choices alongside printing and packaging requirements before production begins. Better coordination across supply partners reduces the need for changes once production is underway.
Germany is poised to record a 6.7% CAGR, while Brazil reaches 6.1% as recovered-paper use expands across packaging supply chains. The United States posts 5.5% growth, supported by steady demand for containerboard across packaging applications. The United Kingdom records 4.9%, while Japan reaches 4.4%, backed by well-established paper collection systems and paperboard manufacturing activity.
How does the Eco Paper Market break down by segment?
Recycled Paper 42.3%; Packaging 54.2%; Industrial 38.6%; Specialty Stores 52.4% in 2026.
Which Product Type dominates?
Recycled Paper holds 42.3% share in 2026.
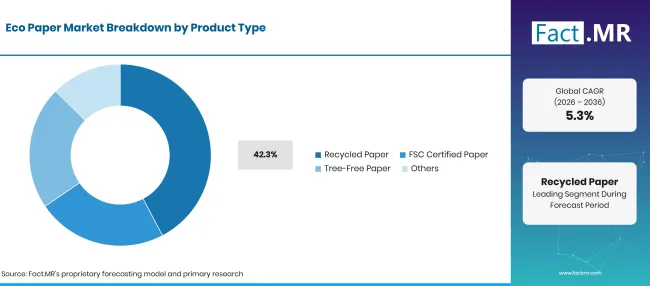
Factmr Eco Paper Market Breakdown Product Type | Source: Fact.MR
| Product Type | Share (2026) |
|---|---|
| Recycled Paper (Leading segment) | 42.3% |
| Other segments combined | 57.7%* |
| Total | 100.0% |
Source: Fact.MR analysis. Updated Oct 13, 2026
Recycled paper is increasing ground in carton and protective-board production, where consistent strength matters for day-to-day operations. Mills are making greater use of recovered fiber when sorting quality matches strength and surface requirements. FSC-certified paper appeals to buyers looking for clear fiber-tracking records. Tree-free paper offers an alternative fiber source for organizations able to run these grades on existing equipment.
What leads the Application segment?
Packaging accounts for 54.2% share in 2026.
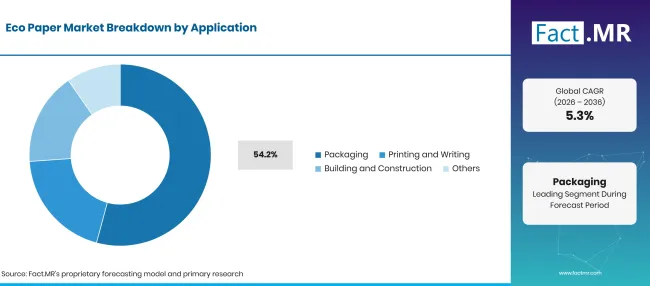
Factmr Eco Paper Market Breakdown Application | Source: Fact.MR
| Application | Share (2026) |
|---|---|
| Packaging (Leading segment) | 54.2% |
| Other segments combined | 45.8%* |
| Total | 100.0% |
Source: Fact.MR analysis. Updated Oct 13, 2026
Packaging companies use eco paper for corrugated boxes and folding cartons that keep products safe during storage and delivery. Printing and writing paper buyers look for a smooth surface and consistent paper quality for everyday use. In construction, eco paper is used for coverings and protective materials when the paper grade matches the job requirements.
How does End-User purchasing shape sales?
Industrial represents 38.6% share in 2026.
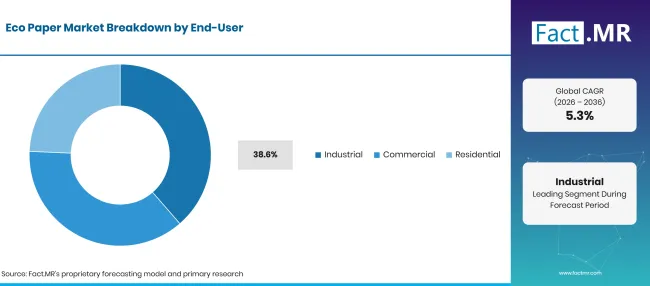
Factmr Eco Paper Market Breakdown End User | Source: Fact.MR
| End-User | Share (2026) |
|---|---|
| Industrial (Leading segment) | 38.6% |
| Other segments combined | 61.4%* |
| Total | 100.0% |
Source: Fact.MR analysis. Updated Oct 13, 2026
Industrial buyers purchase paper regularly for packaging and converting work. Consistent paper strength helps keep production running smoothly when a grade is replaced. Commercial customers usually look for clear print requirements and dependable paper quality. Household use depends on whether the paper provides the protection, appearance, or finish needed for the product.
Which Distribution Channel serves the largest share?
Specialty Stores capture 52.4% share in 2026.
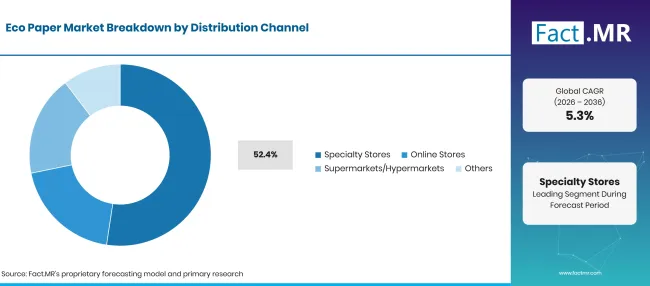
Factmr Eco Paper Market Breakdown Distribution Channel | Source: Fact.MR
| Distribution Channel | Share (2026) |
|---|---|
| Specialty Stores (Leading segment) | 52.4% |
| Other segments combined | 47.6%* |
| Total | 100.0% |
Source: Fact.MR analysis. Updated Oct 13, 2026
Specialty paper stores and paper merchants help customers choose the right paper type, weight, and certified grades for their work. They also supply smaller quantities to printers that do not buy directly from paper mills. Online channels make repeat ordering easier for familiar paper grades, while general retailers focus on everyday paper products. Teams choosing specialty papers look for consistent print quality and clear product information to keep production running smoothly.
What is accelerating Eco Paper Market adoption, and what is holding it back?
Steady recovered fiber supply and growing packaging demand support wider use of eco paper. Differences in paper quality and the cost of switching to new grades can slow adoption.
Drivers Impact Analysis
| DRIVER | (~) % IMPACT ON CAGR | GEOGRAPHIC RELEVANCE | IMPACT TIMELINE |
|---|---|---|---|
| Packaging applications | +1.0% | Global | Medium term (2–4 years) |
| Recovered-fibre collection | +0.8% | Europe, North America | Short term (<= 2 years) |
| Certified sourcing | +0.7% | Europe, Japan | Medium term (2–4 years) |
| Converter testing | +0.5% | Global | Medium term (2–4 years) |
| Paper-based substitution | +0.4% | Global | Long term (>= 4 years) |
Source: Fact.MR analysis. Updated Oct 13, 2026
Opportunity Impact Analysis
| OPPORTUNITY | (~) % IMPACT ON CAGR | GEOGRAPHIC RELEVANCE | IMPACT TIMELINE |
|---|---|---|---|
| Higher-grade recovered fibre | +0.8% | Europe, United States | Medium term (2–4 years) |
| Traceable certified grades | +0.6% | Global | Medium term (2–4 years) |
| Packaging specification support | +0.5% | Global | Short term (<= 2 years) |
| Merchant-led smaller orders | +0.4% | Global | Medium term (2–4 years) |
Source: Fact.MR analysis. Updated Oct 13, 2026
Restraints Impact Analysis
| RESTRAINT | (~) % IMPACT ON CAGR | GEOGRAPHIC RELEVANCE | IMPACT TIMELINE |
|---|---|---|---|
| Variable recovered fibre | -0.8% | Global | Short term (<= 2 years) |
| Production cost pressure | -0.6% | Global | Medium term (2–4 years) |
| Grade conversion expense | -0.5% | Global | Medium term (2–4 years) |
| Complex environmental claims | -0.4% | Global | Long term (>= 4 years) |
Source: Fact.MR analysis. Updated Oct 13, 2026
Which countries are scaling the Eco Paper Market through 2036?
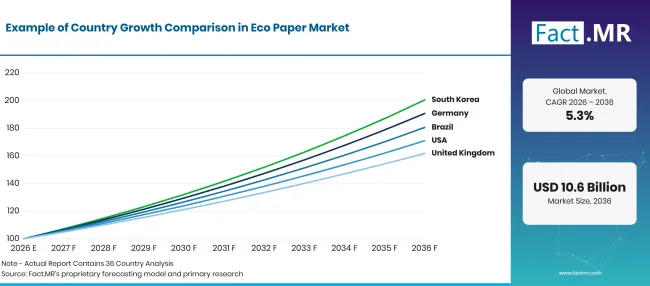
Factmr Eco Paper Market Growth Index | Source: Fact.MR
| Country | CAGR (2026–2036) |
|---|---|
| Germany | 6.7% |
| Brazil | 6.1% |
| United States | 5.5% |
| United Kingdom | 4.9% |
| Japan | 4.4% |
Source: Fact.MR analysis. Updated Oct 13, 2026
Why is Germany leading eco paper adoption?
6.7% CAGR, driven by strong paper recovery and an established packaging-converting base.
German paper mills benefit from well-established collection and sorting systems that support recycled paper production. Umweltbundesamt reported that around 5.5 million tonnes of packaging waste collected by dual systems were recycled in 2024 [3]. Packaging converters also compare recycled and certified paper grades before changing suppliers.
How is Brazil expanding eco paper use?
6.1% CAGR, shaped by industrial packaging and recovered-paper collection.
Brazilian packaging converters use recovered fiber collected through local recycling networks and cooperatives. Ponta Grossa reported that its Recicla PG programme collected 16,121 kg of paper and cardboard in 2026 [4]. Paper merchants also supply certified paper grades for buyers that need documented sourcing records.
What is driving eco paper sales in the United States?
5.5% CAGR, linked to recovered fiber use in packaging board.
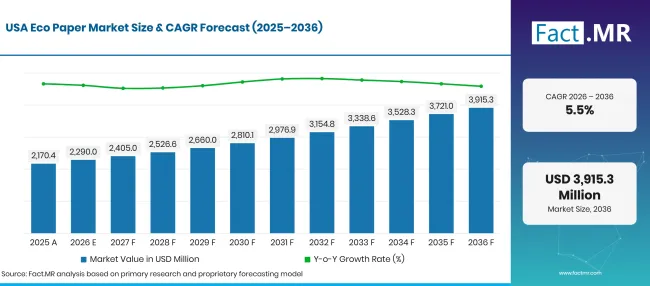
Factmr Eco Paper Market Forecast Usa | Source: Fact.MR
U.S. paper mills rely heavily on recovered paper and cardboard to produce packaging grades. AF&PA reported that American mills used 31.4 million tons of recycled paper in 2025 [1]. Large packaging converters look for consistent board strength during long production runs, while commercial printers also use certified paper grades.
How is the United Kingdom developing eco paper demand?
4.9% CAGR, influenced by recovered packaging flows and material records.
UK paper mills and converters rely on recovered paper collected through packaging recycling systems. Defra reported that 3.895 million tonnes of paper and cardboard packaging were recycled in 2025 [2]. Growing online shopping creates steady demand for shipping and protective packaging materials. Commercial printers can source recycled and certified paper grades through specialist merchants.
Why is Japan maintaining steady eco paper growth?
4.4% CAGR, influenced by grade quality and established paper processing.
Japanese paper mills use recovered fiber on a large scale while maintaining print and packaging quality. The Japan Paper Association reported 66.7% recovered-paper use in paper and paperboard manufacturing in 2025 [5]. Strong collection systems provide mills with a steady fiber supply, while specialist paper merchants help smaller buyers find suitable grades.
Who leads the Eco Paper Market?
Mondi and Stora Enso supply paper-based packaging materials, where paper quality and fibre sourcing often influence repeat purchases. UPM-Kymmene and Sappi serve printing and specialty paper markets, where surface quality and certification records play a role in buying decisions. Nippon Paper Industries and Oji Holdings operate paper mills in Japan, supplying paper grades that meet domestic market needs while managing fibre sourcing requirements.
Smurfit Westrock and International Paper supply containerboard and corrugated paper used in packaging production. Nine Dragons Paper is active in paperboard manufacturing. Competition varies by paper type and end use, rather than being based on a single product category.
Which companies are the key providers?
Key companies include Mondi Group; Stora Enso; UPM-Kymmene Corporation; Sappi Limited; Nippon Paper Industries Co., Ltd.; Nine Dragons Paper Holdings Limited; Smurfit Westrock plc; International Paper Company; and Oji Holdings Corporation.
- Mondi Group
- Stora Enso
- UPM-Kymmene Corporation
- Sappi Limited
- Nippon Paper Industries Co., Ltd.
- Nine Dragons Paper Holdings Limited
- Smurfit Westrock plc
- International Paper Company
- Oji Holdings Corporation
Bibliography
- [1] American Forest & Paper Association. (2026, August 28). Paper industry announces 2025 U.S. paper recycling rates.
- [2] Department for Environment, Food & Rural Affairs. (2026, September 23). UK statistics on waste.
- [3] Umweltbundesamt. (2026, January 27). Facts against myths: Packaging waste recycling in Germany is working.
- [4] Prefeitura Municipal de Ponta Grossa. (2026, June 10). Campanha do vidro impulsiona Recicla PG, que ultrapassa marca de 50 toneladas de materiais recebidos.
- [5] Japan Paper Association. (2026). Recovered paper use and collection rates.
- [6] Ministry of the Environment, Japan. (2026, March 27). Municipal solid waste generation and disposal in FY2024.
This Report Answers
- The report assesses product selection among recycled, certified and alternative-fibre paper grades.
- Application analysis explains why packaging accounts for the larger specified share of paper purchases.
- The country comparison examines the practical relationship between fibre collection and industrial paper converting.
- Competitive analysis separates packaging-board businesses from printing-paper and consumer-paper suppliers.
- Distribution analysis shows when specialist merchants are more useful than general consumer retail channels.
What does the Eco Paper Market cover?
The market covers paper products marketed on the basis of recycled fibre, verified responsible sourcing or alternative plant fibre. It considers paper used in packaging and printed products as well as suitable construction applications. The broader context includes related Fact.MR analysis of paper packaging materials and recovered paper.
What is included in the scope?
The scope includes recovered-fibre paper and relevant packaging board sold to industrial converters. Certified paper enters where the specific product carries a chain-of-custody claim. Sales are counted within the stated paper market boundary and exclude secondary trading of collected waste without finished-paper production.
What is excluded from the scope?
The scope excludes plastics and paper-free materials marketed as packaging substitutes. Waste collection fees and recycling plant equipment are not finished-paper sales. Finished hygiene goods are outside the core paper-grade comparison even where their manufacturers also operate paper businesses.
How Was the Analysis Built?
The analysis draws on 120+ sources, 35+ company portfolios, 25+ countries, and more than 20 industry interviews.
- Primary Research: Primary research includes discussions with manufacturers, service providers, technology developers, distributors, end users, and subject-matter experts. These conversations examine purchasing priorities, product adoption, operational challenges, approval requirements, competitive positioning, and the factors that influence wider market acceptance.
- Desk Research: Desk research covers government statistics, regulatory publications, company filings, trade data, technical studies, industry associations, standards, public policy, and other authoritative sources. Every source used in the analysis is documented in the bibliography.
- Market Sizing and Forecasting: Market estimates combine historical performance, demand indicators, pricing and volume trends, segment shares, company participation, country-level growth, adoption patterns, investment activity, and barriers to market expansion.
- Data Validation and Update Cycle: Findings are validated by comparing primary interviews with public data, company activity, regulatory changes, trade patterns, and industry developments. Regular updates review new product launches, capacity changes, partnerships, approvals, and shifts in commercial adoption.
Segmentation
What is the report’s scope and coverage?
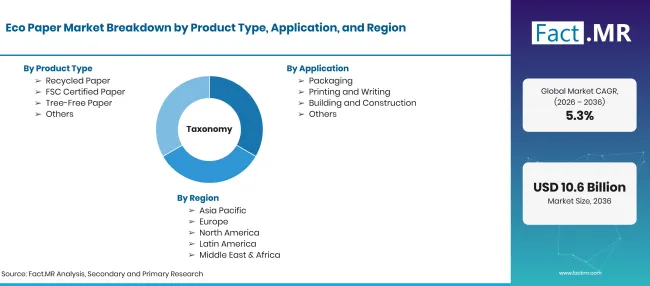
Factmr Eco Paper Market Taxonomy | Source: Fact.MR
| Attribute | Details |
|---|---|
| Quantitative Units | USD billion in 2026 to USD billion by 2036 at CAGR |
| Market Definition | Paper products sold on the basis of recovered fibre, certified fibre sourcing or qualified alternative plant fibres. |
| Product Type | Recycled Paper; FSC Certified Paper; Tree-Free Paper; Others |
| Application | Packaging; Printing and Writing; Building and Construction |
| End-User | Industrial; Commercial; Residential; Others |
| Distribution Channel | Specialty Stores; Online Stores; Supermarkets/Hypermarkets; Others |
| Regions Covered | North America; Latin America; Western Europe; Eastern Europe; East Asia; South Asia & Pacific; Middle East & Africa |
| Countries Covered | Germany; Brazil; United States; United Kingdom; Japan |
| Companies Profiled | Mondi; Stora Enso; UPM; Sappi; Nippon Paper; Nine Dragons; Smurfit Westrock; International Paper; Oji |
| Forecast Period | 2026 to 2036 |
| Approach | Assessment of fibre grades, paper applications, buying channels, country outlook and publicly documented manufacturer activity |
Source: Fact.MR analysis. Updated Oct 13, 2026
How is the market segmented?
-
By Product Type
- Recycled Paper
- FSC Certified Paper
- Tree-Free Paper
- Others
-
By Application
- Packaging
- Printing and Writing
- Building and Construction
-
By End-User
- Industrial
- Commercial
- Residential
- Others
-
By Distribution Channel
- Specialty Stores
- Online Stores
- Supermarkets/Hypermarkets
- Others
-
By Region
- North America
- Latin America
- Western Europe
- Eastern Europe
- East Asia
- South Asia & Pacific
- Middle East & Africa
Frequently Asked Questions
How big is the eco paper market in 2026?
What is the CAGR from 2026 to 2036?
Which product type leads?
Which application leads?
Which companies participate in eco paper?
Who worked on this report


Preview the report firsthand - request a free sample
Free SampleGet the brochure for pricing and purchase details
Download PDF