- Market Value (2025): USD 3.5 Bn
- Estimated Value (2026): USD 3.7 Bn
- Forecast Value (2036): USD 6.9 Bn
- CAGR (2026-2036): 6.3%
What is the Edge Power Monitoring Systems Market forecast to be worth by 2036?
USD 3.7 billion in 2026 to USD 6.9 billion by 2036 at a 6.3% CAGR.
- The Edge Power Monitoring Systems Market was valued at USD 3.5 billion in 2025.
- Demand is projected to increase from USD 3.7 billion in 2026 to USD 6.9 billion by 2036.
- The market is forecast to record a 6.3% CAGR from 2026 to 2036 as data-center, telecom-edge and industrial-edge teams add more local power monitoring.
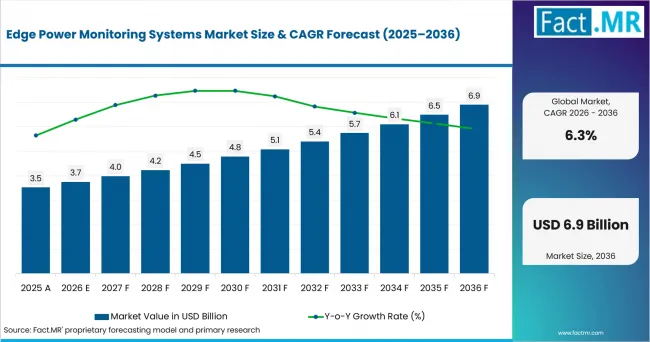
Edge Power Monitoring Systems Market Value Analysis | Source: Fact.MR
What are the defining numbers behind Edge Power Monitoring Systems Market growth?
An absolute opportunity of USD 3.1 billion is expected between 2026 and 2036.
- Demand Drivers in the Market
- Data-center teams need to monitor power use at the branch and rack level because higher computing loads make overloads and power limits costlier. In June 2026, the U.S. Department of Energy reported 11.8% of U.S. electricity use by 2030.
- Industrial sites can check panel and feeder data to see where power use or voltage changes. It also helps to check power issue comes from the plant or the main utility supply.
- Retail stores and branch sites can use small monitoring tools which connect to remote systems. These tools are more useful when only few power experts at the present.
- Key Segments Analyzed
- By Measurement Layer: Branch circuit is expected to hold 30.0% share in 2026 because it gives facility teams a circuit-level view without requiring device-by-device instrumentation.
- By Metric: Power / energy is projected to account for 36.0% share in 2026 because it directly supports load planning, cost tracking and efficiency work.
- By Compute: Embedded meter is expected to capture 33.0% share in 2026 because built-in metering cuts setup work at panels, PDUs and power equipment.
- By Site: Data center is estimated to represent 29.0% share in 2026 because dense circuits and costly downtime increase the value of local power data.
- Analyst Opinion at Fact.MR
- Shambhu Nath Jha, Principal Consultant at Fact.MR, states, “Sites can find power problems more easily when monitoring happens close to the equipment. More edge computing also means buyers need tools that can quickly notice power changes and share data with other systems. Accurate meters that are easy to install and connect can also work across sites that use different equipment.”
- Strategic Implications
- Meter manufacturers can make power and power-quality data easy to share with local screens and other management systems. Germany already has wide network coverage. Bundesnetzagentur reported in December 2025 that around 95% of the country’s land area had 5G coverage by October 2025.
- PDU and UPS suppliers can make built-in monitoring easier to set up at many small sites. Keeping the same alarm rules and device names across these sites can make daily work easier.
- Facility software providers can bring meter data and maintenance work together. Operators can check power information in one place instead of moving between different screens.
As data centers add more strain to the power grid, France has the highest forecast growth rate at 7.3% CAGR through 2036. UK is at 6.6% with increasing full-fibre and 5G coverage. 5.9% in Japan as the planning of power and networks for data centers gets more closely coupled. The USA follows at 5.6% as data centers use more power, while Germany records 5.3% as wider 5G coverage supports power needs at remote sites.
How does the Edge Power Monitoring Systems Market break down by segment?
Power / energy leads Metric at 36.0% share in 2026; Embedded meter leads Compute at 33.0% share.
Which Measurement Layer dominates?
Branch circuit is expected to hold 30.0% share in 2026.
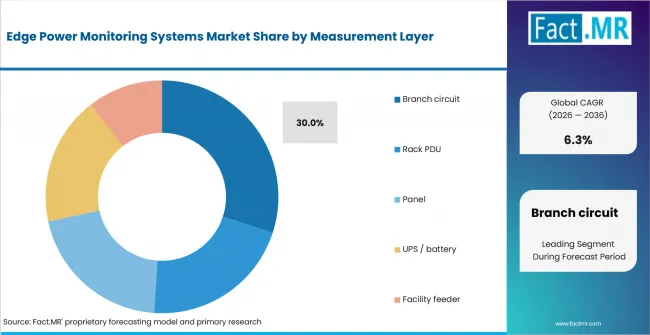
Edge Power Monitoring Systems Market Analysis By Measurement Layer | Source: Fact.MR
Branch-circuit monitoring leads the pack because it measures power use on different parts. Monitoring of rack PDU is primarily used in IT environments with many devices. Monitoring of the panel, UPS and feeder provides a broader view of site power consumption and backup power.
What leads the Metric segment?
Power / energy is projected to account for 36.0% share in 2026.
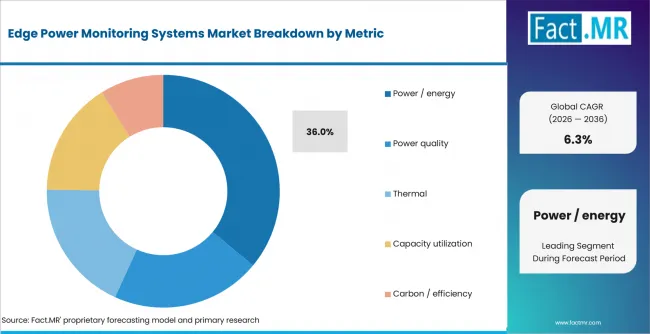
Edge Power Monitoring Systems Market Analysis By Metric | Source: Fact.MR
Monitor power use and running costs power and energy readings are important to monitor. Sensitive equipment protects power quality data. The temperature readings can show equipment under stress and the load data assists with future power planning. Accurate energy data for calculated carbon levels and energy efficiency.
How does Compute shape demand?
Embedded meter is expected to capture 33.0% share in 2026.
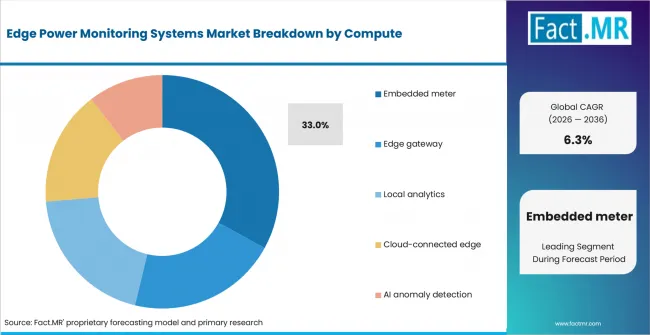
Edge Power Monitoring Systems Market Analysis By Compute | Source: Fact.MR
Embedded meters are useful because they need less extra wiring and provide power data. Edge gateways bring data from several meters into one place. Local systems keep alarms working at the site, while cloud platforms make it easier to compare power data from different locations.
What supports Data center within Site?
Data center is estimated to represent 29.0% share in 2026.
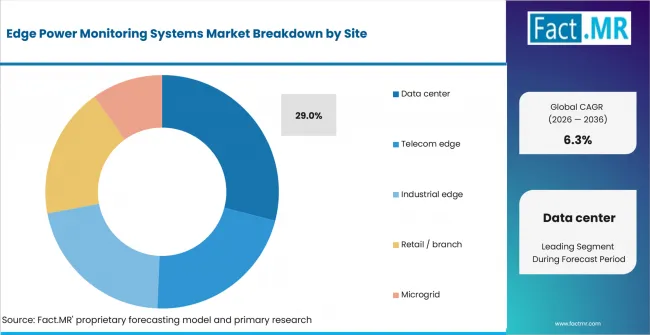
Edge Power Monitoring Systems Market Analysis By Site | Source: Fact.MR
Data centers need close power monitoring because many racks and high equipment use more pressure on available power. Teams use these systems to check power use across racks and feeders. In April 2026, RTE reported that data centers directly connected to France’s public power transmission system used almost 1 TWh of electricity in 2025.
What is accelerating Edge Power Monitoring Systems Market adoption, and what is holding it back?
Demand is supported by the need to clearly track power use at each site, but connecting different systems can slow installation.
Drivers Impact Analysis
| DRIVER | (~) % IMPACT ON CAGR | GEOGRAPHIC RELEVANCE | IMPACT TIMELINE |
|---|---|---|---|
| Higher data-center power density | +1.4% | North America, Europe, East Asia | Short term (<= 2 years) |
| Expansion of distributed edge sites | +1.1% | Global | Medium term (2-4 years) |
| Remote operations and maintenance | +0.9% | Global | Short term (<= 2 years) |
| Energy-efficiency and capacity pressure | +0.8% | North America, Europe, East Asia | Medium term (2-4 years) |
Source: Fact.MR analysis. Updated Oct 1, 2026
Opportunity Impact Analysis
| OPPORTUNITY | (~) % IMPACT ON CAGR | GEOGRAPHIC RELEVANCE | IMPACT TIMELINE |
|---|---|---|---|
| Embedded monitoring in PDUs and UPS | +0.9% | Global | Medium term (2-4 years) |
| Local analytics for disconnected sites | +0.7% | Industrial and telecom edge | Short term (<= 2 years) |
| Microgrid and distributed-energy monitoring | +0.6% | North America, Europe, Japan | Long term (>= 4 years) |
Source: Fact.MR analysis. Updated Oct 1, 2026
Restraints Impact Analysis
| RESTRAINT | (~) % IMPACT ON CAGR | GEOGRAPHIC RELEVANCE | IMPACT TIMELINE |
|---|---|---|---|
| Mixed legacy protocols and device estates | -0.7% | Global | Short term (<= 2 years) |
| Integration and commissioning cost | -0.5% | Global | Medium term (2-4 years) |
| Cybersecurity controls on connected meters | -0.4% | North America, Europe, Japan | Medium term (2-4 years) |
Source: Fact.MR analysis. Updated Oct 1, 2026
Which countries are scaling the Edge Power Monitoring Systems Market through 2036?
- The displayed country range spans 2.0 percentage points, from France at 7.3% CAGR to Germany at 5.3% CAGR.
- France remains 0.7 percentage point above the UK as data-center connection capacity continues to rise.
- The UK remains 0.7 percentage point above Japan as full-fibre and 5G reach expands the base of remote digital sites.
- Japan remains 0.3 percentage point above the USA as national planning links data-center development with electricity and telecom systems.
- The USA remains 0.3 percentage point above Germany as data-center electricity growth adds pressure for better circuit and rack-level view.
- Germany closes the displayed range while broad 5G coverage and rising digital use support more local power loads.
Similar growth rates can still lead to different market conditions because grid limits, site density and network coverage vary by country. Full coverage spans North America, Latin America, Western Europe, Eastern Europe, East Asia, South Asia & Pacific, Middle East & Africa.
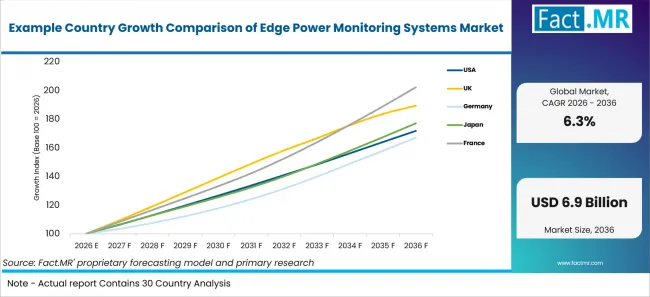
Example Country Growth Comparison Of Edge Power Monitoring Systems Market | Source: Fact.MR
| Country | CAGR (2026-2036) |
|---|---|
| France | 7.3% |
| United Kingdom | 6.6% |
| Japan | 5.9% |
| United States | 5.6% |
| Germany | 5.3% |
Source: Fact.MR analysis. Updated Oct 1, 2026
What is behind France's acceptance?
7.3% CAGR, supported by data-center load growth and dense digital systems.
Data centers and telecom networks in France need power monitoring for UPS systems and branch circuits. In December 2025, Arcep reported more than 68,000 5G sites were running in metropolitan France as of September 30, 2025. As the mobile network grows, more remote sites need local power monitoring.
How is the United Kingdom developing demand?
United Kingdom is expected to grow 6.6% CAGR, as data-center electricity use and wider high-speed connectivity increases.
UK adds more power needs as data centers and remote digital location grows. In March 2026, the Department for Energy Security and Net Zero said the waiting list for new transmission connections had increased by 460% in the six months to June 2025. As large sites use more power, operators need clear power data for both planning and daily work.
How does Japan perform?
5.9% CAGR, led by joint planning for power and network systems that support digital services.
Japan’s need simple tools to check their power use across data centers, telecom sites, and industrial systems. In September 2026, the Statistics Bureau of Japan reported that sales of information and communication services increased by 6.4% from a year earlier in July 2026.
What supports USA adoption?
USA holds 5.6% CAGR from 2026 to 2036.
Sales in the USA are increasing the need of monitor power use at branches and UPS systems. In May 2026, the U.S. Energy Information Administration reported that servers alone used an estimated 7% of commercial-sector electricity in 2025.
What is supporting Germany adoption?
5.3% CAGR, backed by broad 5G coverage and a large digital-services base.
Facility teams in Germany can use local monitoring check the power change comes from their site or from other power network. This creates a need to check panels and power quality near the equipment. Germany also has a large power system. Destatis reported in March 2026 that 438.2 billion kWh of electricity was generated and fed into the grid in 2025.
Who leads the Edge Power Monitoring Systems Market?
Schneider Electric offers PowerLogic meters and electrical equipment along with EcoStruxure Power Monitoring Expert to check and study power systems. Eaton covers a wider mix of power equipment through Power Xpert, UPS systems and digital management tools. Vertiv focuses on rack power monitoring. Its software can track power from the main utility supply through the UPS and other equipment to each rack. Siemens, ABB, and Socomec also offer meters, electrical equipment, power-quality monitoring, and digital tools for sites where a steady power supply is important.
Eaton introduced a new solution in September to find power changes which link with a heavy AI use. It was added through a firmware update to the Power Xpert Quality event analysis system. In November, Siemens and Delta announced ready-made modular power systems for data centers. Siemens said this plug-and-play setup can cut time to market by up to 50%. During the same month, ABB announced plans to supply VoltaGrid with 27 synchronous condensers and prefabricated eHouse units to help provide stable power for U.S. data centers.
Which companies are the key providers?
Key companies include Schneider Electric; Eaton; Vertiv; Siemens; ABB; and Socomec.
- Schneider Electric
- Eaton
- Vertiv
- Siemens
- ABB
- Socomec
Bibliography
- Smith, S. J., Hubbard, A., Newkirk, A., Ganeshalingam, M., Holecek, B., Sartor, D. A., Mills, M., & Shehabi, A. (2026, June). United States Data Center Energy Usage Report: 2025 update. Lawrence Berkeley National Laboratory.
- Ofcom. (2025, November 19). Connected Nations 2025.
- Bundesnetzagentur. (2025, December 15). Bundesnetzagentur publishes latest figures from mobile communications monitoring.
- RTE. (2026, February 25). Bilan électrique 2025 : La consommation.
- Arcep. (2025, December 11). Couverture mobile.
- Department for Energy Security and Net Zero, Department for Science, Innovation and Technology, National Energy System Operator, & Ofgem. (2026, March 11). Government to tackle speculative demand grid connection requests.
- U.S. Energy Information Administration. (2026, May 19). Data center server energy use grows across the commercial building stock.
- Statistisches Bundesamt (Destatis). (2026, March 6). Stromerzeugung aus Photovoltaik und Erdgas erreicht im Jahr 2025 neue Höchstwerte [Electricity generation from photovoltaics and natural gas reached new highs in 2025].
- Vertiv. (2025, March 18). New Vertiv software strengthens visibility and control of the complete power train and thermal chain for colocation and hyperscale data centers.
- Eaton. (2025, September 9). Eaton delivers edge-based innovation to help mitigate the impact of AI power bursting on both data centers and the grid.
- Siemens AG. (2025, November 19). Siemens and Delta power solutions cut data center deployment time, costs, and carbon emissions.
- ABB. (2025, November 10). ABB and VoltaGrid partner to deliver stable data center power to support AI growth.
This Report Answers
- The report explains where edge power monitoring is used across branch circuits, rack PDUs, panels, UPS systems and facility feeders.
- Segment analysis identifies the leading measurement, metric, compute and site groups.
- Country analysis compares France, the United Kingdom, Japan, the United States and Germany using the five country CAGRs and current official infrastructure data.
- Competitive analysis reviews Schneider Electric, Eaton, Vertiv, Siemens, ABB and Socomec across metering, power distribution, critical power and monitoring tools.
- Application analysis considers how dense data centers, telecom-edge growth, industrial loads, remote operations and microgrids change power-monitoring needs.
What does the Edge Power Monitoring Systems Market cover?
The Edge Power Monitoring Systems Market covers power-monitoring systems placed close to edge compute and operating loads. The scope includes meters, intelligent PDUs, panel devices, UPS monitoring, gateways and software that collect power, energy, power-quality, thermal or load data at the edge.
The assessment includes data-center, telecom, industrial, retail or branch and microgrid sites. It covers built-in metering and both local and cloud-linked analysis when power monitoring is a core system function.
What is included in the scope?
The scope includes branch and rack monitoring used in data-center power systems. Smart distribution is included for edge units when metering is part of the product. Local and cloud-linked systems are included when they analyze measured power data.
Related coverage includes power-monitoring solutions that use power data from remote sites. Energy-intelligence tools are included when they use the same measured power data. Utility energy analysis is covered where site-level power measurement is part of the workflow.
What is excluded from the scope?
The scope excludes distribution hardware without monitoring, general building automation without useful power measurement, and utility-scale grid monitoring outside edge sites. Pure cooling products are excluded, although related cooling systems can use the same site-level power data.
The report excludes complete data centers, server rack systems and mini data centers when monitoring sits outside the edge power function. Standalone modular UPS systems also remain outside the scope when edge monitoring is absent.
How Was the Analysis Built?
The analysis draws on 120+ sources, 35+ company portfolios, 25+ countries, and more than 20 industry interviews.
- Primary Research: Primary research includes discussions with manufacturers, service providers, technology developers, distributors, end users, and subject-matter experts. These conversations examine purchasing priorities, product adoption, operational challenges, approval requirements, competitive positioning, and the factors that influence wider market acceptance.
- Desk Research: Desk research covers government statistics, regulatory publications, company filings, trade data, technical studies, industry associations, standards, public policy, and other authoritative sources. Every source used in the analysis is documented in the bibliography.
- Market Sizing and Forecasting: Market estimates combine historical performance, demand indicators, pricing and volume trends, segment shares, company participation, country-level growth, adoption patterns, investment activity, and barriers to market expansion.
- Data Validation and Update Cycle: Findings are validated by comparing primary interviews with public data, company activity, regulatory changes, trade patterns, and industry developments. Regular updates review new product launches, capacity changes, partnerships, approvals, and shifts in commercial adoption.
Segmentation
What is the report’s scope and coverage?
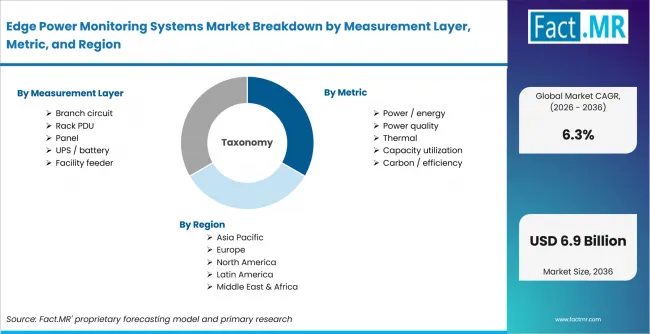
Edge Power Monitoring Systems Market Breakdown By Measurement Layer, Metric, And Region | Source: Fact.MR
| Attribute | Details |
|---|---|
| Quantitative Units | USD billion |
| Market Definition | Hardware and software systems that measure, aggregate and analyze electrical conditions close to distributed compute or operating loads, including branch, rack, panel, UPS and feeder monitoring used at data-center, telecom, industrial, retail and microgrid edge sites. |
| Measurement Layer | Branch circuit; Rack PDU; Panel; UPS / battery; Facility feeder |
| Metric | Power / energy; Power quality; Thermal; Capacity utilization; Carbon / efficiency |
| Compute | Embedded meter; Edge gateway; Local analytics; Cloud-connected edge; AI anomaly detection |
| Site | Data center; Telecom edge; Industrial edge; Retail / branch; Microgrid |
| Regions Covered | North America; Latin America; Western Europe; Eastern Europe; East Asia; South Asia & Pacific; Middle East & Africa |
| Countries Covered | France; United Kingdom; Japan; United States; Germany |
| Key Companies Profiled | Schneider Electric; Eaton; Vertiv; Siemens; ABB; Socomec |
| Forecast Period | 2026 to 2036 |
| Approach | Hybrid top-down and bottom-up approach using monitored electrical layers, edge-site deployment, power-equipment portfolios, connectivity trends, data-center electricity indicators and country-level infrastructure evidence. |
Source: Fact.MR analysis. Updated Oct 1, 2026
How is the market segmented?
-
By Measurement Layer:
- Branch circuit
- Rack PDU
- Panel
- UPS / battery
- Facility feeder
-
By Metric:
- Power / energy
- Power quality
- Thermal
- Capacity utilization
- Carbon / efficiency
-
By Compute:
- Embedded meter
- Edge gateway
- Local analytics
- Cloud-connected edge
- AI anomaly detection
-
By Site:
- Data center
- Telecom edge
- Industrial edge
- Retail / branch
- Microgrid
-
By Region:
- North America
- Latin America
- Western Europe
- Eastern Europe
- East Asia
- South Asia & Pacific
- Middle East & Africa
Frequently Asked Questions
How big is the edge power monitoring systems market in 2026?
What is the CAGR of the edge power monitoring systems market from 2026 to 2036?
Which metric leads the edge power monitoring systems market?
Which compute category leads the edge power monitoring systems market?
Who are the leading companies in the edge power monitoring systems market?
Who worked on this report


Preview the report firsthand - request a free sample
Free SampleGet the brochure for pricing and purchase details
Download PDF