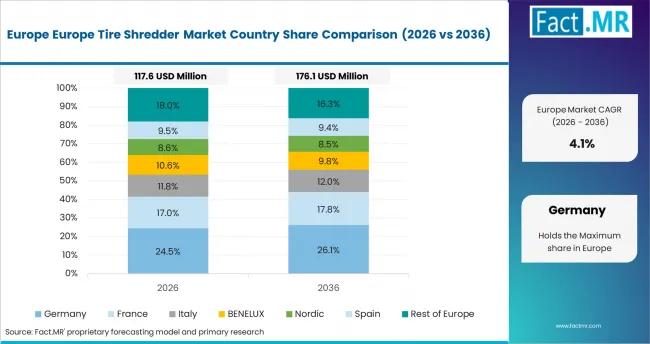
Europe Tire Shredder Market (2026 - 2036)
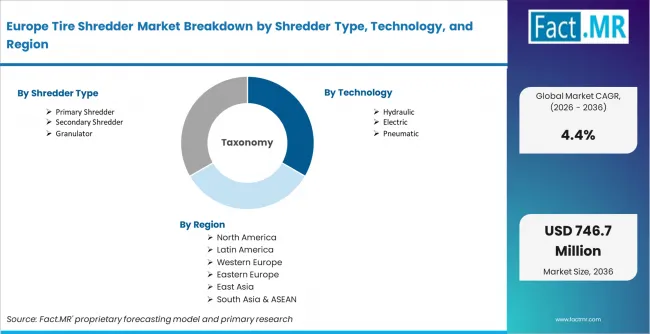
The Europe Tire Shredder Market is segmented by Shredder Type (Primary Shredder, Secondary Shredder, Granulator), Technology (Hydraulic, Electric, Pneumatic), Capacity, End User ,Sales Channel, and Country. Forecast for 2026 to 2036.
Fact.MR states that Europe tire shredder demand is moving through tire recycling facilities and waste management operations. Recycling operators and tire processors need shredders that can reduce whole tires into usable chips or feedstock for downstream recovery.
Europe Tire Shredder Market Size, Market Forecast and Outlook by Fact.MR
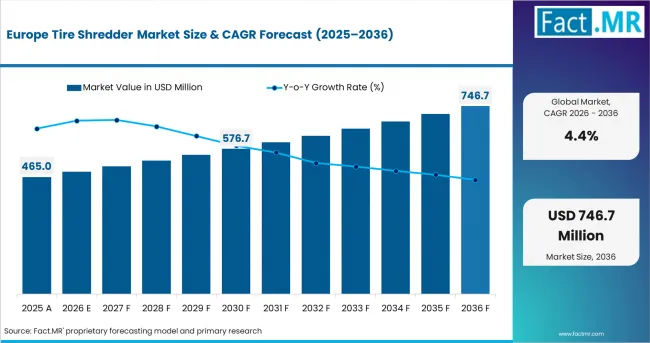
- The Europe tire shredder market was valued at USD 465.0 million in 2025.
- Demand is estimated to reach USD 485.5 million in 2026.
- The market is projected to record 4.4% CAGR from 2026 to 2036, reaching USD 746.7 million by 2036 as tire recycling capacity expands and hydraulic equipment adoption rises.
| Metric | Details |
|---|---|
| Industry Size (2026) | USD 485.5 million |
| Industry Value (2036) | USD 746.7 million |
| CAGR (2026 to 2036) | 4.4% |
Summary of Europe Tire Shredder Market
- Market Definition
- The Europe tire shredder market covers equipment that reduces end-of-life tires into smaller outputs for recycling and downstream material recovery. Demand is tied to tire waste regulation and the need for consistent pre-processing before separation or granulation.
- Demand Drivers in the Market
- Tire Recovery Pressure: Recycling facilities need shredders that can prepare whole tires for steel recovery and crumb production as Europe expands circular rubber use.
- Initial Size Reduction: Tire recyclers need primary shredders before granulation or material separation. The first cut determines feed consistency for steel removal and rubber crumb production. Equipment that handles whole tires with fewer jams can improve throughput across plants processing passenger car and commercial tire streams.
- Durable Processing: Reinforced rubber and steel wire create high wear inside shredding systems. Heavy-duty cutter design and wear protection help recyclers process mixed tire streams more reliably before magnetic separation and granule production.
- Key Segments Analyzed
- By Shredder Type: Primary Shredder systems are projected to hold 48.6% share in 2026 because tire recycling lines need initial size reduction before secondary shredding and granulation.
- By Technology: Hydraulic systems lead with 52.7% share in 2026 because heavy-duty tire processing needs high cutting force and reliable power delivery.
- By Capacity: 1000 to 3000 Kg/H systems are forecast to represent 43.5% share in 2026 because medium-capacity plants need throughput with operating flexibility.
- By End User: Recycling Facilities lead with 56.8% share in 2026 because tire collection and recovery are concentrated in dedicated recycling sites.
- By Sales Channel: Direct Sales are projected to hold 44.0% share in 2026 because tire shredder projects need feed testing and installation support.
- By Geography: Poland is projected to grow at 5.2% CAGR from 2026 to 2036 as tire recycling capacity and processing infrastructure expand.
- Analyst Opinion at Fact.MR
- Shambhu Nath Jha, Senior Analyst at Fact.MR, notes, “Europe tire shredder demand should be read through initial processing reliability. Recyclers need machines that can handle steel-reinforced rubber and steady daily intake. Suppliers that reduce blade wear and improve output consistency can protect repeat orders.”
- Strategic Implications
- Cutting Reliability: Shredder suppliers must improve blade durability and rotor design because whole tire processing creates heavy wear. Tire recyclers need fewer stoppages during primary size reduction. Machines with stronger cutters and easier blade access can protect throughput and reduce manual clearing.
- Output Control: Recycling facilities should match shredder type with target chip or granule size before investing. Poor sizing can reduce downstream recovery value because steel removal and crumb rubber lines depend on controlled feed. Suppliers that offer sizing trials and screen options can help operators improve material yield and reduce reprocessing cost.
- Service Coverage: Equipment producers need dependable space spare-part and maintenance support because tire shredding creates high wear and downtime risk. Fast access to cutters and wear plates helps recyclers keep lines running. Suppliers with regional service coverage can protect plant uptime and support repeat equipment orders across tire recycling facilities.
Primary shredding is the first equipment step in tire recycling plants. Tire shredding systems process tires from passenger cars and trucks, along with heavier tires from aircraft and mining equipment. Equipment selection depends on tire size, feed volume and the recovery route used after initial shredding.
Poland is forecast to reach 5.2% CAGR from 2026 to 2036 as recycling infrastructure and tire processing capacity expand. Germany is likely to record 4.8% CAGR by 2036 as established recycling systems support equipment replacement. France follows at 4.6% CAGR as circular economy programs increase the need for tire shredding systems. Netherlands is expected to post 4.5% CAGR through recyclers improve tire processing efficiency. Italy tracks 4.3% CAGR as tire recycling capacity improves across processing sites. Spain records 4.1% CAGR as waste management system modernize. United Kingdom demand is likely to rise at 3.9% CAGR as compliance driven tire processing supports steady equipment replacement.
Segmental Analysis
Europe Tire Shredder Market Analysis by Shredder Type
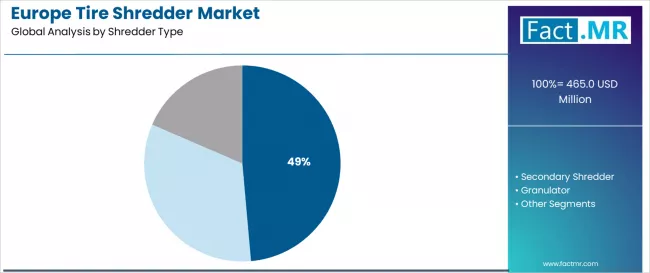
Primary Shredder systems are projected to hold 48.6% share in 2026 because tire recycling lines need a reliable first size reduction step. These machines break whole tires into manageable shreds before steel separation or tire-derived fuel preparation. Their lead position is tied to the need for steady input size at the start of recycling line.
- Initial Reduction: Primary Shredders prepare whole tires for downstream recovery. Recycling operators need reliable first-pass size control.
- Processing Flow: Primary shredding supports granulation and separation. Stable feed size helps downstream machines work with fewer interruptions.
- Heavy Input: Primary units handle reinforced tire structures. Operators need equipment that can process car and truck tires consistently.
Europe Tire Shredder Market Analysis by Technology
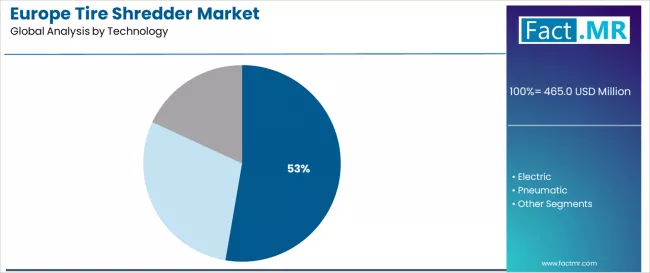
Hydraulic technology leads because tire shredders need high cutting force for reinforced rubber and steel bead wire. Hydraulic systems are projected to hold 52.7% share in 2026. Hydraulic drives give operators steady torque and robust operation during variable feed loads. Their lead is supported by proven use in heavy recycling equipment and familiar maintenance practices across tire recycling plants .
- Power Delivery: Hydraulic systems support heavy cutting loads. Tire processors need reliable force for steel-reinforced tires.
- Operating Confidence: Hydraulic platforms have established service familiarity. Maintenance crews can manage repairs with known components.
- Load Handling: Hydraulic systems support variable feed conditions. This helps operators process mixed tire sizes.
Europe Tire Shredder Market Analysis by Capacity
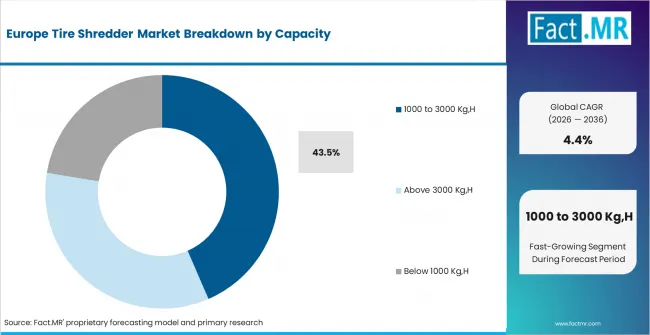
Medium-capacity systems in the 1,000 to 3,000 kg/h range are forecast to hold 43.5% share in 2026 because regional recycling plants need steady output without the cost of very large equipment. This capacity range suits facilities that process regular tire volumes from municipal collection and commercial recovery networks. It gives operators enough throughput for daily processing while keeping power use and maintenance manageable.
- Balanced Throughput: 1000 to 3000 Kg,H systems suit regional tire recyclers. The range supports steady processing without overbuilding capacity.
- Operating Flexibility: Medium-capacity systems can serve mixed tire streams. Operators can process passenger and truck tires with better scheduling control.
- Cost Discipline: Mid-range capacity reduces idle equipment risk. Recycling sites can match output with local tire collection volume.
Europe Tire Shredder Market Analysis by End User
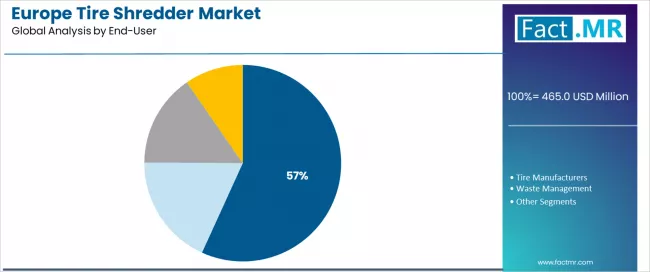
Recycling Facilities are projected to hold 56.8% share in 2026 because tire waste processing is concentrated in dedicated recovery plants. These sites need shredders that can convert tire waste into chips or feedstock for downstream use. EuRIC states that mechanical recycling recovers high-value tire materials for use across sports and automotive applications. [1]
- Recovery Focus: Recycling Facilities need steady tire size reduction. Shredding prepares rubber and textile streams for recovery.
- Output Value: Facility operators need consistent chips or granulate. Material quality affects downstream application value.
- Dedicated Intake: Recycling sites receive regular tire volumes. Stable intake supports investment in specialized shredding systems.
Europe Tire Shredder Market Analysis by Sales Channel
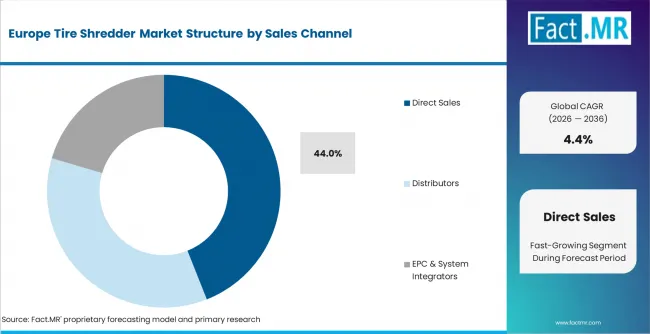
Direct sales are projected to hold 44.0% share in 2026 because tire shredder projects often need feed testing and commissioning support before purchase. Equipment suppliers must assess tire mix and the downstream recovery route before recommending the right shredder setup. Direct engagement gives recycling plants clearer responsibility from the supplier during installation. This helps reduce commissioning risk and align machines with tire-derived fuel or crumb rubber output goals.
- Specification Support: Direct Sales help recyclers match equipment with tire mix and output size. Technical checks reduce commissioning risk.
- Supplier Accountability: Direct relationships improve installation support. Operators need clear technical ownership during start-up.
- Service Planning: Direct engagement supports blade and rotor maintenance. Tire shredding creates high wear and service pressure.
Europe Tire Shredder Market Drivers, Restraints, and Opportunities
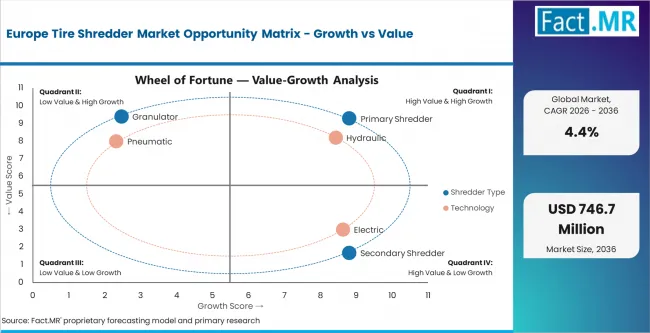
Circular economy policy is the key driver for Europe tire shredder demand. ETRMA states that tire recycling plays a vital role in Europe’s circular economy transition. [2] This supports demand for shredders that turn end-of-life tires into usable recovery materials.
High equipment cost and wear are the main restraints. Tire shredding exposes blades and rotors to reinforced rubber with steel wire. Operators may delay replacement if tire collection volumes are uncertain. Smaller recycling sites face capital pressure if granulate or tire-derived fuel prices weakens.
Opportunities in the Europe Tire Shredder Market
- Primary Shredding Lines: Recycling facilities can improve first-stage tire processing with primary shredders. Clean-cut shredder systems support car and truck tire chip production.
- Material Recovery: Recyclers can prepare rubber steel and textile streams for downstream use. Tire recovery depends on separating these materials for reuse.
- OTR Tire Processing: Mining and agricultural tires create demand for heavy-duty shredders. These tires need stronger cutting systems because of size weight and reinforced structure.
Regional Analysis
Based on country analysis, the Europe tire shredder market is segmented into Poland, Germany, France, Netherlands, Italy, Spain, United Kingdom, and Rest of Europe.
.webp)
| Country | CAGR (2026 to 2036) |
|---|---|
| Poland | 5.2% |
| Germany | 4.8% |
| France | 4.6% |
| Netherlands | 4.5% |
| Italy | 4.3% |
| Spain | 4.1% |
| United Kingdom | 3.9% |
Source: Fact.MR adjusted forecast model based on revised 2026 to 2036 assumptions.
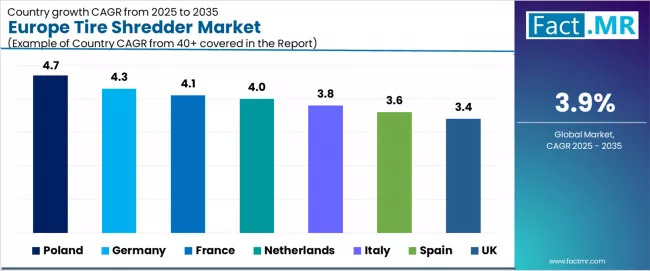
Europe Tire Shredder Market Analysis

- Poland: Poland is projected to grow at 5.2% CAGR from 2026 to 2036 because tire recovery capacity is expanding across regional processing sites. The country benefits from lower operating costs and rising waste management investment. Medium-capacity primary shredders will gain demand because recyclers need first-stage size reduction before granulation or tire-derived fuel preparation.
- Germany: Germany’s tire shredder demand is supported by recycling technology depth and established industrial processing systems. The country is projected to grow at 4.8% CAGR by 2036 as operators replace older machines and improve output control. Demand will favor durable shredders that can handle mixed passenger and truck tire streams with less downtime.
- France: Circular economy programs and tire recovery systems support shredder purchases in France. The country is projected to record 4.6% CAGR during the 2026 to 2036 period. Recycling operators need machines that prepare end-of-life tires for granulation or energy recovery. Demand will favor primary shredders with stable cutting performance and reliable service access.
- Netherlands: Netherlands tire shredder demand is expected to post 4.5% CAGR from 2026 to 2036 as compact waste logistics and recycling optimization support equipment use. Tire processors need shredders that can handle steady inflows and deliver consistent feed for separation and granulation. Direct supplier support will help facilities reduce downtime and improve output quality.
- Italy: Italy is projected to grow at 4.3% CAGR through 2036 as tire processors are improving processing capacity. The country has an established tire manufacturing and recycling base that supports replacement demand. Equipment purchases will favor shredders that can manage passenger and truck tire with stable output quality and manageable service cost.
- Spain: Spain is expected to grow at 4.1% CAGR as waste management modernization supports tire recycling projects. Regional facilities need machines that convert end-of-life tires into chips or feedstock for material recovery. Operators will assess shredders through blade life and service access, especially in dense urban and logistics corridors.
- United Kingdom: United Kingdom demand is anticipated to rise at 3.9% CAGR by 2036 because demand is mainly tied to machine replacement and regulated tire waste handling. The country already has established recycling sites, so growth is slower than Poland and Germany. Operators will need shredders for first-stage size reduction before rubber recovery or tire-derived fuel preparation. Suppliers with local maintenance support can gain replacement orders because downtime directly affects plant economics.
Competitive Aligners for Market Players
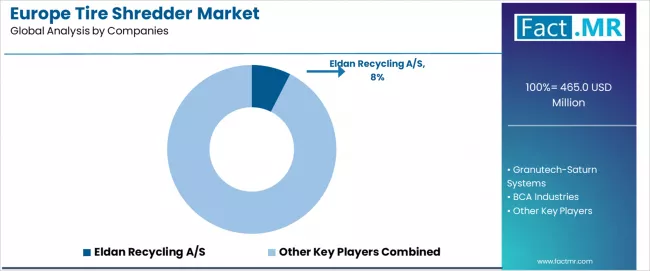
The Europe tire shredder market includes specialized recycling equipment producers, industrial shredder manufacturers, and tire processing system suppliers. Tire recycling plants use these systems to produce tire chips and rubber granulate from whole tires, pre-cut tires, or tire shreds. Suppliers compete on output control, equipment durability, and service support.
Competitive positioning depends on processing reliability. Tire shredding systems must handle passenger car tires, truck tires, OTR tires, agricultural tires, aircraft tires, and mining equipment tires. Turnkey tire recycling systems support scrap tire processors that need shredding and separation in one processing line. Recycling operators need machines that can process mixed tire streams with lower blade wear.
Supplier position will depend on system integration through 2036. Primary shredders must connect smoothly with secondary shredding and output handling systems. Equipment producers that support feed testing and maintenance can secure repeat demand from recycling facilities and waste management operators.
Key Players in Europe Tire Shredder Market
- Eldan Recycling A,S
- Granutech-Saturn Systems
- BCA Industries
- ECO Green Equipment
- WEIMA Maschinenbau GmbH
- Barclay Recycling
- Forrec s.r.l.
- UNTHA Shredding Technology
- SSI Shredding Systems
Bibliography
- [1]. European Recycling Industries’ Confederation. (2025). 2024 EuRIC Annual Report. EuRIC.
- [2]. European Tyre and Rubber Manufacturers’ Association. (2025, June 13). End-of-life tyres in a circular economy. Tyres Europe.
- [3] European Commission, Directorate-General for Environment. (2025, October 16). Revised Waste Framework Directive enters into force. European Commission.
- [4] European Recycling Industries’ Confederation, & European Tyre and Rubber Manufacturers’ Association. (2025, July 9). Harmonised end-of-waste criteria: A key step to strengthening Europe’s tyre recycling market.
This Report Addresses
- Strategic intelligence on Europe tire shredder demand across recycling facilities and waste management operations.
- Adjusted 2026 to 2036 forecast based on the Fact.MR public baseline.
- Segment analysis by shredder type, technology, capacity, end user, and sales channel.
- Country outlook across Poland, Germany, France, Netherlands, Italy, Spain, and the United Kingdom.
- Competitive analysis of Eldan Recycling, Granutech-Saturn Systems, ECO Green Equipment, UNTHA, and SSI Shredding Systems.
- Product assessment covering primary shredders, hydraulic systems, and medium-capacity processing lines.
- Source-backed review of tire recycling policy, ELT material recovery, and supplier equipment positioning.
- Primary interviews, supplier checks, recycling facility review, and tire processing validation support the forecast.
Europe Tire Shredder Market Definition
The Europe tire shredder market covers machines used to cut and reduce end-of-life tires into chips or feedstock for material recovery and energy recovery. The market differs from general industrial shredders because tire processing requires heavy-duty cutting systems that can handle steel wire and mixed tire sizes.
Europe Tire Shredder Inclusions
The scope includes primary shredders and pneumatic shredders used in tire recycling facilities, and waste management operations. It includes equipment for passenger tires and OTR tires when the equipment is designed for tire size reduction.
Europe Tire Shredder Exclusions
The scope excludes general plastic shredders and tire collection vehicles. Pyrolysis reactors and steel separation systems are excluded unless supplied as part of an integrated tire shredding line. Finished crumb rubber and tire-derived fuel are outside scope.
Europe Tire Shredder Research Methodology
- Primary Research
- Primary research includes interviews with tire recycling facility managers and waste management operators. Tire processing engineers and equipment integrators are covered separately. Supplier feedback supports shredder type and end-user checks.
- Desk Research
- Desk research reviews tire recovery policy references and supplier portfolios. Application data is compared with tire chips and material recovery needs.
- Market-Sizing and Forecasting
- Forecasting uses shredder type demand and sales channel checks. Primary shredder and hydraulic system demand are tied to whole tire intake and initial size reduction.
- Data Validation and Update Cycle
- Forecasts are validated through supplier checks and recycling facility interviews. Country assumptions are reviewed with tire recovery activity and recycling infrastructure signals.
Scope of the Report

| Attribute | Details |
| Quantitative Units | USD 485.5 million in 2026 to USD 746.7 million by 2036 at 4.4% CAGR |
| Market Definition | Tire shredders used to reduce end-of-life tires into chips, shreds, granules, or feedstock for recovery. |
| Shredder Type | Primary Shredder, Secondary Shredder, Granulator |
| Technology | Hydraulic, Electric, Pneumatic |
| Capacity | Below 1000 Kg,H, 1000 to 3000 Kg,H, Above 3000 Kg,H |
| End User | Recycling Facilities, Tire Manufacturers, Waste Management, Others |
| Sales Channel | Direct Sales, Distributors, EPC & System Integrators, Service & Retrofit |
| Countries Covered | Poland, Germany, France, Netherlands, Italy, Spain, United Kingdom, Rest of Europe |
| Key Companies Profiled | Eldan Recycling A,S, Granutech-Saturn Systems, BCA Industries, ECO Green Equipment, WEIMA Maschinenbau GmbH, UNTHA Shredding Technology, SSI Shredding Systems |
| Forecast Period | 2026 to 2036 |
| Approach | Adjusted top-down and bottom-up model using shredder type, technology, capacity, end-user demand, sales route, and country validation. |
Europe Tire Shredder Market Analysis by Segments
-
By Shredder Type:
- Primary Shredder
- Secondary Shredder
- Granulator
-
By Technology:
- Hydraulic
- Electric
- Pneumatic
-
By Capacity:
- Below 1000 Kg,H
- 1000 to 3000 Kg,H
- Above 3000 Kg,H
-
By End User:
- Recycling Facilities
- Tire Manufacturers
- Waste Management
- Others
-
By Sales Channel:
- Direct Sales
- Distributors
- EPC & System Integrators
- Service & Retrofit
-
By Country:
- Poland
- Germany
- France
- Netherlands
- Italy
- Spain
- United Kingdom
- Rest of Europe
- Frequently Asked Questions -
How large is the Europe tire shredder market in 2025?
The Europe tire shredder market was valued at USD 465.0 million in 2025 based on the Fact.MR public baseline.
What is the expected value of the Europe tire shredder market in 2026?
The Europe tire shredder market is estimated to reach USD 485.5 million in 2026 through recycling facility demand.
What is the forecast value of the Europe tire shredder market by 2036?
The Europe tire shredder market is forecast to reach USD 746.7 million by 2036 as tire recycling capacity expands.
What CAGR is projected for the Europe tire shredder market from 2026 to 2036?
Fact.MR’s adjusted forecast projects 4.4% CAGR for the Europe tire shredder market from 2026 to 2036.
Which shredder type leads the Europe tire shredder market?
Primary Shredder systems lead with 48.6% share in 2026 because tire lines need initial size reduction.
Why do Primary Shredders lead Europe tire shredder demand?
Primary Shredders lead because whole tires must be reduced before granulation, separation, or fuel preparation.
Which technology leads the Europe tire shredder market?
Hydraulic technology leads with 52.7% share in 2026 because heavy-duty tire processing needs high force delivery.
Which capacity leads the Europe tire shredder market?
1000 to 3000 Kg,H systems lead with 43.5% share in 2026 because regional plants need balanced throughput.
Which end user leads the Europe tire shredder market?
Recycling Facilities lead with 56.8% share in 2026 because tire recovery is concentrated in dedicated processing sites.
Which sales channel leads the Europe tire shredder market?
Direct Sales lead with 44.0% share in 2026 because shredder projects need feed testing and installation support.
Which country grows fastest in the Europe tire shredder market?
Poland grows fastest at 5.2% CAGR from 2026 to 2036 due to recycling infrastructure expansion.
Why is Germany important in the Europe tire shredder market?
Germany is important because recycling technology depth and established processing systems support steady equipment replacement.
Why is the Netherlands important in the Europe tire shredder market?
The Netherlands is important because compact waste logistics and recycling optimization support efficient tire processing.
Which companies compete in the Europe tire shredder market?
Eldan Recycling, Granutech-Saturn Systems, ECO Green Equipment, UNTHA, WEIMA, and SSI Shredding Systems compete in this market.
What drives Europe tire shredder market growth?
End-of-life tire recovery drives growth because recyclers need equipment that prepares tires for material recovery.
What restrains Europe tire shredder market growth?
High equipment cost and blade wear restrain growth because steel-reinforced tires create heavy processing stress.
How do tire shredders support material recovery?
Tire shredders reduce whole tires into chips or shreds that can enter granulation, steel separation, or recovery lines.
How do tire shredders support tire-derived fuel production?
Tire shredders prepare controlled chip sizes that can be used as tire-derived fuel in selected industrial applications.
What is included in the Europe tire shredder market scope?
The scope includes primary shredders, secondary shredders, granulators, hydraulic systems, electric systems, and tire processing lines.
What is excluded from the Europe tire shredder market scope?
The scope excludes general plastic shredders, metal-only shredders, crumb rubber mills, pyrolysis reactors, and tire collection vehicles.
How does Fact.MR forecast Europe tire shredder demand?
Fact.MR forecasts demand using shredder type, technology, capacity, end-user demand, sales route, and country validation.
Table of Content
- Executive Summary
- Global Market Outlook
- Demand to side Trends
- Supply to side Trends
- Technology Roadmap Analysis
- Analysis and Recommendations
- Market Overview
- Market Coverage / Taxonomy
- Market Definition / Scope / Limitations
- Research Methodology
- Chapter Orientation
- Analytical Lens and Working Hypotheses
- Market Structure, Signals, and Trend Drivers
- Benchmarking and Cross-market Comparability
- Market Sizing, Forecasting, and Opportunity Mapping
- Research Design and Evidence Framework
- Desk Research Programme (Secondary Evidence)
- Company Annual and Sustainability Reports
- Peer-reviewed Journals and Academic Literature
- Corporate Websites, Product Literature, and Technical Notes
- Earnings Decks and Investor Briefings
- Statutory Filings and Regulatory Disclosures
- Technical White Papers and Standards Notes
- Trade Journals, Industry Magazines, and Analyst Briefs
- Conference Proceedings, Webinars, and Seminar Materials
- Government Statistics Portals and Public Data Releases
- Press Releases and Reputable Media Coverage
- Specialist Newsletters and Curated Briefings
- Sector Databases and Reference Repositories
- Fact.MR Internal Proprietary Databases and Historical Market Datasets
- Subscription Datasets and Paid Sources
- Social Channels, Communities, and Digital Listening Inputs
- Additional Desk Sources
- Expert Input and Fieldwork (Primary Evidence)
- Primary Modes
- Qualitative Interviews and Expert Elicitation
- Quantitative Surveys and Structured Data Capture
- Blended Approach
- Why Primary Evidence is Used
- Field Techniques
- Interviews
- Surveys
- Focus Groups
- Observational and In-context Research
- Social and Community Interactions
- Stakeholder Universe Engaged
- C-suite Leaders
- Board Members
- Presidents and Vice Presidents
- R&D and Innovation Heads
- Technical Specialists
- Domain Subject-matter Experts
- Scientists
- Physicians and Other Healthcare Professionals
- Governance, Ethics, and Data Stewardship
- Research Ethics
- Data Integrity and Handling
- Primary Modes
- Tooling, Models, and Reference Databases
- Desk Research Programme (Secondary Evidence)
- Data Engineering and Model Build
- Data Acquisition and Ingestion
- Cleaning, Normalisation, and Verification
- Synthesis, Triangulation, and Analysis
- Quality Assurance and Audit Trail
- Market Background
- Market Dynamics
- Drivers
- Restraints
- Opportunity
- Trends
- Scenario Forecast
- Demand in Optimistic Scenario
- Demand in Likely Scenario
- Demand in Conservative Scenario
- Opportunity Map Analysis
- Product Life Cycle Analysis
- Supply Chain Analysis
- Investment Feasibility Matrix
- Value Chain Analysis
- PESTLE and Porter’s Analysis
- Regulatory Landscape
- Regional Parent Market Outlook
- Production and Consumption Statistics
- Import and Export Statistics
- Market Dynamics
- Global Market Analysis 2021 to 2025 and Forecast, 2026 to 2036
- Historical Market Size Value (USD Million) Analysis, 2021 to 2025
- Current and Future Market Size Value (USD Million) Projections, 2026 to 2036
- Y to o to Y Growth Trend Analysis
- Absolute $ Opportunity Analysis
- Global Market Pricing Analysis 2021 to 2025 and Forecast 2026 to 2036
- Global Market Analysis 2021 to 2025 and Forecast 2026 to 2036, By Shredder Type
- Introduction / Key Findings
- Historical Market Size Value (USD Million) Analysis By Shredder Type , 2021 to 2025
- Current and Future Market Size Value (USD Million) Analysis and Forecast By Shredder Type , 2026 to 2036
- Primary Shredder
- Secondary Shredder
- Granulator
- Primary Shredder
- Y to o to Y Growth Trend Analysis By Shredder Type , 2021 to 2025
- Absolute $ Opportunity Analysis By Shredder Type , 2026 to 2036
- Global Market Analysis 2021 to 2025 and Forecast 2026 to 2036, By Technology
- Introduction / Key Findings
- Historical Market Size Value (USD Million) Analysis By Technology, 2021 to 2025
- Current and Future Market Size Value (USD Million) Analysis and Forecast By Technology, 2026 to 2036
- Hydraulic
- Electric
- Pneumatic
- Hydraulic
- Y to o to Y Growth Trend Analysis By Technology, 2021 to 2025
- Absolute $ Opportunity Analysis By Technology, 2026 to 2036
- Global Market Analysis 2021 to 2025 and Forecast 2026 to 2036, By Capacity
- Introduction / Key Findings
- Historical Market Size Value (USD Million) Analysis By Capacity, 2021 to 2025
- Current and Future Market Size Value (USD Million) Analysis and Forecast By Capacity, 2026 to 2036
- 1000 to 3000 Kg,H
- Above 3000 Kg,H
- Below 1000 Kg,H
- 1000 to 3000 Kg,H
- Y to o to Y Growth Trend Analysis By Capacity, 2021 to 2025
- Absolute $ Opportunity Analysis By Capacity, 2026 to 2036
- Global Market Analysis 2021 to 2025 and Forecast 2026 to 2036, By End User
- Introduction / Key Findings
- Historical Market Size Value (USD Million) Analysis By End User, 2021 to 2025
- Current and Future Market Size Value (USD Million) Analysis and Forecast By End User, 2026 to 2036
- Recycling Facilities
- Tire Manufacturers
- Waste Management
- Others
- Recycling Facilities
- Y to o to Y Growth Trend Analysis By End User, 2021 to 2025
- Absolute $ Opportunity Analysis By End User, 2026 to 2036
- Global Market Analysis 2021 to 2025 and Forecast 2026 to 2036, By Sales Channel
- Introduction / Key Findings
- Historical Market Size Value (USD Million) Analysis By Sales Channel, 2021 to 2025
- Current and Future Market Size Value (USD Million) Analysis and Forecast By Sales Channel, 2026 to 2036
- Direct Sales
- Distributors
- EPC & System Integrators
- Service & Retrofit
- Direct Sales
- Y to o to Y Growth Trend Analysis By Sales Channel, 2021 to 2025
- Absolute $ Opportunity Analysis By Sales Channel, 2026 to 2036
- Global Market Analysis 2021 to 2025 and Forecast 2026 to 2036, By Region
- Introduction
- Historical Market Size Value (USD Million) Analysis By Region, 2021 to 2025
- Current Market Size Value (USD Million) Analysis and Forecast By Region, 2026 to 2036
- North America
- Latin America
- Western Europe
- Eastern Europe
- East Asia
- South Asia and Pacific
- Middle East & Africa
- Market Attractiveness Analysis By Region
- North America Market Analysis 2021 to 2025 and Forecast 2026 to 2036, By Country
- Historical Market Size Value (USD Million) Trend Analysis By Market Taxonomy, 2021 to 2025
- Market Size Value (USD Million) Forecast By Market Taxonomy, 2026 to 2036
- By Country
- USA
- Canada
- Mexico
- By Shredder Type
- By Technology
- By Capacity
- By End User
- By Sales Channel
- By Country
- Market Attractiveness Analysis
- By Country
- By Shredder Type
- By Technology
- By Capacity
- By End User
- By Sales Channel
- Key Takeaways
- Latin America Market Analysis 2021 to 2025 and Forecast 2026 to 2036, By Country
- Historical Market Size Value (USD Million) Trend Analysis By Market Taxonomy, 2021 to 2025
- Market Size Value (USD Million) Forecast By Market Taxonomy, 2026 to 2036
- By Country
- Brazil
- Chile
- Rest of Latin America
- By Shredder Type
- By Technology
- By Capacity
- By End User
- By Sales Channel
- By Country
- Market Attractiveness Analysis
- By Country
- By Shredder Type
- By Technology
- By Capacity
- By End User
- By Sales Channel
- Key Takeaways
- Western Europe Market Analysis 2021 to 2025 and Forecast 2026 to 2036, By Country
- Historical Market Size Value (USD Million) Trend Analysis By Market Taxonomy, 2021 to 2025
- Market Size Value (USD Million) Forecast By Market Taxonomy, 2026 to 2036
- By Country
- Germany
- UK
- Italy
- Spain
- France
- Nordic
- BENELUX
- Rest of Western Europe
- By Shredder Type
- By Technology
- By Capacity
- By End User
- By Sales Channel
- By Country
- Market Attractiveness Analysis
- By Country
- By Shredder Type
- By Technology
- By Capacity
- By End User
- By Sales Channel
- Key Takeaways
- Eastern Europe Market Analysis 2021 to 2025 and Forecast 2026 to 2036, By Country
- Historical Market Size Value (USD Million) Trend Analysis By Market Taxonomy, 2021 to 2025
- Market Size Value (USD Million) Forecast By Market Taxonomy, 2026 to 2036
- By Country
- Russia
- Poland
- Hungary
- Balkan & Baltic
- Rest of Eastern Europe
- By Shredder Type
- By Technology
- By Capacity
- By End User
- By Sales Channel
- By Country
- Market Attractiveness Analysis
- By Country
- By Shredder Type
- By Technology
- By Capacity
- By End User
- By Sales Channel
- Key Takeaways
- East Asia Market Analysis 2021 to 2025 and Forecast 2026 to 2036, By Country
- Historical Market Size Value (USD Million) Trend Analysis By Market Taxonomy, 2021 to 2025
- Market Size Value (USD Million) Forecast By Market Taxonomy, 2026 to 2036
- By Country
- China
- Japan
- South Korea
- By Shredder Type
- By Technology
- By Capacity
- By End User
- By Sales Channel
- By Country
- Market Attractiveness Analysis
- By Country
- By Shredder Type
- By Technology
- By Capacity
- By End User
- By Sales Channel
- Key Takeaways
- South Asia and Pacific Market Analysis 2021 to 2025 and Forecast 2026 to 2036, By Country
- Historical Market Size Value (USD Million) Trend Analysis By Market Taxonomy, 2021 to 2025
- Market Size Value (USD Million) Forecast By Market Taxonomy, 2026 to 2036
- By Country
- India
- ASEAN
- Australia & New Zealand
- Rest of South Asia and Pacific
- By Shredder Type
- By Technology
- By Capacity
- By End User
- By Sales Channel
- By Country
- Market Attractiveness Analysis
- By Country
- By Shredder Type
- By Technology
- By Capacity
- By End User
- By Sales Channel
- Key Takeaways
- Middle East & Africa Market Analysis 2021 to 2025 and Forecast 2026 to 2036, By Country
- Historical Market Size Value (USD Million) Trend Analysis By Market Taxonomy, 2021 to 2025
- Market Size Value (USD Million) Forecast By Market Taxonomy, 2026 to 2036
- By Country
- Kingdom of Saudi Arabia
- Other GCC Countries
- Turkiye
- South Africa
- Other African Union
- Rest of Middle East & Africa
- By Shredder Type
- By Technology
- By Capacity
- By End User
- By Sales Channel
- By Country
- Market Attractiveness Analysis
- By Country
- By Shredder Type
- By Technology
- By Capacity
- By End User
- By Sales Channel
- Key Takeaways
- Key Countries Market Analysis
- USA
- Pricing Analysis
- Market Share Analysis, 2025
- By Shredder Type
- By Technology
- By Capacity
- By End User
- By Sales Channel
- Canada
- Pricing Analysis
- Market Share Analysis, 2025
- By Shredder Type
- By Technology
- By Capacity
- By End User
- By Sales Channel
- Mexico
- Pricing Analysis
- Market Share Analysis, 2025
- By Shredder Type
- By Technology
- By Capacity
- By End User
- By Sales Channel
- Brazil
- Pricing Analysis
- Market Share Analysis, 2025
- By Shredder Type
- By Technology
- By Capacity
- By End User
- By Sales Channel
- Chile
- Pricing Analysis
- Market Share Analysis, 2025
- By Shredder Type
- By Technology
- By Capacity
- By End User
- By Sales Channel
- Germany
- Pricing Analysis
- Market Share Analysis, 2025
- By Shredder Type
- By Technology
- By Capacity
- By End User
- By Sales Channel
- UK
- Pricing Analysis
- Market Share Analysis, 2025
- By Shredder Type
- By Technology
- By Capacity
- By End User
- By Sales Channel
- Italy
- Pricing Analysis
- Market Share Analysis, 2025
- By Shredder Type
- By Technology
- By Capacity
- By End User
- By Sales Channel
- Spain
- Pricing Analysis
- Market Share Analysis, 2025
- By Shredder Type
- By Technology
- By Capacity
- By End User
- By Sales Channel
- France
- Pricing Analysis
- Market Share Analysis, 2025
- By Shredder Type
- By Technology
- By Capacity
- By End User
- By Sales Channel
- India
- Pricing Analysis
- Market Share Analysis, 2025
- By Shredder Type
- By Technology
- By Capacity
- By End User
- By Sales Channel
- ASEAN
- Pricing Analysis
- Market Share Analysis, 2025
- By Shredder Type
- By Technology
- By Capacity
- By End User
- By Sales Channel
- Australia & New Zealand
- Pricing Analysis
- Market Share Analysis, 2025
- By Shredder Type
- By Technology
- By Capacity
- By End User
- By Sales Channel
- China
- Pricing Analysis
- Market Share Analysis, 2025
- By Shredder Type
- By Technology
- By Capacity
- By End User
- By Sales Channel
- Japan
- Pricing Analysis
- Market Share Analysis, 2025
- By Shredder Type
- By Technology
- By Capacity
- By End User
- By Sales Channel
- South Korea
- Pricing Analysis
- Market Share Analysis, 2025
- By Shredder Type
- By Technology
- By Capacity
- By End User
- By Sales Channel
- Russia
- Pricing Analysis
- Market Share Analysis, 2025
- By Shredder Type
- By Technology
- By Capacity
- By End User
- By Sales Channel
- Poland
- Pricing Analysis
- Market Share Analysis, 2025
- By Shredder Type
- By Technology
- By Capacity
- By End User
- By Sales Channel
- Hungary
- Pricing Analysis
- Market Share Analysis, 2025
- By Shredder Type
- By Technology
- By Capacity
- By End User
- By Sales Channel
- Kingdom of Saudi Arabia
- Pricing Analysis
- Market Share Analysis, 2025
- By Shredder Type
- By Technology
- By Capacity
- By End User
- By Sales Channel
- Turkiye
- Pricing Analysis
- Market Share Analysis, 2025
- By Shredder Type
- By Technology
- By Capacity
- By End User
- By Sales Channel
- South Africa
- Pricing Analysis
- Market Share Analysis, 2025
- By Shredder Type
- By Technology
- By Capacity
- By End User
- By Sales Channel
- USA
- Market Structure Analysis
- Competition Dashboard
- Competition Benchmarking
- Market Share Analysis of Top Players
- By Regional
- By Shredder Type
- By Technology
- By Capacity
- By End User
- By Sales Channel
- Competition Analysis
- Competition Deep Dive
- Eldan Recycling A,S
- Overview
- Product Portfolio
- Profitability by Market Segments (Product/Age /Sales Channel/Region)
- Sales Footprint
- Strategy Overview
- Marketing Strategy
- Product Strategy
- Channel Strategy
- Granutech-Saturn Systems
- BCA Industries
- ECO Green Equipment
- WEIMA Maschinenbau GmbH
- Barclay Recycling
- Forrec s.r.l.
- UNTHA Shredding Technology
- SSI Shredding Systems
- Eldan Recycling A,S
- Competition Deep Dive
- Assumptions & Acronyms Used
List Of Table
- Table 1: Global Market Value (USD Million) Forecast by Region, 2021 to 2036
- Table 2: Global Market Value (USD Million) Forecast by Shredder Type, 2021 to 2036
- Table 3: Global Market Value (USD Million) Forecast by Technology, 2021 to 2036
- Table 4: Global Market Value (USD Million) Forecast by Capacity, 2021 to 2036
- Table 5: Global Market Value (USD Million) Forecast by End User, 2021 to 2036
- Table 6: Global Market Value (USD Million) Forecast by Sales Channel, 2021 to 2036
- Table 7: North America Market Value (USD Million) Forecast by Country, 2021 to 2036
- Table 8: North America Market Value (USD Million) Forecast by Shredder Type, 2021 to 2036
- Table 9: North America Market Value (USD Million) Forecast by Technology, 2021 to 2036
- Table 10: North America Market Value (USD Million) Forecast by Capacity, 2021 to 2036
- Table 11: North America Market Value (USD Million) Forecast by End User, 2021 to 2036
- Table 12: North America Market Value (USD Million) Forecast by Sales Channel, 2021 to 2036
- Table 13: Latin America Market Value (USD Million) Forecast by Country, 2021 to 2036
- Table 14: Latin America Market Value (USD Million) Forecast by Shredder Type, 2021 to 2036
- Table 15: Latin America Market Value (USD Million) Forecast by Technology, 2021 to 2036
- Table 16: Latin America Market Value (USD Million) Forecast by Capacity, 2021 to 2036
- Table 17: Latin America Market Value (USD Million) Forecast by End User, 2021 to 2036
- Table 18: Latin America Market Value (USD Million) Forecast by Sales Channel, 2021 to 2036
- Table 19: Western Europe Market Value (USD Million) Forecast by Country, 2021 to 2036
- Table 20: Western Europe Market Value (USD Million) Forecast by Shredder Type, 2021 to 2036
- Table 21: Western Europe Market Value (USD Million) Forecast by Technology, 2021 to 2036
- Table 22: Western Europe Market Value (USD Million) Forecast by Capacity, 2021 to 2036
- Table 23: Western Europe Market Value (USD Million) Forecast by End User, 2021 to 2036
- Table 24: Western Europe Market Value (USD Million) Forecast by Sales Channel, 2021 to 2036
- Table 25: Eastern Europe Market Value (USD Million) Forecast by Country, 2021 to 2036
- Table 26: Eastern Europe Market Value (USD Million) Forecast by Shredder Type, 2021 to 2036
- Table 27: Eastern Europe Market Value (USD Million) Forecast by Technology, 2021 to 2036
- Table 28: Eastern Europe Market Value (USD Million) Forecast by Capacity, 2021 to 2036
- Table 29: Eastern Europe Market Value (USD Million) Forecast by End User, 2021 to 2036
- Table 30: Eastern Europe Market Value (USD Million) Forecast by Sales Channel, 2021 to 2036
- Table 31: East Asia Market Value (USD Million) Forecast by Country, 2021 to 2036
- Table 32: East Asia Market Value (USD Million) Forecast by Shredder Type, 2021 to 2036
- Table 33: East Asia Market Value (USD Million) Forecast by Technology, 2021 to 2036
- Table 34: East Asia Market Value (USD Million) Forecast by Capacity, 2021 to 2036
- Table 35: East Asia Market Value (USD Million) Forecast by End User, 2021 to 2036
- Table 36: East Asia Market Value (USD Million) Forecast by Sales Channel, 2021 to 2036
- Table 37: South Asia and Pacific Market Value (USD Million) Forecast by Country, 2021 to 2036
- Table 38: South Asia and Pacific Market Value (USD Million) Forecast by Shredder Type, 2021 to 2036
- Table 39: South Asia and Pacific Market Value (USD Million) Forecast by Technology, 2021 to 2036
- Table 40: South Asia and Pacific Market Value (USD Million) Forecast by Capacity, 2021 to 2036
- Table 41: South Asia and Pacific Market Value (USD Million) Forecast by End User, 2021 to 2036
- Table 42: South Asia and Pacific Market Value (USD Million) Forecast by Sales Channel, 2021 to 2036
- Table 43: Middle East & Africa Market Value (USD Million) Forecast by Country, 2021 to 2036
- Table 44: Middle East & Africa Market Value (USD Million) Forecast by Shredder Type, 2021 to 2036
- Table 45: Middle East & Africa Market Value (USD Million) Forecast by Technology, 2021 to 2036
- Table 46: Middle East & Africa Market Value (USD Million) Forecast by Capacity, 2021 to 2036
- Table 47: Middle East & Africa Market Value (USD Million) Forecast by End User, 2021 to 2036
- Table 48: Middle East & Africa Market Value (USD Million) Forecast by Sales Channel, 2021 to 2036
List Of Figures
- Figure 1: Global Market Pricing Analysis
- Figure 2: Global Market Value (USD Million) Forecast 2021-2036
- Figure 3: Global Market Value Share and BPS Analysis by Shredder Type, 2026 and 2036
- Figure 4: Global Market Y-o-Y Growth Comparison by Shredder Type, 2026 to 2036
- Figure 5: Global Market Attractiveness Analysis by Shredder Type
- Figure 6: Global Market Value Share and BPS Analysis by Technology, 2026 and 2036
- Figure 7: Global Market Y-o-Y Growth Comparison by Technology, 2026 to 2036
- Figure 8: Global Market Attractiveness Analysis by Technology
- Figure 9: Global Market Value Share and BPS Analysis by Capacity, 2026 and 2036
- Figure 10: Global Market Y-o-Y Growth Comparison by Capacity, 2026 to 2036
- Figure 11: Global Market Attractiveness Analysis by Capacity
- Figure 12: Global Market Value Share and BPS Analysis by End User, 2026 and 2036
- Figure 13: Global Market Y-o-Y Growth Comparison by End User, 2026 to 2036
- Figure 14: Global Market Attractiveness Analysis by End User
- Figure 15: Global Market Value Share and BPS Analysis by Sales Channel, 2026 and 2036
- Figure 16: Global Market Y-o-Y Growth Comparison by Sales Channel, 2026 to 2036
- Figure 17: Global Market Attractiveness Analysis by Sales Channel
- Figure 18: Global Market Value (USD Million) Share and BPS Analysis by Region, 2026 and 2036
- Figure 19: Global Market Y-o-Y Growth Comparison by Region, 2026 to 2036
- Figure 20: Global Market Attractiveness Analysis by Region
- Figure 21: North America Market Incremental Dollar Opportunity, 2026 to 2036
- Figure 22: Latin America Market Incremental Dollar Opportunity, 2026 to 2036
- Figure 23: Western Europe Market Incremental Dollar Opportunity, 2026 to 2036
- Figure 24: Eastern Europe Market Incremental Dollar Opportunity, 2026 to 2036
- Figure 25: East Asia Market Incremental Dollar Opportunity, 2026 to 2036
- Figure 26: South Asia and Pacific Market Incremental Dollar Opportunity, 2026 to 2036
- Figure 27: Middle East & Africa Market Incremental Dollar Opportunity, 2026 to 2036
- Figure 28: North America Market Value Share and BPS Analysis by Country, 2026 and 2036
- Figure 29: North America Market Value Share and BPS Analysis by Shredder Type, 2026 and 2036
- Figure 30: North America Market Y-o-Y Growth Comparison by Shredder Type, 2026 to 2036
- Figure 31: North America Market Attractiveness Analysis by Shredder Type
- Figure 32: North America Market Value Share and BPS Analysis by Technology, 2026 and 2036
- Figure 33: North America Market Y-o-Y Growth Comparison by Technology, 2026 to 2036
- Figure 34: North America Market Attractiveness Analysis by Technology
- Figure 35: North America Market Value Share and BPS Analysis by Capacity, 2026 and 2036
- Figure 36: North America Market Y-o-Y Growth Comparison by Capacity, 2026 to 2036
- Figure 37: North America Market Attractiveness Analysis by Capacity
- Figure 38: North America Market Value Share and BPS Analysis by End User, 2026 and 2036
- Figure 39: North America Market Y-o-Y Growth Comparison by End User, 2026 to 2036
- Figure 40: North America Market Attractiveness Analysis by End User
- Figure 41: North America Market Value Share and BPS Analysis by Sales Channel, 2026 and 2036
- Figure 42: North America Market Y-o-Y Growth Comparison by Sales Channel, 2026 to 2036
- Figure 43: North America Market Attractiveness Analysis by Sales Channel
- Figure 44: Latin America Market Value Share and BPS Analysis by Country, 2026 and 2036
- Figure 45: Latin America Market Value Share and BPS Analysis by Shredder Type, 2026 and 2036
- Figure 46: Latin America Market Y-o-Y Growth Comparison by Shredder Type, 2026 to 2036
- Figure 47: Latin America Market Attractiveness Analysis by Shredder Type
- Figure 48: Latin America Market Value Share and BPS Analysis by Technology, 2026 and 2036
- Figure 49: Latin America Market Y-o-Y Growth Comparison by Technology, 2026 to 2036
- Figure 50: Latin America Market Attractiveness Analysis by Technology
- Figure 51: Latin America Market Value Share and BPS Analysis by Capacity, 2026 and 2036
- Figure 52: Latin America Market Y-o-Y Growth Comparison by Capacity, 2026 to 2036
- Figure 53: Latin America Market Attractiveness Analysis by Capacity
- Figure 54: Latin America Market Value Share and BPS Analysis by End User, 2026 and 2036
- Figure 55: Latin America Market Y-o-Y Growth Comparison by End User, 2026 to 2036
- Figure 56: Latin America Market Attractiveness Analysis by End User
- Figure 57: Latin America Market Value Share and BPS Analysis by Sales Channel, 2026 and 2036
- Figure 58: Latin America Market Y-o-Y Growth Comparison by Sales Channel, 2026 to 2036
- Figure 59: Latin America Market Attractiveness Analysis by Sales Channel
- Figure 60: Western Europe Market Value Share and BPS Analysis by Country, 2026 and 2036
- Figure 61: Western Europe Market Value Share and BPS Analysis by Shredder Type, 2026 and 2036
- Figure 62: Western Europe Market Y-o-Y Growth Comparison by Shredder Type, 2026 to 2036
- Figure 63: Western Europe Market Attractiveness Analysis by Shredder Type
- Figure 64: Western Europe Market Value Share and BPS Analysis by Technology, 2026 and 2036
- Figure 65: Western Europe Market Y-o-Y Growth Comparison by Technology, 2026 to 2036
- Figure 66: Western Europe Market Attractiveness Analysis by Technology
- Figure 67: Western Europe Market Value Share and BPS Analysis by Capacity, 2026 and 2036
- Figure 68: Western Europe Market Y-o-Y Growth Comparison by Capacity, 2026 to 2036
- Figure 69: Western Europe Market Attractiveness Analysis by Capacity
- Figure 70: Western Europe Market Value Share and BPS Analysis by End User, 2026 and 2036
- Figure 71: Western Europe Market Y-o-Y Growth Comparison by End User, 2026 to 2036
- Figure 72: Western Europe Market Attractiveness Analysis by End User
- Figure 73: Western Europe Market Value Share and BPS Analysis by Sales Channel, 2026 and 2036
- Figure 74: Western Europe Market Y-o-Y Growth Comparison by Sales Channel, 2026 to 2036
- Figure 75: Western Europe Market Attractiveness Analysis by Sales Channel
- Figure 76: Eastern Europe Market Value Share and BPS Analysis by Country, 2026 and 2036
- Figure 77: Eastern Europe Market Value Share and BPS Analysis by Shredder Type, 2026 and 2036
- Figure 78: Eastern Europe Market Y-o-Y Growth Comparison by Shredder Type, 2026 to 2036
- Figure 79: Eastern Europe Market Attractiveness Analysis by Shredder Type
- Figure 80: Eastern Europe Market Value Share and BPS Analysis by Technology, 2026 and 2036
- Figure 81: Eastern Europe Market Y-o-Y Growth Comparison by Technology, 2026 to 2036
- Figure 82: Eastern Europe Market Attractiveness Analysis by Technology
- Figure 83: Eastern Europe Market Value Share and BPS Analysis by Capacity, 2026 and 2036
- Figure 84: Eastern Europe Market Y-o-Y Growth Comparison by Capacity, 2026 to 2036
- Figure 85: Eastern Europe Market Attractiveness Analysis by Capacity
- Figure 86: Eastern Europe Market Value Share and BPS Analysis by End User, 2026 and 2036
- Figure 87: Eastern Europe Market Y-o-Y Growth Comparison by End User, 2026 to 2036
- Figure 88: Eastern Europe Market Attractiveness Analysis by End User
- Figure 89: Eastern Europe Market Value Share and BPS Analysis by Sales Channel, 2026 and 2036
- Figure 90: Eastern Europe Market Y-o-Y Growth Comparison by Sales Channel, 2026 to 2036
- Figure 91: Eastern Europe Market Attractiveness Analysis by Sales Channel
- Figure 92: East Asia Market Value Share and BPS Analysis by Country, 2026 and 2036
- Figure 93: East Asia Market Value Share and BPS Analysis by Shredder Type, 2026 and 2036
- Figure 94: East Asia Market Y-o-Y Growth Comparison by Shredder Type, 2026 to 2036
- Figure 95: East Asia Market Attractiveness Analysis by Shredder Type
- Figure 96: East Asia Market Value Share and BPS Analysis by Technology, 2026 and 2036
- Figure 97: East Asia Market Y-o-Y Growth Comparison by Technology, 2026 to 2036
- Figure 98: East Asia Market Attractiveness Analysis by Technology
- Figure 99: East Asia Market Value Share and BPS Analysis by Capacity, 2026 and 2036
- Figure 100: East Asia Market Y-o-Y Growth Comparison by Capacity, 2026 to 2036
- Figure 101: East Asia Market Attractiveness Analysis by Capacity
- Figure 102: East Asia Market Value Share and BPS Analysis by End User, 2026 and 2036
- Figure 103: East Asia Market Y-o-Y Growth Comparison by End User, 2026 to 2036
- Figure 104: East Asia Market Attractiveness Analysis by End User
- Figure 105: East Asia Market Value Share and BPS Analysis by Sales Channel, 2026 and 2036
- Figure 106: East Asia Market Y-o-Y Growth Comparison by Sales Channel, 2026 to 2036
- Figure 107: East Asia Market Attractiveness Analysis by Sales Channel
- Figure 108: South Asia and Pacific Market Value Share and BPS Analysis by Country, 2026 and 2036
- Figure 109: South Asia and Pacific Market Value Share and BPS Analysis by Shredder Type, 2026 and 2036
- Figure 110: South Asia and Pacific Market Y-o-Y Growth Comparison by Shredder Type, 2026 to 2036
- Figure 111: South Asia and Pacific Market Attractiveness Analysis by Shredder Type
- Figure 112: South Asia and Pacific Market Value Share and BPS Analysis by Technology, 2026 and 2036
- Figure 113: South Asia and Pacific Market Y-o-Y Growth Comparison by Technology, 2026 to 2036
- Figure 114: South Asia and Pacific Market Attractiveness Analysis by Technology
- Figure 115: South Asia and Pacific Market Value Share and BPS Analysis by Capacity, 2026 and 2036
- Figure 116: South Asia and Pacific Market Y-o-Y Growth Comparison by Capacity, 2026 to 2036
- Figure 117: South Asia and Pacific Market Attractiveness Analysis by Capacity
- Figure 118: South Asia and Pacific Market Value Share and BPS Analysis by End User, 2026 and 2036
- Figure 119: South Asia and Pacific Market Y-o-Y Growth Comparison by End User, 2026 to 2036
- Figure 120: South Asia and Pacific Market Attractiveness Analysis by End User
- Figure 121: South Asia and Pacific Market Value Share and BPS Analysis by Sales Channel, 2026 and 2036
- Figure 122: South Asia and Pacific Market Y-o-Y Growth Comparison by Sales Channel, 2026 to 2036
- Figure 123: South Asia and Pacific Market Attractiveness Analysis by Sales Channel
- Figure 124: Middle East & Africa Market Value Share and BPS Analysis by Country, 2026 and 2036
- Figure 125: Middle East & Africa Market Value Share and BPS Analysis by Shredder Type, 2026 and 2036
- Figure 126: Middle East & Africa Market Y-o-Y Growth Comparison by Shredder Type, 2026 to 2036
- Figure 127: Middle East & Africa Market Attractiveness Analysis by Shredder Type
- Figure 128: Middle East & Africa Market Value Share and BPS Analysis by Technology, 2026 and 2036
- Figure 129: Middle East & Africa Market Y-o-Y Growth Comparison by Technology, 2026 to 2036
- Figure 130: Middle East & Africa Market Attractiveness Analysis by Technology
- Figure 131: Middle East & Africa Market Value Share and BPS Analysis by Capacity, 2026 and 2036
- Figure 132: Middle East & Africa Market Y-o-Y Growth Comparison by Capacity, 2026 to 2036
- Figure 133: Middle East & Africa Market Attractiveness Analysis by Capacity
- Figure 134: Middle East & Africa Market Value Share and BPS Analysis by End User, 2026 and 2036
- Figure 135: Middle East & Africa Market Y-o-Y Growth Comparison by End User, 2026 to 2036
- Figure 136: Middle East & Africa Market Attractiveness Analysis by End User
- Figure 137: Middle East & Africa Market Value Share and BPS Analysis by Sales Channel, 2026 and 2036
- Figure 138: Middle East & Africa Market Y-o-Y Growth Comparison by Sales Channel, 2026 to 2036
- Figure 139: Middle East & Africa Market Attractiveness Analysis by Sales Channel
- Figure 140: Global Market - Tier Structure Analysis
- Figure 141: Global Market - Company Share Analysis