Europe Trash Compactor Market
Europe Trash Compactor Market Analysis, By Type, By Power Source, By Mechanism, By Waste Type, By Application, By End-Use, and Country - Market Insights 2025 to 2035
Analysis of Europe Trash Compactor Market Covering 30+ Countries Including Analysis of US, Canada, UK, Germany, France, Nordics, GCC countries, Japan, Korea and many more.
Europe Trash Compactor Market Outlook (2025 to 2035)
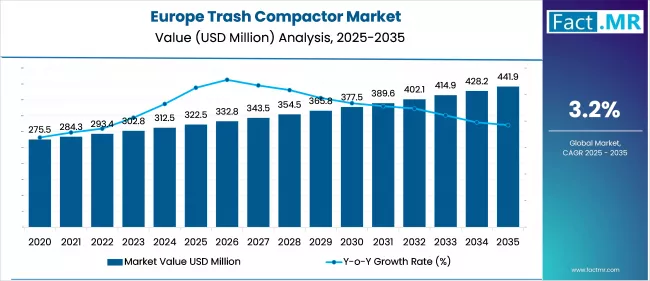
The Europe trash compactor market is projected to increase from USD 322.5 million in 2025 to USD 441.9 million by 2035, with a CAGR of 3.2% during the forecast period. Growing waste volumes, high landfill costs, and strict EU sustainability rules drive growth. There is a growing interest in smart, eco-friendly models, particularly for homes, businesses, and recycling, making the market ripe with new opportunities.
What are the Drivers of Europe Trash Compactor Market?
The European trash compactor market is supported by a solid manufacturing base, stringent environmental rules, and advanced recycling systems. Businesses and municipalities throughout the region are rapidly adopting smart, automated compactors as a means to lower disposal costs, reduce waste levels, and contribute to national sustainability objectives. People regard compacting solutions as crucial tools for enabling companies to achieve ESG goals and enhance operational efficiency.
Rapid urbanization and increasing waste generation in the U.K. are straining local waste management infrastructure even further. Consequently, both public and private businesses are investing in compactors to maximize space, simplify waste collection, and reduce reliance on landfills. Rising landfill levies and stricter environmental compliance standards are driving increased adoption in the commercial and residential sectors.
Furthermore, the Europe trash compactor market is driven by EU-aligned circular economy regulations, while France and Italy are also seeing consistent expansion. Rules like landfill bans and extended producer responsibility (EPR) are forcing companies to develop waste-reducing technologies, including compactors.
Public-private partnerships and government incentives that foster sustainable infrastructure help drive these initiatives. Meanwhile, in Southern and Eastern Europe, poor waste management and a lack of funds have slowed market uptake relatively. However, rising environmental awareness and increasing EU regulatory pressure are opening up new possibilities for compactor use in these developing areas, gradually.
What are the Country Trends of Europe Trash Compactor Market?
In Germany, factors such as strong dedication to environmental sustainability, modern waste infrastructure, and industrial maturity are expected to drive the country's growth during the forecast period. High-waste industries, such as manufacturing, logistics, and retail, have adopted intelligent and automated compactors. These systems help meet national goals of reducing reliance on landfills and align with circular economy principles. German companies are aggressively adopting technology-driven waste solutions to enhance efficiency and compliance with regulations.
In the UK, rising residential and commercial waste volumes, along with rapid urbanization, are driving demand for compactors. Tight municipal waste systems in large cities have prompted both the public and commercial sectors to invest in compactors as a cost-effective means of reducing disposal frequency, addressing space constraints, and improving urban cleanliness. Companies are utilizing compactors to meet sustainability requirements and enhance operational efficiency in space-constrained environments, particularly in retail and hospitality.
France remains committed to its EU circular economy goals, with the consistent rise in compactor usage reflecting this dedication. Encouraging broad implementation in both municipal and business environments, government rules stress recycling, source segregation, and landfill reduction. Together with growing sustainability objectives among companies, the legislative drive is aiding compactor systems to become a major component of national waste management plans.
What are the Challenges and Restraining Factors of Europe Trash Compactor Market?
A major problem for the European trash compactor industry is the high initial investment cost. Buying and installing advanced compactors, especially those with intelligent features, can be expensive. This poses a significant obstacle for local governments and small companies operating on limited budgets. The initial cost frequently postpones or hinders adoption even when obvious long-term savings and efficiency improvements are evident.
A lack of knowledge and understanding of contemporary waste management techniques is another obstacle. Many companies and institutions remain uncertain about the operation of garbage compactors and the benefits they may offer over time. Decision-makers may dismiss compactors as a practical solution without adequate training and exposure, thereby overlooking opportunities to reduce operating expenses and improve sustainability performance. Poor trash management systems in Southern and Eastern Europe exacerbate the difficulty.
The advantages of compactors are more difficult to see in areas where recycling systems and regular garbage collection are scarce. Although EU legislation and increasing environmental consciousness are gradually driving interest, this disconnect hinders market expansion in these areas.
Country-Wise Outlook
Germany Leads Europe’s Trash Compactor Market with Sustainability-Driven Innovation and Smart Waste Solutions
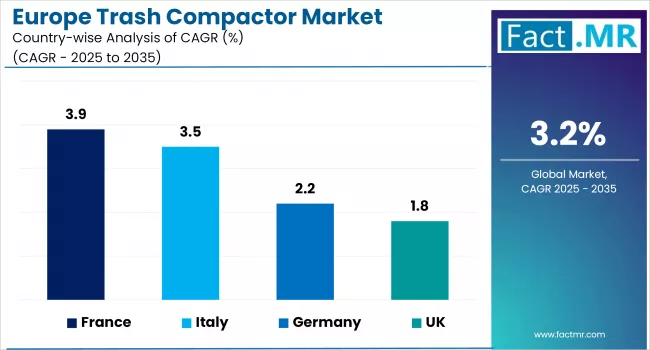
Driven by a deep-seated dedication to environmental sustainability and effective waste management, Germany's trash compactor sector is getting tremendous attention. The demand for dependable, space-saving, and reasonably priced waste management solutions has grown more pressing than ever as both industrial and civic sectors produce huge amounts of trash.
Companies across a variety of sectors, manufacturing, logistics, retail, and hospitality among them, are progressively using trash compactors to cut down the frequency of trash collection, save transportation costs, and improve operational space management. Particularly in urban areas with high population density, small and smart compactor solutions are seeing great demand as they address garbage fees and space restrictions.
The policy environment of Germany also serves as a strong development engine for this sector. Regulations like the Circular Economy Act call for strict waste prevention, separation, and recycling procedures, therefore pressure companies to use more environmentally friendly waste management techniques.
Adding to this, Germany's adherence to the EU Green Deal and severe enforcement of the Packaging Act further motivate the usage of compactors to more effectively handle packaging waste and recyclables. Also providing an environmentally responsible substitute for compactors are high landfill taxes and use limitations lowering trash bound for landfills.
Emerging technologies are accelerating this momentum. The market is increasingly demanding smart, solar-powered compactors equipped with IoT sensors, offering features such as automatic compaction cycles and real-time fill-level monitoring. Large-scale business and industrial consumers seeking high-tech solutions that align with their environmental objectives find particular appeal in these systems. Germany is emerging as a hub for cutting-edge, AI-driven waste management solutions, thanks to its robust innovation infrastructure and growing emphasis on ESG reporting.
Urban Waste Challenges and Green Regulations Drive Smart Compactor Adoption in the U.K.
Urbanization, limited space, and escalating landfill taxes are propelling quick growth in the U.K. trash compactor market. London, Birmingham, and Manchester, among other cities, are fighting rising amounts of household and business trash. By lowering collection frequency and shrinking the physical footprint of garbage, compactors provide a solution that directly helps companies and towns become cost-effective.
Prominent adopters include sectors like building, hospitality, healthcare, and retail. Specifically, the Environment Act 2021, a U.K. legislation, promotes sustainable waste management and underpins the Extended Producer Responsibility (EPR) programme. Companies are now expected to handle the waste they create more effectively, thereby motivating spending on waste reduction technology, including compactors. Furthermore, the U.K. government has implemented landfill restrictions on compostable municipal waste, making trash compaction a vital tool for compliance.
U.K. startups and waste-tech companies are exploring sensor-based compactors that initiate collection only when bins are full, enhancing operational efficiency and reducing fuel consumption.
France Accelerates Trash Compactor Adoption Through Circular Economy Laws and Urban Waste Innovation
Strict national regulations geared toward waste reduction and recycling are driving growth in the French trash compactor industry. French cities generate a significant amount of domestic and business waste; therefore, local authorities are under increasing pressure to handle it in an ecologically responsible manner. Particularly in retail, education, healthcare, and food services, companies are seeking to simplify waste collection and meet corporate sustainability objectives through the use of compactors.
France has implemented a progressive legal system, including the Anti-Waste and Circular Economy Law (AGEC Law), which aims to eliminate single-use plastics and promote eco-design in waste management systems. The government also forbids the landfilling of recyclables and requires sorting at the source. These rules are driving businesses toward small solutions that improve recyclability and reinforce separation. Emphasizing decentralized and effective waste management techniques, the results of the Grenelle Environment Forum also promote the use of compactors throughout towns.
Multi-stream compactors, which allow for the separation of multiple waste types (organic, plastic, and cardboard) within one system, offer significant potential in France. Equipment makers and service providers can access funded projects because of government assistance for public-private partnerships in waste infrastructure. In metropolitan areas, there is also an increasing need for compactors, combined with recycling booths, to promote citizen participation and reduce illegal dumping.
Category-wise Analysis
Stationary Compactors to Exhibit Leading by Type
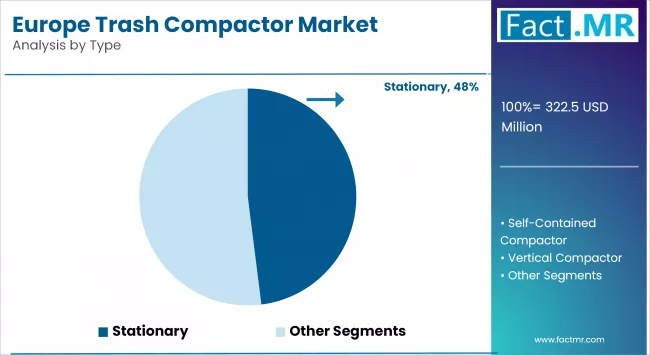
Stationary compactors have a high-capacity design, making them ideal for industries with consistent, large-scale waste streams such as manufacturing, logistics, and large commercial hubs. These fixed systems are well-suited for dry waste and offer long-term cost efficiency for facilities with predictable waste output. Their dominance in countries like Germany and France is attributed to widespread industrial adoption and well-developed waste infrastructure.
Stationary compactors have low maintenance requirements, durability, and automatic compatibility. In high-output situations, these units may be easily combined with chute-fed systems and dock loading techniques to simplify operations. Their robust construction helps reduce failures and facilitates continuous use, a must for manufacturing and distribution facilities with 24/7 operations.
Additionally, encouraging long-term stationary system investments is a regulatory focus on effective waste management and landfill diversion across Europe. Their affordable lifecycle and configurable alternatives for specific industry needs render them a dependable and scalable solution for companies seeking to maximize waste management.
Battery-Powdered to Exhibit Leading by Power Source
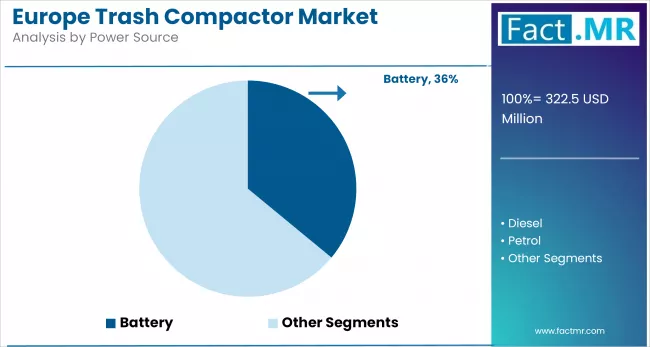
Battery-powered waste management equipment dominates the market due to its increasing use in urban areas and indoor environments, where noise and emissions are restricted. Their energy efficiency, low maintenance requirements, and suitability for compact, automated systems make battery-powered solutions highly preferred for households and institutional facilities.
While diesel-powered units are not as dominant, they continue to hold strong relevance, especially in large-scale or remote applications such as construction sites and outdoor public areas. Their high power output and ability to operate for extended periods without frequent recharging or refueling make them suitable for heavy-duty applications.
Automatic to Exhibit Leading by Mechanism
Automatic compactors integrated with sensors and smart controls are becoming the preferred choice in commercial and municipal settings. These systems offer features such as remote monitoring, auto-compaction based on fill levels, and scheduling, resulting in greater efficiency and reduced labor costs. This trend is closely tied to the region’s digital transformation of urban infrastructure and the push toward “smart city” waste management solutions.
When it comes to waste type, compactors are used for dry, wet, and recyclable waste. Dry waste, such as paper, plastic, and cardboard, is the most commonly processed in both commercial and industrial environments. However, demand for multi-stream compactors that handle various waste types is increasing due to the EU’s push for circular economy practices. These systems enable on-site waste segregation, enhancing recycling rates and facilitating compliance with environmental regulations, such as the EU Waste Framework Directive and local recycling mandates.
Dry to Exhibit Leading by Waste Type
Dry waste holds the leading position in the market due to its greater volume in both residential and commercial sectors. Materials such as paper, plastic, and packaging waste contribute significantly to daily waste generation, prompting the use of specialized dry waste collection and disposal systems, particularly in urban areas and commercial establishments.
Wet waste, while generated in comparatively smaller volumes, is gaining increased attention, particularly in hotels, restaurants, and households. The need for proper segregation and treatment of biodegradable waste, including food and organic material, is driving the adoption of advanced composting and bio-processing technologies.
Commercial to Exhibit Leading by Application
Commercial applications are driven by the waste volumes generated in the retail, hospitality, healthcare, and food service industries. Compactors help these businesses reduce waste collection frequency and operational costs while meeting sustainability targets. Meanwhile, municipal applications are gaining traction, particularly with the introduction of smart, solar-powered compactors in public spaces, parks, and transit hubs. Local councils are increasingly adopting such systems to reduce overflowing bins and improve urban cleanliness.
The need for commercial applications for space optimization, regulatory compliance, and brand image management makes them the most preferred applications. Often working in space-constrained surroundings, companies in industries such as hospitality and retail need to reduce the amount of waste.
Compactors assist in managing odors, reducing bin mess, and maintaining tidier surroundings, which are major elements for health code compliance and customer satisfaction. Furthermore, environmental certifications and waste reporting mandates encourage commercial companies to use more effective, traceable waste solutions. This operational and reputational advantage helps the business sector lead compactor adoption.
Households to Exhibit Leading by End-Use
Households represent the largest end-use segment, driven by the sheer scale of residential waste generation and the growing adoption of waste segregation practices. Government-led awareness programs and the availability of user-friendly waste disposal products have significantly contributed to this segment’s dominance.
Healthcare facilities are another critical end-use area, requiring stringent waste handling due to the hazardous nature of biomedical waste. The need for safe, compliant, and efficient disposal methods is fueling the adoption of specialized waste treatment systems in hospitals, clinics, and labs.
Competitive Analysis
The Europe trash compactor market is highly competitive, with a mix of global giants, regional manufacturers, and tech-driven innovators. Major players like Gladiator Garageworks and Maren Engineering Corporation dominate the large-scale industrial segment with durable, high-capacity compactors and strong service networks. Regional leaders cater to local regulations and demand with customizable, modular systems suited for commercial, industrial, and municipal applications.
Innovation is a key trend, introducing smart, solar-powered, and IoT-enabled compactors to meet the growing demand for sustainable and efficient waste management solutions. Companies like Ecube Labs, Europress, and others focus on niche areas like vertical balers and underground compactors that serve urban environments with space constraints. These firms are leveraging AI, remote monitoring, and automation to enhance efficiency and appeal to municipalities and businesses that prioritize ESG goals.
Strategic partnerships and service bundling are becoming common, especially as customers seek integrated waste management solutions. Players are aligning with tech companies and waste service providers to offer predictive maintenance, data analytics, and smart monitoring systems.
Recent Development
- In January 2025, Ecube Labs (Seoul) expanded its CleanCUBE line throughout major European cities. Through this expansion, the company will deploy solar-powered smart bins equipped with remote fill-level monitoring and compaction algorithms to enhance smart-city waste infrastructure.
- In October 2024, Lisbon (Portugal) launched a new initiative to improve urban cleanliness and optimize waste collection with the deployment of solar-powered public waste compactors. These smart bins, modeled after units like Bigbelly, offer up to eight times the capacity of traditional bins due to their compaction technology.
Segmentation of Europe Trash Compactor Market
-
By Type :
- Stationary
- Self-Contained compactor
- Vertical Compactor
-
By Power Source :
- Battery
- Diesel
- Petrol
-
By Mechanism :
- Automatic
- Semi-Automatic
- Hydraulic
-
By Waste Type :
- Dry Waste
- Wet Waste
-
By Application :
- Commercial
- Industrial
- Residential
- Agricultural
- Municipal
-
By End-use :
- Healthcare
- Hotels & Restaurants
- Amusement Parks
- Institutional Facilities
- Construction Sites
- Households
- Others
-
By Country :
- Germany
- France
- U.K.
- Benelux
- NORDIC
- Italy
- Spain
- Rest of Europe
Table of Content
- Executive Summary
- Europe Market Outlook
- Demand-side Trends
- Supply-side Trends
- Technology Roadmap Analysis
- Analysis and Recommendations
- Market Overview
- Market Coverage / Taxonomy
- Market Definition / Scope / Limitations
- Market Background
- Market Dynamics
- Drivers
- Restraints
- Opportunity
- Trends
- Scenario Forecast
- Demand in Optimistic Scenario
- Demand in Likely Scenario
- Demand in Conservative Scenario
- Opportunity Map Analysis
- Product Life Cycle Analysis
- Supply Chain Analysis
- Supply Side Participants and their Roles
- Producers
- Mid-Level Participants (Traders/ Agents/ Brokers)
- Wholesalers and Distributors
- Value Added and Value Created at Node in the Supply Chain
- List of Component Suppliers
- List of Existing and Potential Buyers
- Supply Side Participants and their Roles
- Investment Feasibility Matrix
- Value Chain Analysis
- Profit Margin Analysis
- Wholesalers and Distributors
- PESTLE and Porter’s Analysis
- Regulatory Landscape
- By Key Regions
- By Key Countries
- Production and Consumption Statistics
- Import and Export Statistics
- Market Dynamics
- Market Analysis 2020 to 2024 and Forecast, 2025 to 2035
- Historical Market Size Value (USD Mn) & Volume (Units) Analysis, 2020 to 2024
- Current and Future Market Size Value (USD Mn) & Volume (Units) Projections, 2025 to 2035
- Y-o-Y Growth Trend Analysis
- Absolute $ Opportunity Analysis
- Market Pricing Analysis 2020 to 2024 and Forecast 2025 to 2035
- Market Analysis 2020 to 2024 and Forecast 2025 to 2035, By Type
- Introduction / Key Findings
- Historical Market Size Value (USD Mn) & Volume (Units) Analysis By Type, 2020 to 2024
- Current and Future Market Size Value (USD Mn) & Volume (Units) Analysis and Forecast By Type, 2025 to 2035
- Stationary
- Self-Contained Compactor
- Vertical Compactor
- Y-o-Y Growth Trend Analysis By Type, 2020 to 2024
- Absolute $ Opportunity Analysis By Type, 2025 to 2035
- Market Analysis 2020 to 2024 and Forecast 2025 to 2035, By Power Source
- Introduction / Key Findings
- Historical Market Size Value (USD Mn) & Volume (Units) Analysis By Power Source, 2020 to 2024
- Current and Future Market Size Value (USD Mn) & Volume (Units) Analysis and Forecast By Power Source, 2025 to 2035
- Battery
- Diesel
- Petrol
- Y-o-Y Growth Trend Analysis By Power Source, 2020 to 2024
- Absolute $ Opportunity Analysis By Power Source, 2025 to 2035
- Market Analysis 2020 to 2024 and Forecast 2025 to 2035, By Mechanism
- Introduction / Key Findings
- Historical Market Size Value (USD Mn) & Volume (Units) Analysis By Mechanism, 2020 to 2024
- Current and Future Market Size Value (USD Mn) & Volume (Units) Analysis and Forecast By Mechanism, 2025 to 2035
- Automatic
- Semi-Automatic
- Hydraulic
- Y-o-Y Growth Trend Analysis By Mechanism, 2020 to 2024
- Absolute $ Opportunity Analysis By Mechanism, 2025 to 2035
- Market Analysis 2020 to 2024 and Forecast 2025 to 2035, By Waste Type
- Introduction / Key Findings
- Historical Market Size Value (USD Mn) & Volume (Units) Analysis By Waste Type, 2020 to 2024
- Current and Future Market Size Value (USD Mn) & Volume (Units) Analysis and Forecast By Waste Type, 2025 to 2035
- Dry Waste
- Wet Waste
- Y-o-Y Growth Trend Analysis By Waste Type, 2020 to 2024
- Absolute $ Opportunity Analysis By Waste Type, 2025 to 2035
- Market Analysis 2020 to 2024 and Forecast 2025 to 2035, By Application
- Introduction / Key Findings
- Historical Market Size Value (USD Mn) & Volume (Units) Analysis By Application, 2020 to 2024
- Current and Future Market Size Value (USD Mn) & Volume (Units) Analysis and Forecast By Application, 2025 to 2035
- Commercial
- Industrial
- Residential
- Agricultural
- Municipal
- Y-o-Y Growth Trend Analysis By Application, 2020 to 2024
- Absolute $ Opportunity Analysis By Application, 2025 to 2035
- Market Analysis 2020 to 2024 and Forecast 2025 to 2035, By End-use
- Introduction / Key Findings
- Historical Market Size Value (USD Mn) & Volume (Units) Analysis By End-use, 2020 to 2024
- Current and Future Market Size Value (USD Mn) & Volume (Units) Analysis and Forecast By End-use, 2025 to 2035
- Healthcare
- Hotels & Restaurants
- Amusement Parks
- Institutional Facilities
- Construction Sites
- Households
- Others
- Y-o-Y Growth Trend Analysis By End-use, 2020 to 2024
- Absolute $ Opportunity Analysis By End-use, 2025 to 2035
- Market Analysis 2020 to 2024 and Forecast 2025 to 2035, By Region
- Introduction
- Historical Market Size Value (USD Mn) & Volume (Units) Analysis By Region, 2020 to 2024
- Current Market Size Value (USD Mn) & Volume (Units) Analysis and Forecast By Region, 2025 to 2035
- Germany
- France
- U.K.
- Benelux
- NORDIC
- Italy
- Rest of Europe
- Market Attractiveness Analysis By Region
- Germany Market Analysis 2020 to 2024 and Forecast 2025 to 2035, By Country
- Historical Market Size Value (USD Mn) & Volume (Units) Trend Analysis By Market Taxonomy, 2020 to 2024
- Market Size Value (USD Mn) & Volume (Units) Forecast By Market Taxonomy, 2025 to 2035
- By Country
- By Type
- By Power Source
- By Mechanism
- By Waste Type
- By Application
- By End-use
- Market Attractiveness Analysis
- By Country
- By Type
- By Power Source
- By Mechanism
- By Waste Type
- By Application
- By End-use
- Key Takeaways
- France Market Analysis 2020 to 2024 and Forecast 2025 to 2035, By Country
- Historical Market Size Value (USD Mn) & Volume (Units) Trend Analysis By Market Taxonomy, 2020 to 2024
- Market Size Value (USD Mn) & Volume (Units) Forecast By Market Taxonomy, 2025 to 2035
- By Country
- By Type
- By Power Source
- By Mechanism
- By Waste Type
- By Application
- By End-use
- Market Attractiveness Analysis
- By Country
- By Type
- By Power Source
- By Mechanism
- By Waste Type
- By Application
- By End-use
- Key Takeaways
- U.K. Market Analysis 2020 to 2024 and Forecast 2025 to 2035, By Country
- Historical Market Size Value (USD Mn) & Volume (Units) Trend Analysis By Market Taxonomy, 2020 to 2024
- Market Size Value (USD Mn) & Volume (Units) Forecast By Market Taxonomy, 2025 to 2035
- By Country
- By Type
- By Power Source
- By Mechanism
- By Waste Type
- By Application
- By End-use
- Market Attractiveness Analysis
- By Country
- By Type
- By Power Source
- By Mechanism
- By Waste Type
- By Application
- By End-use
- Key Takeaways
- Benelux Market Analysis 2020 to 2024 and Forecast 2025 to 2035, By Country
- Historical Market Size Value (USD Mn) & Volume (Units) Trend Analysis By Market Taxonomy, 2020 to 2024
- Market Size Value (USD Mn) & Volume (Units) Forecast By Market Taxonomy, 2025 to 2035
- By Country
- By Type
- By Power Source
- By Mechanism
- By Waste Type
- By Application
- By End-use
- Market Attractiveness Analysis
- By Country
- By Type
- By Power Source
- By Mechanism
- By Waste Type
- By Application
- By End-use
- Key Takeaways
- NORDIC Market Analysis 2020 to 2024 and Forecast 2025 to 2035, By Country
- Historical Market Size Value (USD Mn) & Volume (Units) Trend Analysis By Market Taxonomy, 2020 to 2024
- Market Size Value (USD Mn) & Volume (Units) Forecast By Market Taxonomy, 2025 to 2035
- By Country
- By Type
- By Power Source
- By Mechanism
- By Waste Type
- By Application
- By End-use
- Market Attractiveness Analysis
- By Country
- By Type
- By Power Source
- By Mechanism
- By Waste Type
- By Application
- By End-use
- Key Takeaways
- Italy Market Analysis 2020 to 2024 and Forecast 2025 to 2035, By Country
- Historical Market Size Value (USD Mn) & Volume (Units) Trend Analysis By Market Taxonomy, 2020 to 2024
- Market Size Value (USD Mn) & Volume (Units) Forecast By Market Taxonomy, 2025 to 2035
- By Country
- By Type
- By Power Source
- By Mechanism
- By Waste Type
- By Application
- By End-use
- Market Attractiveness Analysis
- By Country
- By Type
- By Power Source
- By Mechanism
- By Waste Type
- By Application
- By End-use
- Key Takeaways
- Rest of Europe Market Analysis 2020 to 2024 and Forecast 2025 to 2035, By Country
- Historical Market Size Value (USD Mn) & Volume (Units) Trend Analysis By Market Taxonomy, 2020 to 2024
- Market Size Value (USD Mn) & Volume (Units) Forecast By Market Taxonomy, 2025 to 2035
- By Country
- By Type
- By Power Source
- By Mechanism
- By Waste Type
- By Application
- By End-use
- Market Attractiveness Analysis
- By Country
- By Type
- By Power Source
- By Mechanism
- By Waste Type
- By Application
- By End-use
- Key Takeaways
- Key Countries Market Analysis
- Germany
- Pricing Analysis
- Market Share Analysis, 2024
- By Type
- By Power Source
- By Mechanism
- By Waste Type
- By Application
- By End-use
- France
- Pricing Analysis
- Market Share Analysis, 2024
- By Type
- By Power Source
- By Mechanism
- By Waste Type
- By Application
- By End-use
- U.K.
- Pricing Analysis
- Market Share Analysis, 2024
- By Type
- By Power Source
- By Mechanism
- By Waste Type
- By Application
- By End-use
- Italy
- Pricing Analysis
- Market Share Analysis, 2024
- By Type
- By Power Source
- By Mechanism
- By Waste Type
- By Application
- By End-use
- Spain
- Pricing Analysis
- Market Share Analysis, 2024
- By Type
- By Power Source
- By Mechanism
- By Waste Type
- By Application
- By End-use
- Germany
- Market Structure Analysis
- Competition Dashboard
- Competition Benchmarking
- Market Share Analysis of Top Players
- By Regional
- By Type
- By Power Source
- By Mechanism
- By Waste Type
- By Application
- By End-use
- Competition Analysis
- Competition Deep Dive
- Bharati Industries
- Overview
- Product Portfolio
- Profitability by Market Segments (Product/Age /Sales Channel/Region)
- Sales Footprint
- Strategy Overview
- Marketing Strategy
- Product Strategy
- Channel Strategy
- Orwak
- Overview
- Product Portfolio
- Profitability by Market Segments (Product/Age /Sales Channel/Region)
- Sales Footprint
- Strategy Overview
- Marketing Strategy
- Product Strategy
- Channel Strategy
- CK International
- Overview
- Product Portfolio
- Profitability by Market Segments (Product/Age /Sales Channel/Region)
- Sales Footprint
- Strategy Overview
- Marketing Strategy
- Product Strategy
- Channel Strategy
- Jenn-Air
- Overview
- Product Portfolio
- Profitability by Market Segments (Product/Age /Sales Channel/Region)
- Sales Footprint
- Strategy Overview
- Marketing Strategy
- Product Strategy
- Channel Strategy
- Marathon Equipment Company
- Overview
- Product Portfolio
- Profitability by Market Segments (Product/Age /Sales Channel/Region)
- Sales Footprint
- Strategy Overview
- Marketing Strategy
- Product Strategy
- Channel Strategy
- Bharati Industries
- Competition Deep Dive
- Assumptions & Acronyms Used
- Research Methodology
List Of Table
- Table 1: Market Value (USD Mn) Forecast by Region, 2020 to 2035
- Table 2: Market Volume (Units) Forecast by Region, 2020 to 2035
- Table 3: Market Value (USD Mn) Forecast by Type, 2020 to 2035
- Table 4: Market Volume (Units) Forecast by Type, 2020 to 2035
- Table 5: Market Value (USD Mn) Forecast by Power Source, 2020 to 2035
- Table 6: Market Volume (Units) Forecast by Power Source, 2020 to 2035
- Table 7: Market Value (USD Mn) Forecast by Mechanism, 2020 to 2035
- Table 8: Market Volume (Units) Forecast by Mechanism, 2020 to 2035
- Table 9: Market Value (USD Mn) Forecast by Waste Type, 2020 to 2035
- Table 10: Market Volume (Units) Forecast by Waste Type, 2020 to 2035
- Table 11: Market Value (USD Mn) Forecast by Application, 2020 to 2035
- Table 12: Market Volume (Units) Forecast by Application, 2020 to 2035
- Table 13: Market Value (USD Mn) Forecast by End-use, 2020 to 2035
- Table 14: Market Volume (Units) Forecast by End-use, 2020 to 2035
- Table 15: Germany Market Value (USD Mn) Forecast by Country, 2020 to 2035
- Table 16: Germany Market Volume (Units) Forecast by Country, 2020 to 2035
- Table 17: Germany Market Value (USD Mn) Forecast by Type, 2020 to 2035
- Table 18: Germany Market Volume (Units) Forecast by Type, 2020 to 2035
- Table 19: Germany Market Value (USD Mn) Forecast by Power Source, 2020 to 2035
- Table 20: Germany Market Volume (Units) Forecast by Power Source, 2020 to 2035
- Table 21: Germany Market Value (USD Mn) Forecast by Mechanism, 2020 to 2035
- Table 22: Germany Market Volume (Units) Forecast by Mechanism, 2020 to 2035
- Table 23: Germany Market Value (USD Mn) Forecast by Waste Type, 2020 to 2035
- Table 24: Germany Market Volume (Units) Forecast by Waste Type, 2020 to 2035
- Table 25: Germany Market Value (USD Mn) Forecast by Application, 2020 to 2035
- Table 26: Germany Market Volume (Units) Forecast by Application, 2020 to 2035
- Table 27: Germany Market Value (USD Mn) Forecast by End-use, 2020 to 2035
- Table 28: Germany Market Volume (Units) Forecast by End-use, 2020 to 2035
- Table 29: France Market Value (USD Mn) Forecast by Country, 2020 to 2035
- Table 30: France Market Volume (Units) Forecast by Country, 2020 to 2035
- Table 31: France Market Value (USD Mn) Forecast by Type, 2020 to 2035
- Table 32: France Market Volume (Units) Forecast by Type, 2020 to 2035
- Table 33: France Market Value (USD Mn) Forecast by Power Source, 2020 to 2035
- Table 34: France Market Volume (Units) Forecast by Power Source, 2020 to 2035
- Table 35: France Market Value (USD Mn) Forecast by Mechanism, 2020 to 2035
- Table 36: France Market Volume (Units) Forecast by Mechanism, 2020 to 2035
- Table 37: France Market Value (USD Mn) Forecast by Waste Type, 2020 to 2035
- Table 38: France Market Volume (Units) Forecast by Waste Type, 2020 to 2035
- Table 39: France Market Value (USD Mn) Forecast by Application, 2020 to 2035
- Table 40: France Market Volume (Units) Forecast by Application, 2020 to 2035
- Table 41: France Market Value (USD Mn) Forecast by End-use, 2020 to 2035
- Table 42: France Market Volume (Units) Forecast by End-use, 2020 to 2035
- Table 43: U.K. Market Value (USD Mn) Forecast by Country, 2020 to 2035
- Table 44: U.K. Market Volume (Units) Forecast by Country, 2020 to 2035
- Table 45: U.K. Market Value (USD Mn) Forecast by Type, 2020 to 2035
- Table 46: U.K. Market Volume (Units) Forecast by Type, 2020 to 2035
- Table 47: U.K. Market Value (USD Mn) Forecast by Power Source, 2020 to 2035
- Table 48: U.K. Market Volume (Units) Forecast by Power Source, 2020 to 2035
- Table 49: U.K. Market Value (USD Mn) Forecast by Mechanism, 2020 to 2035
- Table 50: U.K. Market Volume (Units) Forecast by Mechanism, 2020 to 2035
- Table 51: U.K. Market Value (USD Mn) Forecast by Waste Type, 2020 to 2035
- Table 52: U.K. Market Volume (Units) Forecast by Waste Type, 2020 to 2035
- Table 53: U.K. Market Value (USD Mn) Forecast by Application, 2020 to 2035
- Table 54: U.K. Market Volume (Units) Forecast by Application, 2020 to 2035
- Table 55: U.K. Market Value (USD Mn) Forecast by End-use, 2020 to 2035
- Table 56: U.K. Market Volume (Units) Forecast by End-use, 2020 to 2035
- Table 57: Benelux Market Value (USD Mn) Forecast by Country, 2020 to 2035
- Table 58: Benelux Market Volume (Units) Forecast by Country, 2020 to 2035
- Table 59: Benelux Market Value (USD Mn) Forecast by Type, 2020 to 2035
- Table 60: Benelux Market Volume (Units) Forecast by Type, 2020 to 2035
- Table 61: Benelux Market Value (USD Mn) Forecast by Power Source, 2020 to 2035
- Table 62: Benelux Market Volume (Units) Forecast by Power Source, 2020 to 2035
- Table 63: Benelux Market Value (USD Mn) Forecast by Mechanism, 2020 to 2035
- Table 64: Benelux Market Volume (Units) Forecast by Mechanism, 2020 to 2035
- Table 65: Benelux Market Value (USD Mn) Forecast by Waste Type, 2020 to 2035
- Table 66: Benelux Market Volume (Units) Forecast by Waste Type, 2020 to 2035
- Table 67: Benelux Market Value (USD Mn) Forecast by Application, 2020 to 2035
- Table 68: Benelux Market Volume (Units) Forecast by Application, 2020 to 2035
- Table 69: Benelux Market Value (USD Mn) Forecast by End-use, 2020 to 2035
- Table 70: Benelux Market Volume (Units) Forecast by End-use, 2020 to 2035
- Table 71: NORDIC Market Value (USD Mn) Forecast by Country, 2020 to 2035
- Table 72: NORDIC Market Volume (Units) Forecast by Country, 2020 to 2035
- Table 73: NORDIC Market Value (USD Mn) Forecast by Type, 2020 to 2035
- Table 74: NORDIC Market Volume (Units) Forecast by Type, 2020 to 2035
- Table 75: NORDIC Market Value (USD Mn) Forecast by Power Source, 2020 to 2035
- Table 76: NORDIC Market Volume (Units) Forecast by Power Source, 2020 to 2035
- Table 77: NORDIC Market Value (USD Mn) Forecast by Mechanism, 2020 to 2035
- Table 78: NORDIC Market Volume (Units) Forecast by Mechanism, 2020 to 2035
- Table 79: NORDIC Market Value (USD Mn) Forecast by Waste Type, 2020 to 2035
- Table 80: NORDIC Market Volume (Units) Forecast by Waste Type, 2020 to 2035
- Table 81: NORDIC Market Value (USD Mn) Forecast by Application, 2020 to 2035
- Table 82: NORDIC Market Volume (Units) Forecast by Application, 2020 to 2035
- Table 83: NORDIC Market Value (USD Mn) Forecast by End-use, 2020 to 2035
- Table 84: NORDIC Market Volume (Units) Forecast by End-use, 2020 to 2035
- Table 85: Italy Market Value (USD Mn) Forecast by Country, 2020 to 2035
- Table 86: Italy Market Volume (Units) Forecast by Country, 2020 to 2035
- Table 87: Italy Market Value (USD Mn) Forecast by Type, 2020 to 2035
- Table 88: Italy Market Volume (Units) Forecast by Type, 2020 to 2035
- Table 89: Italy Market Value (USD Mn) Forecast by Power Source, 2020 to 2035
- Table 90: Italy Market Volume (Units) Forecast by Power Source, 2020 to 2035
- Table 91: Italy Market Value (USD Mn) Forecast by Mechanism, 2020 to 2035
- Table 92: Italy Market Volume (Units) Forecast by Mechanism, 2020 to 2035
- Table 93: Italy Market Value (USD Mn) Forecast by Waste Type, 2020 to 2035
- Table 94: Italy Market Volume (Units) Forecast by Waste Type, 2020 to 2035
- Table 95: Italy Market Value (USD Mn) Forecast by Application, 2020 to 2035
- Table 96: Italy Market Volume (Units) Forecast by Application, 2020 to 2035
- Table 97: Italy Market Value (USD Mn) Forecast by End-use, 2020 to 2035
- Table 98: Italy Market Volume (Units) Forecast by End-use, 2020 to 2035
- Table 99: Rest of Europe, Market Value (USD Mn) Forecast by Country, 2020 to 2035
- Table 100: Rest of Europe, Market Volume (Units) Forecast by Country, 2020 to 2035
- Table 101: Rest of Europe, Market Value (USD Mn) Forecast by Type, 2020 to 2035
- Table 102: Rest of Europe, Market Volume (Units) Forecast by Type, 2020 to 2035
- Table 103: Rest of Europe, Market Value (USD Mn) Forecast by Power Source, 2020 to 2035
- Table 104: Rest of Europe, Market Volume (Units) Forecast by Power Source, 2020 to 2035
- Table 105: Rest of Europe, Market Value (USD Mn) Forecast by Mechanism, 2020 to 2035
- Table 106: Rest of Europe, Market Volume (Units) Forecast by Mechanism, 2020 to 2035
- Table 107: Rest of Europe, Market Value (USD Mn) Forecast by Waste Type, 2020 to 2035
- Table 108: Rest of Europe, Market Volume (Units) Forecast by Waste Type, 2020 to 2035
- Table 109: Rest of Europe, Market Value (USD Mn) Forecast by Application, 2020 to 2035
- Table 110: Rest of Europe, Market Volume (Units) Forecast by Application, 2020 to 2035
- Table 111: Rest of Europe, Market Value (USD Mn) Forecast by End-use, 2020 to 2035
- Table 112: Rest of Europe, Market Volume (Units) Forecast by End-use, 2020 to 2035
List Of Figures
- Figure 1: Market Volume (Units) Forecast 2020 to 2035
- Figure 2: Market Pricing Analysis
- Figure 3: Market Value (USD Mn) Forecast 2020 to 2035
- Figure 4: Market Value Share and BPS Analysis by Type, 2025 and 2035
- Figure 5: Market Y-o-Y Growth Comparison by Type, 2025 to 2035
- Figure 6: Market Attractiveness Analysis by Type
- Figure 7: Market Value Share and BPS Analysis by Power Source, 2025 and 2035
- Figure 8: Market Y-o-Y Growth Comparison by Power Source, 2025 to 2035
- Figure 9: Market Attractiveness Analysis by Power Source
- Figure 10: Market Value Share and BPS Analysis by Mechanism, 2025 and 2035
- Figure 11: Market Y-o-Y Growth Comparison by Mechanism, 2025 to 2035
- Figure 12: Market Attractiveness Analysis by Mechanism
- Figure 13: Market Value Share and BPS Analysis by Waste Type, 2025 and 2035
- Figure 14: Market Y-o-Y Growth Comparison by Waste Type, 2025 to 2035
- Figure 15: Market Attractiveness Analysis by Waste Type
- Figure 16: Market Value Share and BPS Analysis by Application, 2025 and 2035
- Figure 17: Market Y-o-Y Growth Comparison by Application, 2025 to 2035
- Figure 18: Market Attractiveness Analysis by Application
- Figure 19: Market Value Share and BPS Analysis by End-use, 2025 and 2035
- Figure 20: Market Y-o-Y Growth Comparison by End-use, 2025 to 2035
- Figure 21: Market Attractiveness Analysis by End-use
- Figure 22: Market Value (USD Mn) Share and BPS Analysis by Region, 2025 and 2035
- Figure 23: Market Y-o-Y Growth Comparison by Region, 2025 to 2035
- Figure 24: Market Attractiveness Analysis by Region
- Figure 25: Germany Market Incremental $ Opportunity, 2025 to 2035
- Figure 26: France Market Incremental $ Opportunity, 2025 to 2035
- Figure 27: U.K. Market Incremental $ Opportunity, 2025 to 2035
- Figure 28: Benelux Market Incremental $ Opportunity, 2025 to 2035
- Figure 29: NORDIC Market Incremental $ Opportunity, 2025 to 2035
- Figure 30: Italy Market Incremental $ Opportunity, 2025 to 2035
- Figure 31: Rest of Europe Market Incremental $ Opportunity, 2025 to 2035
- Figure 32: Germany Market Value Share and BPS Analysis by Country, 2025 and 2035
- Figure 33: Germany Market Value Share and BPS Analysis by Type, 2025 and 2035
- Figure 34: Germany Market Y-o-Y Growth Comparison by Type, 2025 to 2035
- Figure 35: Germany Market Attractiveness Analysis by Type
- Figure 36: Germany Market Value Share and BPS Analysis by Power Source, 2025 and 2035
- Figure 37: Germany Market Y-o-Y Growth Comparison by Power Source, 2025 to 2035
- Figure 38: Germany Market Attractiveness Analysis by Power Source
- Figure 39: Germany Market Value Share and BPS Analysis by Mechanism, 2025 and 2035
- Figure 40: Germany Market Y-o-Y Growth Comparison by Mechanism, 2025 to 2035
- Figure 41: Germany Market Attractiveness Analysis by Mechanism
- Figure 42: Germany Market Value Share and BPS Analysis by Waste Type, 2025 and 2035
- Figure 43: Germany Market Y-o-Y Growth Comparison by Waste Type, 2025 to 2035
- Figure 44: Germany Market Attractiveness Analysis by Waste Type
- Figure 45: Germany Market Value Share and BPS Analysis by Application, 2025 and 2035
- Figure 46: Germany Market Y-o-Y Growth Comparison by Application, 2025 to 2035
- Figure 47: Germany Market Attractiveness Analysis by Application
- Figure 48: Germany Market Value Share and BPS Analysis by End-use, 2025 and 2035
- Figure 49: Germany Market Y-o-Y Growth Comparison by End-use, 2025 to 2035
- Figure 50: Germany Market Attractiveness Analysis by End-use
- Figure 51: France Market Value Share and BPS Analysis by Country, 2025 and 2035
- Figure 52: France Market Value Share and BPS Analysis by Type, 2025 and 2035
- Figure 53: France Market Y-o-Y Growth Comparison by Type, 2025 to 2035
- Figure 54: France Market Attractiveness Analysis by Type
- Figure 55: France Market Value Share and BPS Analysis by Power Source, 2025 and 2035
- Figure 56: France Market Y-o-Y Growth Comparison by Power Source, 2025 to 2035
- Figure 57: France Market Attractiveness Analysis by Power Source
- Figure 58: France Market Value Share and BPS Analysis by Mechanism, 2025 and 2035
- Figure 59: France Market Y-o-Y Growth Comparison by Mechanism, 2025 to 2035
- Figure 60: France Market Attractiveness Analysis by Mechanism
- Figure 61: France Market Value Share and BPS Analysis by Waste Type, 2025 and 2035
- Figure 62: France Market Y-o-Y Growth Comparison by Waste Type, 2025 to 2035
- Figure 63: France Market Attractiveness Analysis by Waste Type
- Figure 64: France Market Value Share and BPS Analysis by Application, 2025 and 2035
- Figure 65: France Market Y-o-Y Growth Comparison by Application, 2025 to 2035
- Figure 66: France Market Attractiveness Analysis by Application
- Figure 67: France Market Value Share and BPS Analysis by End-use, 2025 and 2035
- Figure 68: France Market Y-o-Y Growth Comparison by End-use, 2025 to 2035
- Figure 69: France Market Attractiveness Analysis by End-use
- Figure 70: U.K. Market Value Share and BPS Analysis by Country, 2025 and 2035
- Figure 71: U.K. Market Value Share and BPS Analysis by Type, 2025 and 2035
- Figure 72: U.K. Market Y-o-Y Growth Comparison by Type, 2025 to 2035
- Figure 73: U.K. Market Attractiveness Analysis by Type
- Figure 74: U.K. Market Value Share and BPS Analysis by Power Source, 2025 and 2035
- Figure 75: U.K. Market Y-o-Y Growth Comparison by Power Source, 2025 to 2035
- Figure 76: U.K. Market Attractiveness Analysis by Power Source
- Figure 77: U.K. Market Value Share and BPS Analysis by Mechanism, 2025 and 2035
- Figure 78: U.K. Market Y-o-Y Growth Comparison by Mechanism, 2025 to 2035
- Figure 79: U.K. Market Attractiveness Analysis by Mechanism
- Figure 80: U.K. Market Value Share and BPS Analysis by Waste Type, 2025 and 2035
- Figure 81: U.K. Market Y-o-Y Growth Comparison by Waste Type, 2025 to 2035
- Figure 82: U.K. Market Attractiveness Analysis by Waste Type
- Figure 83: U.K. Market Value Share and BPS Analysis by Application, 2025 and 2035
- Figure 84: U.K. Market Y-o-Y Growth Comparison by Application, 2025 to 2035
- Figure 85: U.K. Market Attractiveness Analysis by Application
- Figure 86: U.K. Market Value Share and BPS Analysis by End-use, 2025 and 2035
- Figure 87: U.K. Market Y-o-Y Growth Comparison by End-use, 2025 to 2035
- Figure 88: U.K. Market Attractiveness Analysis by End-use
- Figure 89: Benelux Market Value Share and BPS Analysis by Country, 2025 and 2035
- Figure 90: Benelux Market Value Share and BPS Analysis by Type, 2025 and 2035
- Figure 91: Benelux Market Y-o-Y Growth Comparison by Type, 2025 to 2035
- Figure 92: Benelux Market Attractiveness Analysis by Type
- Figure 93: Benelux Market Value Share and BPS Analysis by Power Source, 2025 and 2035
- Figure 94: Benelux Market Y-o-Y Growth Comparison by Power Source, 2025 to 2035
- Figure 95: Benelux Market Attractiveness Analysis by Power Source
- Figure 96: Benelux Market Value Share and BPS Analysis by Mechanism, 2025 and 2035
- Figure 97: Benelux Market Y-o-Y Growth Comparison by Mechanism, 2025 to 2035
- Figure 98: Benelux Market Attractiveness Analysis by Mechanism
- Figure 99: Benelux Market Value Share and BPS Analysis by Waste Type, 2025 and 2035
- Figure 100: Benelux Market Y-o-Y Growth Comparison by Waste Type, 2025 to 2035
- Figure 101: Benelux Market Attractiveness Analysis by Waste Type
- Figure 102: Benelux Market Value Share and BPS Analysis by Application, 2025 and 2035
- Figure 103: Benelux Market Y-o-Y Growth Comparison by Application, 2025 to 2035
- Figure 104: Benelux Market Attractiveness Analysis by Application
- Figure 105: Benelux Market Value Share and BPS Analysis by End-use, 2025 and 2035
- Figure 106: Benelux Market Y-o-Y Growth Comparison by End-use, 2025 to 2035
- Figure 107: Benelux Market Attractiveness Analysis by End-use
- Figure 108: NORDIC Market Value Share and BPS Analysis by Country, 2025 and 2035
- Figure 109: NORDIC Market Value Share and BPS Analysis by Type, 2025 and 2035
- Figure 110: NORDIC Market Y-o-Y Growth Comparison by Type, 2025 to 2035
- Figure 111: NORDIC Market Attractiveness Analysis by Type
- Figure 112: NORDIC Market Value Share and BPS Analysis by Power Source, 2025 and 2035
- Figure 113: NORDIC Market Y-o-Y Growth Comparison by Power Source, 2025 to 2035
- Figure 114: NORDIC Market Attractiveness Analysis by Power Source
- Figure 115: NORDIC Market Value Share and BPS Analysis by Mechanism, 2025 and 2035
- Figure 116: NORDIC Market Y-o-Y Growth Comparison by Mechanism, 2025 to 2035
- Figure 117: NORDIC Market Attractiveness Analysis by Mechanism
- Figure 118: NORDIC Market Value Share and BPS Analysis by Waste Type, 2025 and 2035
- Figure 119: NORDIC Market Y-o-Y Growth Comparison by Waste Type, 2025 to 2035
- Figure 120: NORDIC Market Attractiveness Analysis by Waste Type
- Figure 121: NORDIC Market Value Share and BPS Analysis by Application, 2025 and 2035
- Figure 122: NORDIC Market Y-o-Y Growth Comparison by Application, 2025 to 2035
- Figure 123: NORDIC Market Attractiveness Analysis by Application
- Figure 124: NORDIC Market Value Share and BPS Analysis by End-use, 2025 and 2035
- Figure 125: NORDIC Market Y-o-Y Growth Comparison by End-use, 2025 to 2035
- Figure 126: NORDIC Market Attractiveness Analysis by End-use
- Figure 127: Italy Market Value Share and BPS Analysis by Country, 2025 and 2035
- Figure 128: Italy Market Value Share and BPS Analysis by Type, 2025 and 2035
- Figure 129: Italy Market Y-o-Y Growth Comparison by Type, 2025 to 2035
- Figure 130: Italy Market Attractiveness Analysis by Type
- Figure 131: Italy Market Value Share and BPS Analysis by Power Source, 2025 and 2035
- Figure 132: Italy Market Y-o-Y Growth Comparison by Power Source, 2025 to 2035
- Figure 133: Italy Market Attractiveness Analysis by Power Source
- Figure 134: Italy Market Value Share and BPS Analysis by Mechanism, 2025 and 2035
- Figure 135: Italy Market Y-o-Y Growth Comparison by Mechanism, 2025 to 2035
- Figure 136: Italy Market Attractiveness Analysis by Mechanism
- Figure 137: Italy Market Value Share and BPS Analysis by Waste Type, 2025 and 2035
- Figure 138: Italy Market Y-o-Y Growth Comparison by Waste Type, 2025 to 2035
- Figure 139: Italy Market Attractiveness Analysis by Waste Type
- Figure 140: Italy Market Value Share and BPS Analysis by Application, 2025 and 2035
- Figure 141: Italy Market Y-o-Y Growth Comparison by Application, 2025 to 2035
- Figure 142: Italy Market Attractiveness Analysis by Application
- Figure 143: Italy Market Value Share and BPS Analysis by End-use, 2025 and 2035
- Figure 144: Italy Market Y-o-Y Growth Comparison by End-use, 2025 to 2035
- Figure 145: Italy Market Attractiveness Analysis by End-use
- Figure 146: Rest of Europe Market Value Share and BPS Analysis by Country, 2025 and 2035
- Figure 147: Rest of Europe Market Value Share and BPS Analysis by Type, 2025 and 2035
- Figure 148: Rest of Europe Market Y-o-Y Growth Comparison by Type, 2025 to 2035
- Figure 149: Rest of Europe Market Attractiveness Analysis by Type
- Figure 150: Rest of Europe Market Value Share and BPS Analysis by Power Source, 2025 and 2035
- Figure 151: Rest of Europe Market Y-o-Y Growth Comparison by Power Source, 2025 to 2035
- Figure 152: Rest of Europe Market Attractiveness Analysis by Power Source
- Figure 153: Rest of Europe Market Value Share and BPS Analysis by Mechanism, 2025 and 2035
- Figure 154: Rest of Europe Market Y-o-Y Growth Comparison by Mechanism, 2025 to 2035
- Figure 155: Rest of Europe Market Attractiveness Analysis by Mechanism
- Figure 156: Rest of Europe Market Value Share and BPS Analysis by Waste Type, 2025 and 2035
- Figure 157: Rest of Europe Market Y-o-Y Growth Comparison by Waste Type, 2025 to 2035
- Figure 158: Rest of Europe Market Attractiveness Analysis by Waste Type
- Figure 159: Rest of Europe Market Value Share and BPS Analysis by Application, 2025 and 2035
- Figure 160: Rest of Europe Market Y-o-Y Growth Comparison by Application, 2025 to 2035
- Figure 161: Rest of Europe Market Attractiveness Analysis by Application
- Figure 162: Rest of Europe Market Value Share and BPS Analysis by End-use, 2025 and 2035
- Figure 163: Rest of Europe Market Y-o-Y Growth Comparison by End-use, 2025 to 2035
- Figure 164: Rest of Europe Market Attractiveness Analysis by End-use
- Figure 165: Market - Tier Structure Analysis
- Figure 166: Market - Company Share Analysis
- FAQs -
What is the Europe Trash Compactor Market size in 2025?
The Europe trash compactor market is valued at USD 322.5 million in 2025.
Who are the Major Players Operating in Europe Trash Compactor Market?
Prominent players in the market include Bharati Industries, Orwak, CK International, Jenn-Air, Marathon Equipment Company.
What is the Estimated Valuation of the Europe Trash Compactor Market by 2035?
The market is expected to reach a valuation of USD 441.9 million by 2035.
What Value CAGR did the Europe Trash Compactor Market Exhibit over the Last Five Years?
The historic growth rate of the Europe Trash Compactor market was 2.1% from 2020 to 2024.