- Market Value (2025): USD 98.6 Bn
- Estimated Value (2026): USD 115.6 Bn
- Forecast Value (2036): USD 567.5 Bn
- CAGR (2026-2036): 17.2%
What is the EV Battery Market forecast to be worth by 2036?
USD 115.6 billion in 2026 to USD 567.5 billion by 2036 at a 17.2% CAGR.
- The valuation of the EV battery market was USD 98.6 billion in 2025, with packs for battery-electric passenger cars forming the base of revenue.
- Revenue will grow from USD 115.6 billion in 2026 to USD 567.5 billion by 2036 as new cell plants come online in Europe, North America and Asia.
- A 17.2% CAGR reflects higher electric vehicle output, wider model choice and steady gains in energy density per pack.
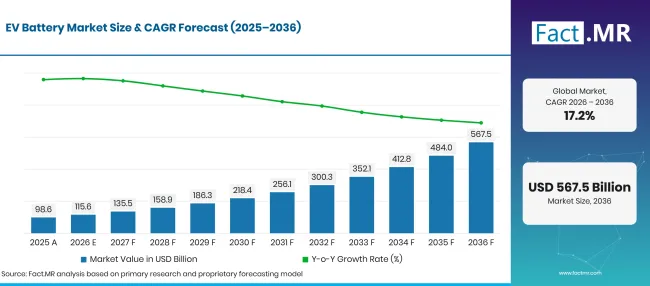
Ev Battery Market Forecast Global | Source: Fact.MR
| Year | Basis | Market Value (USD billion) |
|---|---|---|
| 2025 | Actual | 98.6 |
| 2026 | Estimate | 115.6 |
| 2036 | Forecast | 567.5 |
| CAGR 2026 to 2036 | Forecast period | 17.2% |
Source: Fact.MR analysis. Updated Nov 5, 2026
What are the defining numbers behind EV Battery Market growth?
The 2026 to 2036 period will add USD 451.9 billion in new value, led by lithium-ion cells fitted to passenger cars in the 50-110 kWh range.
- Demand Drivers in the Market
- Electric car sales grew by 20% worldwide to exceed 20 million units in 2025, so one in four new cars sold was electric [1]. Each of these vehicles needs a traction battery, which ties battery revenue directly to vehicle output.
- Public funding is targeting the battery supply chain. The European Commission’s Industrial Action Plan for the automotive sector, published in March 2025, earmarks EUR 1.8 billion for a secure supply chain of battery raw materials [2].
- Traceability rules are lifting the value of each pack. Under the EU Batteries Regulation, electric vehicle batteries must carry a QR code linked to a digital battery passport from 18 February 2027 [3].
- Truck and bus fleets are moving to electric drive, and these vehicles use packs several times bigger than a passenger car. Higher capacity per vehicle lifts revenue even where unit volumes stay modest.
- Key Segments Analyzed
- By Battery Type: Lithium-ion will hold 71.4% share in 2026, since its energy density and mature production lines suit nearly every electric vehicle platform.
- By Vehicle Type: Passenger Cars will account for 58.3% of 2026 value, as private buyers and ride-hailing fleets switch to battery-electric models.
- By Application: Electric Vehicles will capture 40.5% in 2026, given that fully electric drive needs the most battery capacity per vehicle.
- By Battery Capacity: 50-110 kWh will represent 42.6% of 2026 revenue, because this band gives mainstream cars a usable range without excess pack weight.
- Analyst Opinion at Fact.MR
- Shambhu Nath Jha, Principal Consultant at Fact.MR, states, “Battery cost per kilowatt-hour will set the pace at which electric cars match combustion models on price. Cell makers that can switch between LFP and nickel-rich chemistries on the same line will win more automaker programs. Solid-state cells will enter premium models first, while lithium-ion packs will carry volume through 2036.”
- Strategic Implications
- Cell manufacturers should place new capacity near automaker assembly plants, cutting freight costs and meeting local content rules.
- Automakers should qualify at least two cell chemistries per platform so that pack supply can follow shifts in mineral prices.
- Material suppliers should secure long-term offtake for lithium, nickel and graphite, as cell plants lock in supply years before production starts.
- Investors should weigh recycling and second-life capacity, since battery passport and recovery rules will turn spent packs into a tracked resource.
Growth will be widest in Germany at 19.8%, where a large car industry is converting its model ranges to battery-electric drive. Brazil follows at 18.1%, helped by a new vehicle program that ties tax treatment to efficiency and recyclability. The United States will grow at 16.3%, as a large vehicle base meets uneven buyer incentives. The United Kingdom will grow at 14.6% as gigafactory capacity arrives later than in continental Europe. Japan closes the range at 12.9%, since hybrids still take a large part of its new car sales and full-electric adoption starts from a low base.
How does the EV Battery Market break down by segment?
Lithium-ion will lead Battery Type at 71.4%; Passenger Cars will head Vehicle Type at 58.3%; Electric Vehicles will top Application at 40.5%; 50-110 kWh will hold Battery Capacity at 42.6% in 2026.
Which Battery Type leads?
Lithium-ion holds 71.4% of 2026 sales.
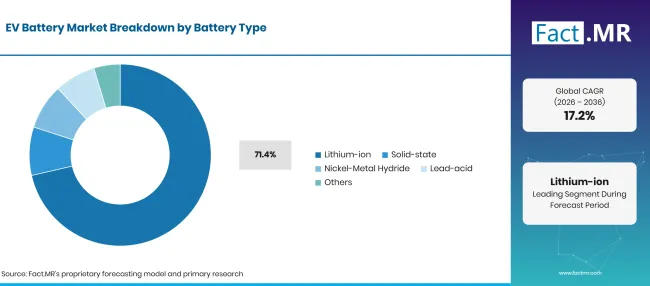
Ev Battery Market Breakdown Battery Type | Source: Fact.MR
| Battery Type | Share (2026) |
|---|---|
| Lithium-ion (Leading segment) | 71.4% |
| Other segments combined | 28.6%* |
| Total | 100.0% |
Source: Fact.MR analysis. Updated Nov 5, 2026
Automakers choose lithium-ion cells because they store more energy per kilogram than older chemistries and are built at global scale. Within this group, lithium iron phosphate cells are gaining share in entry models, as they cost less and resist overheating. Nickel-rich cells keep their place in long-range and performance cars. Cathode choice is a large part of cell cost, which is why demand for lithium-ion battery cathodes tracks the chemistry mix closely. Production is heavily concentrated, as China accounted for over 80% of battery cell output in 2025 [1]. Nickel-metal hydride packs remain in some hybrids, and lead-acid units serve low-speed vehicles. Interest in solid-state battery technology is rising, although volume production is still limited.
What supports Passenger Cars within Vehicle Type?
Passenger Cars take 58.3% of 2026 revenue.
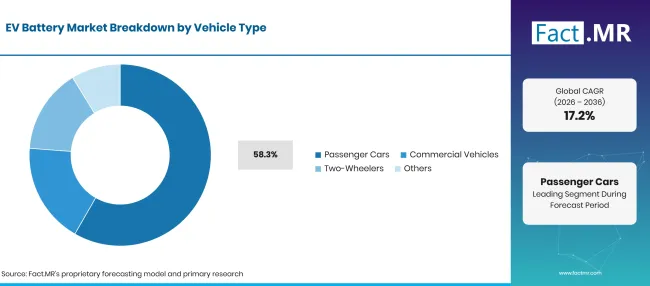
Factmr Ev Battery Market Breakdown Vehicle Type | Source: Fact.MR
| Vehicle Type | Share (2026) |
|---|---|
| Passenger Cars (Leading segment) | 58.3% |
| Other segments combined | 41.7%* |
| Total | 100.0% |
Source: Fact.MR analysis. Updated Nov 5, 2026
Private car buyers now find electric models in almost every size class, from small hatchbacks to seven-seat SUVs. Each new model brings a dedicated pack design, and automakers often source the cells from two suppliers. Growth in the wider electric vehicle industry therefore feeds battery orders well before cars reach showrooms. Commercial vehicles are the next source of volume. Electric trucks reached 9% of truck sales worldwide in 2025 [1], and city operators keep adding units to the electric bus fleet. Two-wheelers use small packs but sell in high numbers across South and Southeast Asia, which makes the electric two-wheeler segment an important outlet for compact cells.
How does Application shape demand?
Electric Vehicles account for 40.5% of 2026 value.
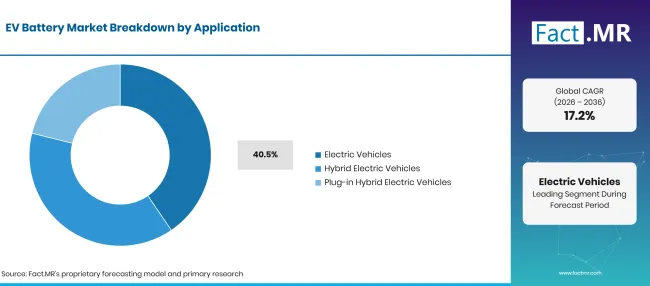
Ev Battery Market Breakdown Application | Source: Fact.MR
| Application | Share (2026) |
|---|---|
| Electric Vehicles (Leading segment) | 40.5% |
| Other segments combined | 59.5%* |
| Total | 100.0% |
Source: Fact.MR analysis. Updated Nov 5, 2026
Fully electric vehicles carry no combustion engine, so the battery supplies all propulsion energy. This design needs the most capacity per vehicle and the most demanding thermal control. Packs also rely on a battery management system to balance cells, track health and protect against overcharging. Hybrid and plug-in hybrid vehicles use smaller packs, yet they keep selling in volume. Hybrid, battery-electric and plug-in hybrid models took about 22% of United States light-duty sales in 2025, up from 20% in 2024 [4]. Battery requirements in these vehicles depend on how far each model can drive on electricity alone.
What leads the Battery Capacity segment?
50-110 kWh takes 42.6% of 2026 demand.
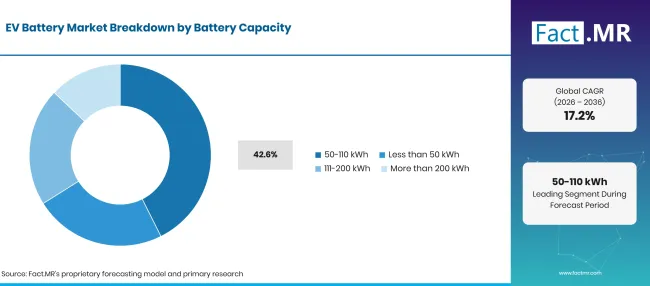
Ev Battery Market Breakdown Battery Capacity | Source: Fact.MR
| Battery Capacity | Share (2026) |
|---|---|
| 50-110 kWh (Leading segment) | 42.6% |
| Other segments combined | 57.4%* |
| Total | 100.0% |
Source: Fact.MR analysis. Updated Nov 5, 2026
Mainstream electric cars need enough stored energy for a full day of mixed driving, and packs in this band deliver it. Going bigger adds weight, cost and charging time. Many automakers offer two pack sizes within this range on the same model. Packs below 50 kWh serve city cars, plug-in hybrids and two-wheeler platforms. The 111-200 kWh and above 200 kWh bands belong mostly to vans, trucks and buses, where daily mileage justifies the extra capacity.
What is accelerating EV Battery Market adoption, and what is holding it back?
Rising electric vehicle sales, new cell plants and steady chemistry gains are driving demand. Restraints come from the capital needed for a gigafactory and from swings in lithium and nickel prices. Concentration of cell and material output in a few countries adds supply risk for automakers in Europe and North America.
Drivers Impact Analysis
| DRIVER | (~) % IMPACT ON CAGR | GEOGRAPHIC RELEVANCE | IMPACT TIMELINE |
|---|---|---|---|
| More battery-electric passenger cars leaving production lines worldwide | +4.2% | Global | Medium term (2-4 years) |
| New lithium-ion cell plants near automaker assembly sites | +3.1% | East Asia, Europe, North America | Medium term (2-4 years) |
| Packs with higher energy density and faster charging | +2.4% | Global | Long term (>=4 years) |
| Delivery vans, buses and trucks switching to electric drive | +1.8% | Global | Medium term (2-4 years) |
Source: Fact.MR analysis. Updated Nov 5, 2026
Opportunity Impact Analysis
| OPPORTUNITY | (~) % IMPACT ON CAGR | GEOGRAPHIC RELEVANCE | IMPACT TIMELINE |
|---|---|---|---|
| Solid-state cells entering production for premium models | +1.2% | Japan, South Korea, Europe | Long term (>=4 years) |
| Lower-cost LFP packs bringing electric cars to entry price points | +0.9% | Global | Medium term (2-4 years) |
| Battery passport data supporting second-life and recycling services | +0.6% | Europe, North America, East Asia | Long term (>=4 years) |
| Heavy-duty packs designed for electric trucks and buses | +0.4% | Global | Medium term (2-4 years) |
Source: Fact.MR analysis. Updated Nov 5, 2026
Restraints Impact Analysis
| RESTRAINT | (~) % IMPACT ON CAGR | GEOGRAPHIC RELEVANCE | IMPACT TIMELINE |
|---|---|---|---|
| Heavy capital outlay for a new cell manufacturing plant | -1.2% | Global | Short term (<=2 years) |
| Price swings in lithium, nickel and other battery minerals | -1.0% | Global | Medium term (2-4 years) |
| Cell and material output concentrated in a few countries | -0.7% | Global | Long term (>=4 years) |
| Thermal safety risks in high-capacity packs | -0.4% | Global | Medium term (2-4 years) |
Source: Fact.MR analysis. Updated Nov 5, 2026
Which countries are scaling the EV Battery Market through 2036?
| Country | CAGR (2026 to 2036) |
|---|---|
| Germany | 19.8% |
| Brazil | 18.1% |
| United States | 16.3% |
| United Kingdom | 14.6% |
| Japan | 12.9% |
Source: Fact.MR analysis. Updated Nov 5, 2026
What supports EV battery adoption in Germany?
19.8% CAGR, supported by automaker model conversions and new domestic cell plants.
German automakers are moving whole model ranges to battery-electric platforms, and suppliers are adding pack assembly near their plants. Just over 545,100 battery-electric cars were newly registered in Germany in 2025, equal to 19.1% of all new car registrations [5]. Battery-electric and plug-in hybrid cars together took 30.0% of new registrations, up from 20.3% in 2024 [5]. That jump in one year shows how quickly local pack demand is rising.
How is Brazil developing demand?
18.1% CAGR, helped by the MOVER program and fresh investment in electrified vehicle lines.
Brazil’s car industry is adding hybrid and electric models to local production lines. Decree No. 12,435 of 15 April 2025 regulates the Green Mobility and Innovation Program (MOVER) and sets energy efficiency and recyclability requirements for new vehicles sold or imported from 1 June 2025 [6]. Cradle-to-grave carbon footprint requirements will apply from 1 January 2027 under the same decree [6].
What is supporting United States adoption?
16.3% CAGR, backed by a large vehicle base and new domestic cell capacity.
The United States has a large light vehicle fleet and a growing network of cell plants in the Midwest and South. Battery-electric vehicles were 7.2% of model year 2024 vehicle production, and plug-in hybrids added 2.5%, according to the EPA [7]. Buyer demand weakened after tax credits expired in late 2025, which tempers near-term growth [4]. Hybrid sales keep rising, and that still adds demand for smaller packs.
How is the United Kingdom developing demand?
14.6% CAGR, reflecting a growing zero emission fleet and new gigafactory capacity.
The United Kingdom had 1,505,000 zero emission cars licensed at the end of June 2025, which was 38% more than a year earlier [8]. Local cell supply is also expanding. In May 2025, the government announced GBP 1 billion of financing for a new AESC gigafactory in Sunderland that can supply batteries for up to 100,000 electric vehicles a year [9]. The plant will create 1,000 jobs and raise national capacity six-fold [9].
What supports Japan’s EV battery growth?
12.9% CAGR, owing to national battery targets and solid-state research.
Japan has deep experience in cell chemistry and supplies batteries to automakers worldwide. Hybrids still take much of the home market, so full-electric demand grows from a lower base. In June 2026, METI revised its battery strategy as the Battery and Power Industry Strategy, which targets a domestic manufacturing base of 150 GWh a year between 2030 and the mid-2030s [10]. It also aims for full-scale commercialization of all-solid-state batteries around 2030 [10].
Who leads the EV Battery Market?
Competition runs on three fronts: cost per kilowatt-hour, energy density and the ability to build plants where automakers assemble cars. Chinese cell makers CATL, BYD and CALB compete on scale and LFP cost, and they now take that model abroad. CATL began trial operations in its new cell building in Debrecen, Hungary, in September 2026 [11].
The plant is designed for 100 GWh once complete [11]. Korean and Japanese suppliers such as LG Energy Solution, Samsung SDI and Panasonic Energy built their positions on nickel-rich cells for long-range cars and long supply contracts with Western automakers. LG Energy Solution has widened its offer with LFP pouch cells for Ampere, the EV unit of Renault Group, its first large-scale LFP supply contract for EVs [12]. A123 Systems and GS Yuasa serve narrower niches, including high-voltage hybrid packs and 48V systems. Through 2036, the edge will go to suppliers that can run several chemistries on one line and keep pack costs falling.
Which companies are the key providers?
Key companies in the EV Battery Market include CATL, BYD, LG Energy Solution, Panasonic Energy, Samsung SDI, CALB, A123 Systems and GS Yuasa.
- CATL
- BYD
- LG Energy Solution
- Panasonic Energy
- Samsung SDI
- CALB
- A123 Systems
- GS Yuasa
Bibliography
- [1] International Energy Agency. (2026). Global EV Outlook 2026: Executive summary.
- [2] European Commission. (2025, March 5). Commission boosts European automotive industry’s global competitiveness.
- [3] European Parliament and Council of the European Union. (2025, July 31). Regulation (EU) 2023/1542 concerning batteries and waste batteries, consolidated version.
- [4] U.S. Energy Information Administration. (2026, February 9). Electric vehicle sales fell as hybrid vehicle sales continued to rise in 2025.
- [5] Statistisches Bundesamt (Destatis). (2026, January 22). E-Autos und Plug-in-Hybride: Ausstattung in Haushalten hängt stark vom Einkommen ab.
- [6] Senado Federal. (2025, April 15). Decreto nº 12.435, de 15 de abril de 2025.
- [7] U.S. Environmental Protection Agency. (2026, February). The 2025 EPA Automotive Trends Report: Fuel Economy and Technology since 1975.
- [8] Department for Transport. (2025, October 15). Vehicle licensing statistics: April to June 2025.
- [9] HM Treasury. (2025, May 9). Another boost for British car industry as £1 billion secured for new Sunderland gigafactory.
- [10] Ministry of Economy, Trade and Industry. (2026, June 2). "Battery Industry Strategy" Revised as the "Battery and Power Industry Strategy".
- [11] CATL. (2026, September 22). CATL Debrecen Kicks Off Trial Operations in its New Cell Building.
- [12] LG Energy Solution. (2026, October 15). LFP Battery Deep Dive: Advancing Battery Innovation for EV and ESS Applications.
This Report Answers
- How is revenue split between lithium-ion, solid-state, nickel-metal hydride and lead-acid batteries?
- Why do passenger cars carry most battery spending, and how fast are trucks and buses catching up?
- What separates battery demand in fully electric vehicles from hybrids and plug-in hybrids?
- Which pack sizes suit city cars, mainstream models and heavy vehicles?
- How are LFP chemistry, solid-state cells and battery passport rules changing supplier choice?
- Where in Germany, Brazil, the United States, the United Kingdom and Japan will battery demand grow, and what policy measures support it?
What does the EV Battery Market cover?
This study tracks rechargeable batteries that power road vehicles through stored electrical energy. Lithium-ion, solid-state, nickel-metal hydride and lead-acid batteries form the main chemistry groups.
Value is measured at the level of cells and complete packs sold to vehicle makers. Revenue is split by vehicle type, by application and by four capacity bands from below 50 kWh to above 200 kWh.
What is included in the scope?
Traction battery cells and modules sold to automakers for battery-electric, hybrid and plug-in hybrid vehicles.
Complete battery packs fitted to passenger cars, commercial vehicles, buses and two-wheelers.Battery management and thermal control parts when sold as an integral part of a traction pack.Replacement traction packs sold through automaker service networks.
What is excluded from the scope?
Raw and refined battery minerals such as lithium, nickel, cobalt, graphite and manganese.Stationary energy storage batteries and consumer electronics cells not built for vehicle propulsion.
Charging stations, electric motors, inverters and vehicle assembly services.Standalone battery recycling and second-life services.
How Was the Analysis Built?
The analysis draws on 120+ sources, 35+ company portfolios, 25+ countries, and more than 20 industry interviews.
- Primary Research: Primary research includes discussions with manufacturers, service providers, technology developers, distributors, end users, and subject-matter experts. These conversations examine purchasing priorities, product adoption, operational challenges, approval requirements, competitive positioning, and the factors that influence wider market acceptance.
- Desk Research: Desk research covers government statistics, regulatory publications, company filings, trade data, technical studies, industry associations, standards, public policy, and other authoritative sources. Every source used in the analysis is documented in the bibliography.
- Market Sizing and Forecasting: Market estimates combine historical performance, demand indicators, pricing and volume trends, segment shares, company participation, country-level growth, adoption patterns, investment activity, and barriers to market expansion.
- Data Validation and Update Cycle: Findings are validated by comparing primary interviews with public data, company activity, regulatory changes, trade patterns, and industry developments. Regular updates review new product launches, capacity changes, partnerships, approvals, and shifts in commercial adoption.
Segmentation
What is the report’s scope and coverage?
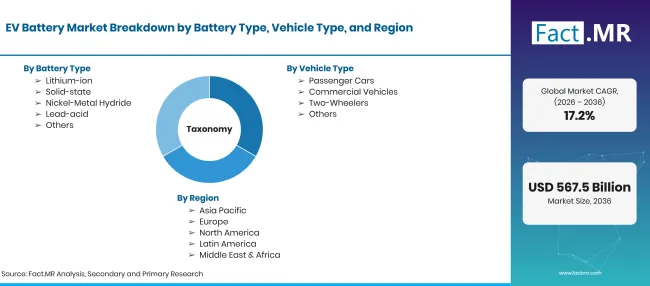
Ev Battery Market Taxonomy | Source: Fact.MR
| Attribute | Details |
|---|---|
| Quantitative Units | USD billion |
| Market Definition | Rechargeable traction batteries, as cells and assembled packs, that store and deliver energy for the propulsion of electric and electrified road vehicles. |
| Battery Type | Lithium-ion; Solid-state; Nickel-Metal Hydride; Lead-acid; Others |
| Vehicle Type | Passenger Cars; Commercial Vehicles; Two-Wheelers; Others |
| Application | Electric Vehicles; Hybrid Electric Vehicles; Plug-in Hybrid Electric Vehicles |
| Battery Capacity | Less than 50 kWh; 50-110 kWh; 111-200 kWh; More than 200 kWh |
| Regions Covered | North America; Latin America; Western Europe; Eastern Europe; East Asia; South Asia & Pacific; Middle East & Africa |
| Countries Covered | Germany; Brazil; United States; United Kingdom; Japan |
| Companies Profiled | CATL; BYD; LG Energy Solution; Panasonic Energy; Samsung SDI; CALB; A123 Systems; GS Yuasa |
| Forecast Period | 2026 to 2036 |
| Approach | Hybrid top-down and bottom-up model built from electric vehicle production by country, pack capacity per vehicle, chemistry mix and cell plant capacity. |
Source: Fact.MR analysis. Updated Nov 5, 2026
How is the market segmented?
-
By Battery Type
- Lithium-ion
- Solid-state
- Nickel-Metal Hydride
- Lead-acid
- Others
-
By Vehicle Type
- Passenger Cars
- Commercial Vehicles
- Two-Wheelers
- Others
-
By Application
- Electric Vehicles
- Hybrid Electric Vehicles
- Plug-in Hybrid Electric Vehicles
-
By Battery Capacity
- Less than 50 kWh
- 50-110 kWh
- 111-200 kWh
- More than 200 kWh
-
By Region
- North America
- Latin America
- Western Europe
- Eastern Europe
- East Asia
- South Asia & Pacific
- Middle East & Africa
Frequently Asked Questions
How large is the EV battery market in 2026?
What growth rate will the EV battery market record?
Which battery type leads?
Which vehicle type leads?
Which application leads?
Which battery capacity range leads?
Which country will grow quickest?
Who are the main companies?
What holds the market back?
Who worked on this report


Preview the report firsthand - request a free sample
Free SampleGet the brochure for pricing and purchase details
Download PDF