- Market Value (2025): USD 207.9 Mn
- Estimated Value (2026): USD 224.7 Mn
- Forecast Value (2036): USD 489.2 Mn
- CAGR (2026-2036): 8.1%
What is the Gear Design Software Market forecast to be worth by 2036?
USD 224.7 million in 2026 to USD 489.2 million by 2036 at an 8.1% CAGR.
- According to Fact.MR estimates, the gear design software market was valued at USD 207.9 million in 2025.
- Market value is projected to rise from USD 224.7 million in 2026 to USD 489.2 million by 2036.
- The market is projected to grow at a 8.1% CAGR from 2026 to 2036 as manufacturers use digital engineering tools to develop and validate gear systems.
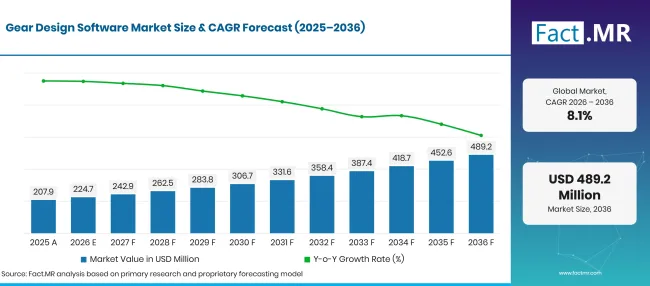
Gear Design Software Market Forecast Global | Source: Fact.MR
| Year | Basis | Market Value (USD million) |
|---|---|---|
| 2025 | Actual | 207.9 |
| 2026 | Estimate | 224.7 |
| 2036 | Forecast | 489.2 |
| CAGR 2026 to 2036 | Forecast period | 8.1% |
Source: Fact.MR analysis. Updated Oct 31, 2026
What are the defining numbers behind Gear Design Software Market growth?
USD 264.5 million absolute opportunity between 2026 and 2036.
- Demand Drivers in the Market
- Automotive manufacturers require accurate gear calculations to develop transmissions for conventional and electric vehicles. The VDA reported that Germany produced approximately 4.15 million passenger cars in 2025, supporting demand for engineering tools used in vehicle development and component validation [1].
- Gearbox designers need to evaluate tooth contact, durability, noise and vibration before physical production. Software such as MASTA and Romax supports transmission-level analysis and helps engineers assess the interaction of gears, shafts and bearings during operation [2] [3].
- Industrial machinery manufacturers use gear design software to develop drive systems for equipment operating under different loads and speeds. Digital modeling helps engineers compare gear configurations and identify potential design issues before manufacturing.
- Aerospace and energy applications require reliable transmission components under demanding operating conditions. Simulation and optimization software helps engineers assess gear strength and operating behavior before equipment enters service.
- Key Segments Analyzed
- By Component, Software will account for 62.4% of the market in 2026, reflecting the importance of calculation, modeling and simulation applications.
- By Deployment Mode, On-Premises leads with 71.0% of the market in 2026 as engineering organizations use installed software for specialized design and analysis workflows.
- By Application, Automotive is projected to account for a 35.7% share in 2026, supported by transmission and drivetrain engineering requirements.
- By End-User, Manufacturing holds 35.7% of the market in 2026 as industrial companies use gear design tools to develop and validate mechanical systems.
- Analyst Opinion at Fact.MR
- Shambhu Nath Jha, Principal Consultant at Fact.MR, states, “Gear design software is becoming an important part of mechanical product development as manufacturers seek to validate transmission performance before production. Engineers need tools that connect gear calculations with system-level simulation and manufacturing requirements. Providers that combine accurate calculations with practical CAD and engineering workflows can strengthen adoption across automotive and industrial applications.”
- Strategic Implications
- Software developers should strengthen gear geometry calculations and support recognized international design standards to improve engineering reliability.
- Automotive engineering teams need to use transmission simulation to evaluate efficiency, durability and noise characteristics during drivetrain development.
- Manufacturers must connect design software with production and inspection systems to reduce differences between modeled and manufactured gear geometry.
- Providers need to improve CAD interoperability and data exchange to support engineering teams using multiple design and simulation applications.
- Software vendors can provide technical training and application support for engineers working with specialized gear systems.
Germany is set to record a 10.0% CAGR through 2036. Brazil is set to post 9.1%, followed by the USA at 8.3%. The UK is estimated to advance at 7.4%, while Japan is forecast at 6.5%.
How does the Gear Design Software Market break down by segment?
In Fact.MR’s segmentation, Software leads Component at 62.4%; On-Premises leads Deployment Mode at 71.0%; Automotive leads Application at 35.7%; and Manufacturing leads End-User at 35.7%.
Which Component dominates?
Software is projected to account for 62.4% of the market in 2026.
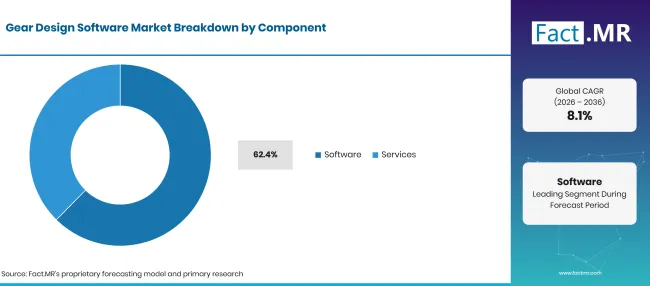
Gear Design Software Market Breakdown Component | Source: Fact.MR
| Component | Share (2026) |
|---|---|
| Software (Leading segment) | 62.4% |
| Other segments combined | 37.6%* |
| Total | 100.0% |
Source: Fact.MR analysis. Updated Oct 31, 2026
Software accounts for the largest component share because gear design depends on calculation and simulation applications. Engineers use these tools to define gear geometry and evaluate strength, contact conditions and operating performance. Services support implementation, customization, training and technical assistance.
What leads the Deployment Mode segment?
On-Premises is projected to account for 71.0% of the market in 2026.
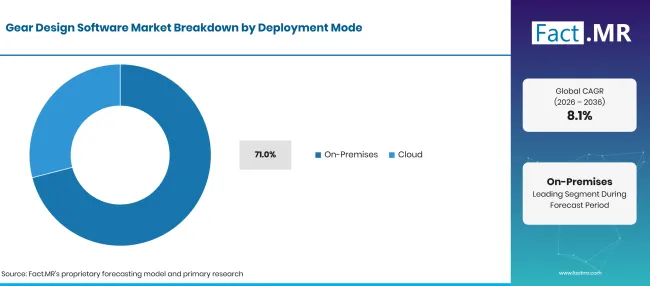
Gear Design Software Market Breakdown Deployment Mode | Source: Fact.MR
| Deployment Mode | Share (2026) |
|---|---|
| On-Premises (Leading segment) | 71.0% |
| Cloud | 29.0%* |
| Total | 100.0% |
Source: Fact.MR analysis. Updated Oct 31, 2026
On-premises deployment leads because specialized engineering applications often require controlled computing environments and integration with existing CAD and simulation systems. Engineering teams may also prefer locally managed software for handling complex models and proprietary design information. Cloud deployment can support distributed collaboration and access to engineering applications without relying entirely on local infrastructure.
Which Application leads demand?
Automotive is likely to account for a 35.7% share in 2026.
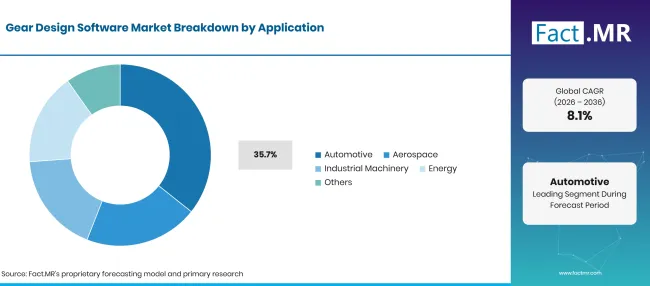
Gear Design Software Market Breakdown Application | Source: Fact.MR
| Application | Share (2026) |
|---|---|
| Automotive (Leading segment) | 35.7% |
| Other segments combined | 64.3%* |
| Total | 100.0% |
Source: Fact.MR analysis. Updated Oct 31, 2026
Automotive represents the leading application segment as manufacturers use gear design software to develop vehicle transmissions and drivetrain systems. Gear geometry and contact analysis help engineers evaluate the performance of transmission components under different operating conditions. Aerospace and industrial machinery applications also require specialized gear calculations for reliable power transmission. Energy applications create demand for software used in wind turbine gearboxes and other mechanical drive systems.
Which End-User category dominates?
Manufacturing is projected to represent a 35.7% share in 2026.
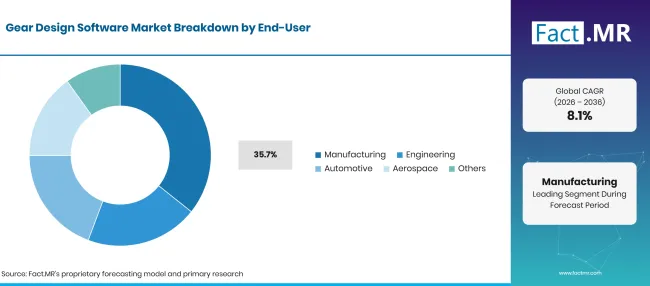
Gear Design Software Market Breakdown End User | Source: Fact.MR
| End-User | Share (2026) |
|---|---|
| Manufacturing (Leading segment) | 35.7% |
| Other segments combined | 64.3%* |
| Total | 100.0% |
Source: Fact.MR analysis. Updated Oct 31, 2026
Manufacturing accounts for the largest end-user share because industrial companies use gear design applications throughout mechanical product development. Engineers can assess gear strength and durability before components move into production. Engineering service providers also use specialized software for design validation and transmission optimization. Automotive and aerospace organizations require additional capabilities for complex drivetrain and power transmission applications.
What is accelerating Gear Design Software Market adoption, and what is holding it back?
Demand for accurate engineering simulation and shorter product development cycles supports adoption, while software costs and specialist skill requirements create challenges.
Drivers Impact Analysis
| DRIVER | (~) % IMPACT ON CAGR | GEOGRAPHIC RELEVANCE | IMPACT TIMELINE |
|---|---|---|---|
| Automotive transmission development | +1.0% | Europe, Asia, North America | Medium term (2–4 years) |
| Growing use of electric drivetrains | +0.9% | Global | Medium term (2–4 years) |
| Need for gearbox performance simulation | +0.7% | Global | Short to medium term (2–4 years) |
| Industrial machinery modernization | +0.5% | Europe, Asia, Americas | Long term (≥ 4 years) |
| Greater focus on design validation before production | +0.4% | Global | Short term (≤ 2 years) |
Source: Fact.MR analysis. Updated Oct 31, 2026
Opportunity Impact Analysis
| OPPORTUNITY | (~) % IMPACT ON CAGR | GEOGRAPHIC RELEVANCE | IMPACT TIMELINE |
|---|---|---|---|
| Gearbox simulation for electric vehicles | +0.8% | Europe, China, USA | Medium term (2–4 years) |
| Integration of design and manufacturing software | +0.6% | Global | Medium term (2–4 years) |
| Cloud-based engineering collaboration | +0.5% | Global | Long term (≥ 4 years) |
| Advanced gear optimization and digital twins | +0.4% | Global | Long term (≥ 4 years) |
| Wind turbine and industrial gearbox development | +0.3% | Europe, Asia, Americas | Long term (≥ 4 years) |
Source: Fact.MR analysis. Updated Oct 31, 2026
Restraints Impact Analysis
| RESTRAINT | (~) % IMPACT ON CAGR | GEOGRAPHIC RELEVANCE | IMPACT TIMELINE |
|---|---|---|---|
| High software licensing and implementation costs | -0.8% | Global | Short term (≤ 2 years) |
| Shortage of specialized gear design engineers | -0.6% | Global | Medium term (2–4 years) |
| Complexity of integrating engineering applications | -0.5% | Global | Medium term (2–4 years) |
| Training requirements for advanced simulation tools | -0.4% | Global | Short term (≤ 2 years) |
| Dependence on specialized engineering data | -0.3% | Global | Long term (≥ 4 years) |
Source: Fact.MR analysis. Updated Oct 31, 2026
Which countries are scaling the Gear Design Software Market through 2036?
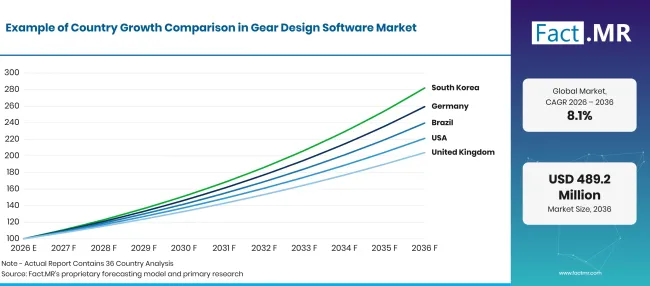
Gear Design Software Market Growth Index | Source: Fact.MR
| Country | CAGR (2026–2036) |
|---|---|
| Germany | 10.0% |
| Brazil | 9.1% |
| USA | 8.3% |
| UK | 7.4% |
| Japan | 6.5% |
Source: Fact.MR analysis. Updated Oct 31, 2026
What supports Germany adoption?
10.0% CAGR, supported by automotive engineering and advanced industrial manufacturing.
Germany has a strong automotive and machinery engineering base. The country's automotive manufacturers and component suppliers require software for gear geometry development, transmission simulation and design validation. Engineering software providers can address demand through specialized calculation tools and integration with manufacturing workflows.
How is Brazil developing gear design software adoption?
9.1% CAGR, led by automotive production and industrial equipment development.
Brazil's automotive manufacturing sector provides a base for gear design software demand. Anfavea reported that vehicle production reached 2.644 million units in 2025, an increase of 3.5% from the previous year [4]. Automotive suppliers and industrial equipment manufacturers require engineering tools to develop and validate mechanical transmission components. Software providers can support adoption through localized technical assistance and solutions suited to manufacturing workflows.
What supports United States adoption?
8.3% CAGR, backed by automotive, aerospace and industrial engineering requirements.
The United States has a broad engineering ecosystem covering vehicle development, aerospace systems and industrial machinery. Gear design software is used to evaluate transmission performance and improve the reliability of mechanical components. Demand is supported by the need to simulate gear contact, fatigue and vibration before manufacturing. Providers with integrated CAD and CAE capabilities can serve engineering teams working across different industrial applications.
How is the United Kingdom building adoption?
7.4% CAGR, shaped by automotive engineering and specialist manufacturing.
The UK has an established automotive and engineering base with a network of component manufacturers and technical suppliers. SMMT reported that UK factories produced 764,715 cars and commercial vehicles in 2025, alongside 1.60 million engines [5]. Gear design software can support the development of transmission systems and mechanical components for automotive and industrial applications. Specialized software suppliers can also serve engineering consultancies and manufacturers working on complex drivetrain projects.
What supports Japan adoption?
6.5% CAGR, driven by automotive manufacturing and mechanical engineering investment.
Japan's automotive industry remains an important source of demand for gear design and transmission engineering software. The Japan Automobile Manufacturers Association reported that the country's automotive manufacturing shipments reached approximately JPY 72.9 trillion in 2024. Automotive-related research and development expenditure reached approximately JPY 5.0 trillion during the same year [6]. These engineering activities support demand for software used in gear design, drivetrain simulation and mechanical system validation.
Who leads the Gear Design Software Market?
Fact.MR identifies Gleason Corporation, Hexagon AB, Smart Manufacturing Technology, Klingelnberg AG, Dontyne Systems and Siemens as active providers of gear design and transmission engineering software.
Gleason Corporation participates through KISSsoft and GEMS, which support gear calculation, transmission modeling and gear manufacturing workflows. KISSsoft is a modular software platform for the design, optimization and verification of machine elements. Its gear modules support strength calculations and transmission design. Gleason also offers GEMS for bevel gear design and manufacturing optimization. KISSsoft is a wholly owned subsidiary of Gleason [7][8].
Hexagon offers Romax for gearbox and powertrain design and simulation. Smart Manufacturing Technology provides MASTA for transmission design and analysis. Klingelnberg offers KIMoS for bevel gear design and manufacturing process optimization. Klingelnberg AG company revealed that KIMoS supports the design and optimization of spiral bevel gears. Its capabilities include geometry dimensioning, manufacturing simulation, tooth contact analysis and production data preparation [9].
Dontyne Systems provides its Gear Production Suite for gear design, analysis and production. Siemens offers Designcenter software with machine design and gear-related engineering capabilities. Dontyne Systems announced that Gear Production Suite includes Gear Design Pro for defining gear geometry and rating gear pairs against recognized standards. Its other modules support load analysis, gearbox design and manufacturing process simulation. The company also reports continued software updates and customer support [10]. Siemens AG company announced Designcenter includes machine design capabilities and specialized tools for gear design and CAM workflows. Its industrial machinery design offering supports engineering tasks across mechanical equipment development [11].
Autodesk, Dassault Systèmes, PTC, Ansys, Altair and SolidWorks also offer broader CAD or CAE capabilities that can support mechanical and gear-related design workflows. SolidWorks Toolbox gears are described in its documentation as machine-design representations rather than true involute gears intended for manufacturing [12].
Commercial competition depends on calculation accuracy, engineering standards support, transmission simulation capabilities and integration with manufacturing systems. Specialist providers compete through detailed gear analysis and design-to-production workflows. Broader CAD and CAE suppliers compete through their ability to connect mechanical design with simulation and product engineering.
Which companies are the key providers?
Key companies include Gleason Corporation (KISSsoft); Hexagon AB (Romax); Smart Manufacturing Technology (MASTA); Klingelnberg AG (KIMoS); Dontyne Systems; and Siemens AG (Designcenter).
- Gleason Corporation
- Hexagon AB
- Smart Manufacturing Technology
- Klingelnberg AG
- Dontyne Systems
- Siemens AG
Bibliography
- [1] Verband der Automobilindustrie. (2026, January 5). Passenger car production in 2025 slightly above previous year's level.
- [2] Smart Manufacturing Technology. (n.d.). MASTA: Transmission design, analysis and optimisation.
- [3] Hexagon. (n.d.). Romax is now on MSCOne
- [4] Associação Nacional dos Fabricantes de Veículos Automotores. (2026, January 15). Produção e venda de autoveículos crescem em 2025 e Anfavea projeta nova alta em 2026
- [5] Society of Motor Manufacturers and Traders. (2026, January 29). Tough year for Auto but new models and Industrial Strategy can deliver growth
- [6] Japan Automobile Manufacturers Association. (n.d.).[Automotive manufacturing as a key industry]
- [7] KISSsoft. (n.d.). Product overview.
- [8] KISSsoft. (n.d.). About KISSsoft.
- [9] Klingelnberg AG. (n.d.). KIMoS: Geometry, process, and tool design for bevel gears.
- [10] Dontyne Systems. (n.d.). Gear Production Suite.
- [11] Siemens. (n.d.). Industrial equipment machine design with CAD software.
- [12] Dassault Systèmes. (2026). Gears. SOLIDWORKS Design Help.
This Report Answers
- The report describes how gear design software supports mechanical design, gear calculation and transmission simulation.
- Component analysis compares software and services.
- Deployment analysis examines on-premises and cloud-based engineering applications.
- Application analysis covers automotive, aerospace, industrial machinery and energy.
- End-user analysis compares manufacturing, engineering, automotive and aerospace organizations.
- Country analysis discusses Germany, Brazil, USA, UK and Japan alongside industrial and automotive statistics.
- The competitive overview profiles six companies with identifiable gear design or transmission engineering products.
What does the Gear Design Software Market cover?
The market covers software used to develop, calculate, simulate and optimize gear systems. It includes applications for gear geometry design, strength calculations, transmission modeling and performance analysis. The scope considers tools used in automotive, aerospace, industrial machinery and energy applications. It also covers software deployment through on-premises and cloud-based environments.
What is included in the scope?
Included products support the design and analysis of gears and transmission systems.
The scope covers gear geometry calculation, gear strength and durability assessment, contact analysis, transmission simulation and design optimization. It also includes services associated with software implementation, customization, training and technical support.
What is excluded from the scope?
The analysis excludes physical gears, gearboxes, bearings and other mechanical components sold as hardware.
General-purpose CAD software without identifiable gear design or transmission engineering functionality is outside the narrowly defined product boundary. Manufacturing machinery and inspection equipment are also excluded unless their value is directly attributable to the included software products. Engineering consultancy revenue unrelated to software is not included.
How Was the Analysis Built?
The analysis draws on 120+ sources, 35+ company portfolios, 25+ countries, and more than 20 industry interviews.
- Primary Research: Primary research includes discussions with gear software developers, engineering solution providers, automotive manufacturers, industrial machinery companies, transmission designers, engineering consultants and subject-matter experts. These conversations examine software adoption, calculation requirements, product integration, technical challenges and competitive positioning.
- Desk Research: Desk research covers company product portfolios, software documentation, annual reports, engineering publications, automotive industry statistics, manufacturing data, technical standards and industry associations. Every source used in the analysis is documented in the bibliography.
- Market Sizing and Forecasting: Market estimates combine historical performance, software adoption trends, product pricing, deployment preferences, segment shares, company participation, country-level growth and barriers to market expansion.
- Data Validation and Update Cycle: Findings are validated by comparing primary interviews with public data, company product updates, software releases, engineering partnerships and changes in industrial demand. Regular updates review new modules, simulation capabilities, product integrations and changes in commercial adoption.
Segmentation
What is the report's scope and coverage?
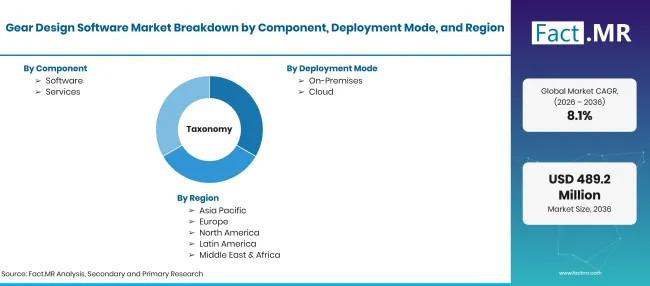
Gear Design Software Market Taxonomy | Source: Fact.MR
| Attribute | Details |
|---|---|
| Quantitative Units | USD million |
| Market Definition | The gear design software market comprises specialized engineering software used to design and analyze gear systems across automotive, aerospace, industrial machinery and other applications. |
| Component | Software; Services |
| Deployment Mode | On-Premises; Cloud |
| Application | Automotive; Aerospace; Industrial Machinery; Energy; Others |
| End-User | Manufacturing; Engineering; Automotive; Aerospace; Others |
| Regions Covered | North America; Latin America; Western Europe; Eastern Europe; East Asia; South Asia & Pacific; Middle East & Africa |
| Countries Covered | Germany; Brazil; USA; UK; Japan |
| Companies Profiled | Gleason; Hexagon; Smart Manufacturing Technology; Klingelnberg; Dontyne Systems; Siemens |
| Forecast Period | 2026 to 2036 |
| Approach | Market segmentation and scenario-based analysis supported by company product portfolios and industrial statistics |
Source: Fact.MR analysis. Updated Oct 31, 2026
How is the market segmented?
-
By Component
- Software
- Services
-
By Deployment Mode
- On-Premises
- Cloud
-
By Application
- Automotive
- Aerospace
- Industrial Machinery
- Energy
- Others
-
By End-User
- Manufacturing
- Engineering
- Automotive
- Aerospace
- Others
-
By Region
- North America
- Latin America
- Western Europe
- Eastern Europe
- East Asia
- South Asia & Pacific
- Middle East & Africa
Frequently Asked Questions
How big is the Gear Design Software Market in 2026?
What is the CAGR from 2026 to 2036?
Which component has the largest share?
Which deployment mode leads?
Which application has the largest share?
Which end-user category leads?
Which country is projected to grow fastest among the listed markets?
Which companies are covered?
Who worked on this report


Preview the report firsthand - request a free sample
Free SampleGet the brochure for pricing and purchase details
Download PDF