Gimbal Stabilizers Market

Gimbal Stabilizers Market Analysis, By Device Use (Smartphones, Gimbal Cameras, and others), By Axis Rotation, By Mounting, By Sales Channel, and By Region- Market Insights 2025 to 2035

The Gimbal cameras segment is projected to grow at a CAGR of 7.4%, whereas another segment Action Cameras is likely to grow at 6.6%. In terms of countries China is projected to grow at 6.4%, followed by USA at 5.1% and Japan to grow at 5.8%

Gimbal Stabilizers Market Outlook (2025 to 2035)

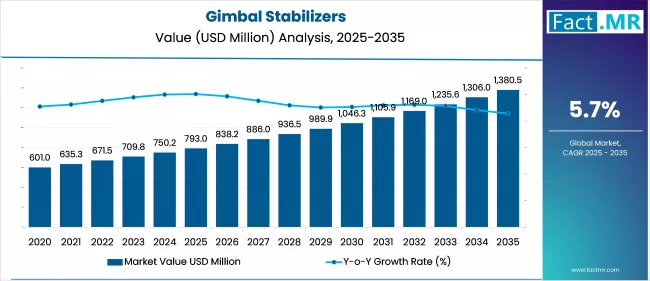
The global gimbal stabilizers market is expected to reach USD 1,380 million by 2035, up from USD 750 million in 2024. During the forecast period (2025–2035), the industry is projected to expand at a CAGR of 5.7%.

The market is expanding in response to increased content production, supported by vloggers and social media users seeking stable, cinema-quality footage. This need is enhanced through the availability of smartphones that have high-resolution cameras whose performance is enhanced with the use of external stabilization devices.

Gimbal Stabilizers By Market Value Analysis

Moreover, due to the increased application of drones in the real estate, agriculture, and surveillance industries, there has been a surge in the demand for integrated gimbal systems to stabilize aerial images.

Quick Facts about Gimbal Stabilizers Market

  • Industry Value (2025): USD 793 Million
  • Projected Value (2035): USD 1,380 Million
  • Forecast CAGR (2025 to 2035): 5.7%
  • Leading Segment (2025): Smartphones (29% Market Share)
  • Country Growth Rate (2025 to 2035): China (6.2% CAGR)
  • Top Key Players: Hohem, Generic, Unmanned Systems Technology, Ikan Corporation, and Adofys

What are the drivers of the gimbal stabilizers market?

Content creation has become widespread, leading vloggers, influencers, and independent filmmakers to focus on tools that can enhance video quality. Gimbal stabilizers provide the smooth cinematic stabilization necessary to achieve professional-style filming and, due to their compact design, are considered practical for capturing action-focused footage without reliance on large, heavy equipment.

Smartphones have become powerful imaging products with a high-resolution image sensor and image processing with AI support. Nonetheless, even handheld shooting leads to unwanted motion, capable of affecting the dynamic or movement-related footage. Gimbal stabilizers address this issue by offering physical stabilization, allowing users to record fluid, shake-free video that complements the optical capabilities of the smartphone without requiring post-production corrections.

There has also been a widespread use of gimbal stabilizers in the drone business, especially in aerial Imaging, Photography, and videography. Gimbals enable clear and steady images when attached to drones, and they have been implemented in such industries as real estate, agriculture, surveying and policing. Since the popularity of high-resolution aerial video cameras is increasing at a steady pace, the gimbal stabilizers remain at the epicenter of ensuring that the image remains clear and rectifies the in-flight movement.

What are the regional trends of the gimbal stabilizers market?

In North America, there is demand for high-performance gimbal stabilizers, influenced by the presence of professional filmmakers, vloggers, and a highly tech-aware consumer base in the United States.

Europe is also experiencing sustained growth owing to the thriving independent film industries, the tourist-supported videography, and the increasing usage of smartphones and drones among consumers in nations such as Germany, France, and the UK.

Asia Pacific continues to lead, and the markets are growing actively, driven by widespread smartphone adoption, an active base of content creators, and the use of drones in agriculture and surveillance in China, India and Southeast Asia.

Growth of social media and low prices of smartphones reinforce moderate acceptability of handheld gimbals, particularly in urban areas of Brazil and Argentina, in Latin America.

What are the challenges and restraining factors of the gimbal stabilizers market?

The highly competitive rates between built-in electronic stabilization devices in smartphones and cameras are a significant threat to the gimbal stabilizers market. As internal systems become more capable and motion correction incorporates AI-based features, casual users may perceive less need to invest in external gimbal devices.

The professional gimbal systems also have a Learning curve in which most customers, particularly new ones, find it difficult to become familiar with the multi-axis gimbal's calibration and operation. This may discourage potential buyers or lead to dissatisfaction if expectations are not aligned with usage complexity.

Another constraint is the comparatively expensive level of the advanced gimbal stabilizers, particularly as they apply to DSLR and film-level cameras. This pricing barrier may restrict accessibility to amateur videographers and content creators in the developing regions where cost-effective options are widely used.

Country-Wise Insights

Dominance of china as a global powerhouse in gimbal stabilizer innovation and consumption

China holds a central position in the global gimbal stabilizers market due to the production capabilities of its manufacturers and the scale of domestic demand. Companies such as DJI are prominent, recognized for their role in innovation and international sales of handheld and drone-based stabilizers.

The rapid growth of vlogging, online streaming, and mobile cinematography among Chinese consumers has increased the need for modern stabilization tools. In addition, widespread smartphone usage and government initiatives promoting smart technology adoption contribute to the ongoing expansion of the market.

With a well-established ecosystem of technology suppliers, competitive pricing, and a large base of content creators, China maintains a strong position in both the technological and commercial segments of the gimbal stabilizer industry.

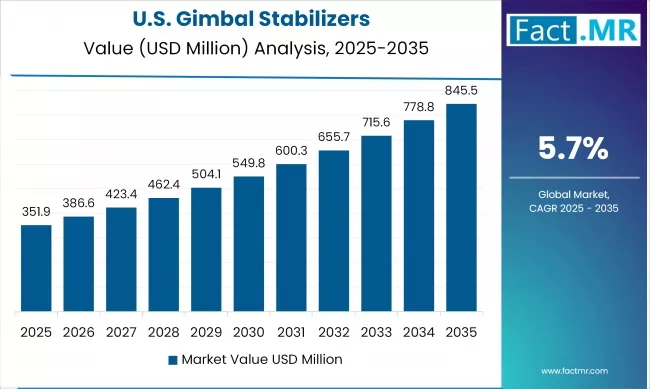
Expanding commercial use and tech-driven adoption of gimbal stabilizers in the U.S. market

Apart from filmmaking and vlogging, the American market for gimbal stabilizers includes enterprise and industrial usages that are expanding steadily. These applications involve real estate agencies that use stabilized walkthrough footage of properties, law enforcement and emergency services that utilize drone-mounted stabilizers for surveillance and disaster assessment purposes.   

The availability of high-order retail structures, such as Amazon and Best Buy, facilitates universal distribution of products and consumer access. Data estimates indicate that North America accounts for over 25 percent of global gimbal stabilizer retail sales, with the United States leading within the region.

Gimbal Stabilizers By Country Value Analysis

This trend aligns with the country’s consistent interest in emerging technologies and widespread adoption practices, contributing to a growing demand for AI-integrated stabilizers with features such as face tracking, auto-calibration, and motion-lapse recording. These patterns suggest that the United States functions not only as a high-value consumer market but also as a testing ground for next-generation stabilization technologies.

Japan’s precision-driven market shaping niche growth for gimbal stabilizers

The gimbal stabilizers market in Japan is influenced by the country’s emphasis on precision and compact technological innovation. Although smaller in scale compared to China or the United States, the Japanese consumer base is selective regarding equipment preferences, favoring high-performance, durable, and lightweight devices, particularly in relation to the mirrorless camera, which has introduced notable change within the Japanese photography sector.

The aging population in the country also determines the demand of easy-to-use and ergonomic stabilizers. Besides, the high exposure of Japan in the consumer electronics and camera industry establishes smooth compatibility and integration with gimbal systems. An increase in the spread of travel vlogging and nature videography, with the help of the scenic diversity offered by Japan, additionally drives the uptake.

The availability of domestic demand is supplemented with research and gimbal development in robotics and sensor technologies, which enable Japan to become a center of gimbal innovation aimed at niche, high-quality solutions focused on professionals and hobbyists with technological skills.

Category-Wise Analysis:

Surging demand for gimbal stabilizers in smartphone-based content creation

Gimbal Stabilizers By Device Use

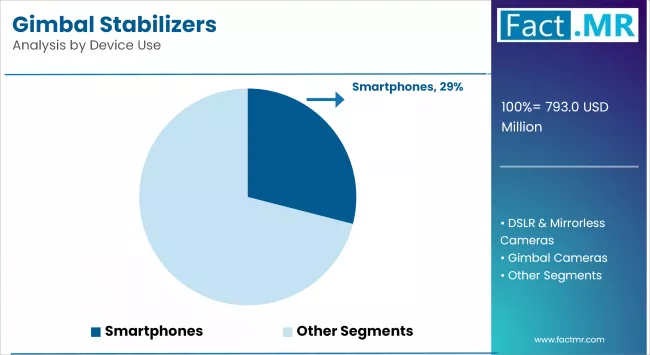
The dominant and rapidly expanding category of device use in the gimbal stabilizers market is smartphones, driven by extensive use of mobile videography and content sharing in real time. With the continued popularity of platforms such as TikTok, YouTube Shorts and Instagram Reels, where stabilized and cinematic video is preferred, hand-tremor reducing gimbals, especially the 3-axis gimbal, are becoming more popular among users of these platforms.

Smartphone gimbals have contributed to the accessibility of filmmaking by providing a compact and economically viable option for content creators and digital media professionals.

Improvements in camera capabilities of the smartphones, added by the increasing frame rates and optical zoom, support the use of gimbals as tools that reduce the gap between informal and professional video recording applications.

Three-Axis gimbals driving precision and professionalism in stabilization technology

Gimbal Stabilizers By Axis Rotation

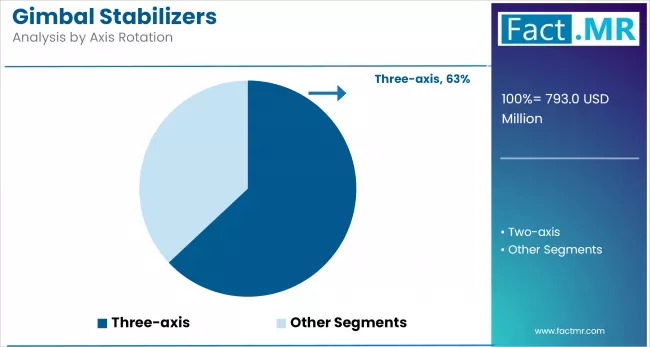
Three-axis gimbals are prevalent in the gimbal stabilizers industry because they provide stabilization across pitch (tilt), roll, and yaw (pan) axes. This setup allows both highly malleable and cinematic shooting, and thus, is the choice of professional videographers and vloggers, as well as drone operators.

These gimbals are capable of correcting multi-directional motion, supporting stable output in dynamic or handheld shooting environments. Three-axis gimbals became more affordable to customers as the brush motors were improved, compact size, and smart motion tracking systems became readily available.

With increased demands for stabilization in social media, commercial video segments, and aerial imaging, the consistent performance and technical reliability of three-axis gimbals maintain their relevance in stabilizer applications.

Handheld gimbals enabling on-the-go cinematography for modern creator

Handheld gimbals have transformed the content production market by providing all users with portable, compact, easy-to-operate, and stabilization equipment to use with their smartphones, action cameras, and DSLRs. Being lightweight and easy to use, they are ideal products for vloggers, filmmakers, journalists, and amateur users to capture stable footage in motion-intensive scenarios.

The compact devices usually have built-in controls, object tracking, and can be connected to a mobile app, allowing for use even in motion-heavy scenes. As real-time content development and mobile-based storytelling continue to expand, handheld gimbals provide a functional benefit by combining cost efficiency with features aligned with professional applications in a compact format.

Competitive Analysis:

The gimbal stabilizers market exhibits high competitive intensity, with key players differentiating through precision-engineered stabilization, AI-enabled smart tracking, and advanced multi-axis motion control systems.

As the consumer base expands to include smartphone users, vloggers, and professional filmmakers, manufacturers are strategically emphasizing compactness, foldability, and weight optimization, while maintaining performance integrity.

Real-time wireless functionality, seamless mobile application integration, and gesture-based control have emerged as critical adoption drivers in an increasingly agile content creation environment.

The Chinese OEMs continue to exert price force pressures on the global rivals compelling them to invest into high grade components such as brushless motors, high resolution encoders and modular hardware.

Moreover, with increased production of the 360-degree and the AR video format, as well as the requirements of immersive storytelling, the focus of research and development is shifting towards the adaptation at a firmware level and the evolution of products.

The leading companies are already using iterative updates with the help of the cloud and rapid prototyping, as well as SDK frameworks, to provide the level of customization to their users. The blending of mechanical accuracy and digital modularity characterizes the technological direction and product development trend in the market.

Key players in the gimbal stabilizers industry include Hohem, Generic, Unmanned Systems Technology, Ikan Corporation, Adofys, FeiyuTech, Glidecam Industries, Inc., Gudsen Technology Co., Ltd., and HIFFIN.

Recent Developments

  • In June 2025, Hohem, a leading Chinese gimbal manufacturer for cameras and mobile phones, unveiled its latest flagship mobile gimbal, the iSteady M7, showcasing continued innovation in smartphone stabilization.
  • In February 2025, DJI announced a new version of the smallest camera stabilizer in its Ronin series. Like last year’s RS 3 Mini, the upgraded RS 4 Mini is a more compact, lighter, and cheaper alternative to DJI’s RS 4 and RS 4 Pro stabilizers.

Fact.MR has provided detailed information about the price points of key manufacturers of the Gimbal Stabilizers Market positioned across regions, sales growth, production capacity, and speculative technological expansion, in the recently published report.

Methodology and Industry Tracking Approach

The global gimbal stabilizers market 2025 report draws insights from over 12,500 professionals including content creators, drone operators, and videographers across more than 30 countries. Conducted between July 2024 and June 2025 through structured survey research, the study evaluates gimbal performance across devices and filming scenarios.

Participants included independent filmmakers, social media influencers, drone pilots, and stabilization system designers. The research focused on compatibility with mobile apps, video platforms, and compliance with international design and safety standards in sectors such as entertainment, sports, real estate, and commercial videography.

Findings were validated through 330 cross-referenced responses and over 300 authoritative sources including camera manuals, consumer electronics benchmarks, and OEM specifications. Quantitative modeling used indexed adoption scores and regression forecasting to measure segment performance and market growth.

With Fact.MR tracking market behavior, product performance, and industry trends since 2018, this report provides a credible reference for stakeholders and strategic planners.

Segmentation of Gimbal Stabilizers Market

  • By Device Use :

    • Smartphones
    • Gimbal Cameras
    • Action Cameras
    • DSLR & Mirrorless Cameras
    • Drone Cameras
  • By Axis Rotation :

    • Two-axis
    • Three-axis
  • By Mounting :

    • Handheld
    • Body Mounted
    • Structure Mounted
  • By Sales Channel :

    • Modern Trade
    • Specialty Store
    • Online Channel
      • Direct to Customer
      • Third Party Online
  • By Region :

    • North America
    • Latin America
    • Western Europe
    • Eastern Europe
    • East Asia
    • South Asia & Pacific
    • Middle East & Africa

Table of Content

  1. Executive Summary
    • Global Market Outlook
    • Demand-side Trends
    • Supply-side Trends
    • Technology Roadmap Analysis
    • Analysis and Recommendations
  2. Market Overview
    • Market Coverage / Taxonomy
    • Market Definition / Scope / Limitations
  3. Market Background
    • Market Dynamics
      • Drivers
      • Restraints
      • Opportunity
      • Trends
    • Scenario Forecast
      • Demand in Optimistic Scenario
      • Demand in Likely Scenario
      • Demand in Conservative Scenario
    • Opportunity Map Analysis
    • Product Life Cycle Analysis
    • Supply Chain Analysis
      • Supply Side Participants and their Roles
        • Producers
        • Mid-Level Participants (Traders/ Agents/ Brokers)
        • Wholesalers and Distributors
      • Value Added and Value Created at Node in the Supply Chain
      • List of Component Suppliers
      • List of Existing and Potential Buyers
    • Investment Feasibility Matrix
    • Value Chain Analysis
      • Profit Margin Analysis
      • Wholesalers and Distributors
    • PESTLE and Porter’s Analysis
    • Regulatory Landscape
      • By Key Regions
      • By Key Countries
    • Production and Consumption Statistics
    • Import and Export Statistics
  4. Global Market Analysis 2020-2024 and Forecast, 2025-2035
    • Historical Market Size Value (USD Mn) & Volume (Units) Analysis, 2020-2024
    • Current and Future Market Size Value (USD Mn) & Volume (Units) Projections, 2025-2035
      • Y-o-Y Growth Trend Analysis
      • Absolute $ Opportunity Analysis
  5. Global Market Pricing Analysis 2020-2024 and Forecast 2025-2035
  6. Global Market Analysis 2020-2024 and Forecast 2025-2035, By Device Use
    • Introduction / Key Findings
    • Historical Market Size Value (USD Mn) & Volume (Units) Analysis By Device Use, 2020-2024
    • Current and Future Market Size Value (USD Mn) & Volume (Units) Analysis and Forecast By Device Use, 2025-2035
      • Smartphones
      • Gimbal Cameras
      • Action Cameras
      • DSLR & Mirrorless Cameras
      • Drone Cameras
    • Y-o-Y Growth Trend Analysis By Device Use, 2020-2024
    • Absolute $ Opportunity Analysis By Device Use, 2025-2035
  7. Global Market Analysis 2020-2024 and Forecast 2025-2035, By Axis Rotation
    • Introduction / Key Findings
    • Historical Market Size Value (USD Mn) & Volume (Units) Analysis By Axis Rotation, 2020-2024
    • Current and Future Market Size Value (USD Mn) & Volume (Units) Analysis and Forecast By Axis Rotation, 2025-2035
      • Two-axis
      • Three-axis
    • Y-o-Y Growth Trend Analysis By Axis Rotation, 2020-2024
    • Absolute $ Opportunity Analysis By Axis Rotation, 2025-2035
  8. Global Market Analysis 2020-2024 and Forecast 2025-2035, By Mounting
    • Introduction / Key Findings
    • Historical Market Size Value (USD Mn) & Volume (Units) Analysis By Mounting, 2020-2024
    • Current and Future Market Size Value (USD Mn) & Volume (Units) Analysis and Forecast By Mounting, 2025-2035
      • Handheld
      • Body Mounted
      • Structure Mounted
    • Y-o-Y Growth Trend Analysis By Mounting, 2020-2024
    • Absolute $ Opportunity Analysis By Mounting, 2025-2035
  9. Global Market Analysis 2020-2024 and Forecast 2025-2035, By Sales Channel
    • Introduction / Key Findings
    • Historical Market Size Value (USD Mn) & Volume (Units) Analysis By Sales Channel, 2020-2024
    • Current and Future Market Size Value (USD Mn) & Volume (Units) Analysis and Forecast By Sales Channel, 2025-2035
      • Modern Trade
      • Specialty Store
      • Online Channel
        • Direct to Customer
        • Third Party Online
    • Y-o-Y Growth Trend Analysis By Sales Channel, 2020-2024
    • Absolute $ Opportunity Analysis By Sales Channel, 2025-2035
  10. Global Market Analysis 2020-2024 and Forecast 2025-2035, By Region
    • Introduction
    • Historical Market Size Value (USD Mn) & Volume (Units) Analysis By Region, 2020-2024
    • Current Market Size Value (USD Mn) & Volume (Units) Analysis and Forecast By Region, 2025-2035
      • North America
      • Latin America
      • Western Europe
      • East Asia
      • South Asia Pacific
      • Eastern Europe
      • Middle East & Africa
    • Market Attractiveness Analysis By Region
  11. North America Market Analysis 2020-2024 and Forecast 2025-2035, By Country
    • Historical Market Size Value (USD Mn) & Volume (Units) Trend Analysis By Market Taxonomy, 2020-2024
    • Market Size Value (USD Mn) & Volume (Units) Forecast By Market Taxonomy, 2025-2035
      • By Country
        • U.S.
        • Canada
        • Mexico
      • By Device Use
      • By Axis Rotation
      • By Mounting
      • By Sales Channel
    • Market Attractiveness Analysis
      • By Country
      • By Device Use
      • By Axis Rotation
      • By Mounting
      • By Sales Channel
    • Key Takeaways
  12. Latin America Market Analysis 2020-2024 and Forecast 2025-2035, By Country
    • Historical Market Size Value (USD Mn) & Volume (Units) Trend Analysis By Market Taxonomy, 2020-2024
    • Market Size Value (USD Mn) & Volume (Units) Forecast By Market Taxonomy, 2025-2035
      • By Country
        • Brazil
        • Chile
        • Rest of Latin America
      • By Device Use
      • By Axis Rotation
      • By Mounting
      • By Sales Channel
    • Market Attractiveness Analysis
      • By Country
      • By Device Use
      • By Axis Rotation
      • By Mounting
      • By Sales Channel
    • Key Takeaways
  13. Western Europe Market Analysis 2020-2024 and Forecast 2025-2035, By Country
    • Historical Market Size Value (USD Mn) & Volume (Units) Trend Analysis By Market Taxonomy, 2020-2024
    • Market Size Value (USD Mn) & Volume (Units) Forecast By Market Taxonomy, 2025-2035
      • By Country
        • Germany
        • Italy
        • France
        • U.K.
        • Spain
        • Russia
        • BENELUX
        • Rest of Europe
      • By Device Use
      • By Axis Rotation
      • By Mounting
      • By Sales Channel
    • Market Attractiveness Analysis
      • By Country
      • By Device Use
      • By Axis Rotation
      • By Mounting
      • By Sales Channel
    • Key Takeaways
  14. East Asia Market Analysis 2020-2024 and Forecast 2025-2035, By Country
    • Historical Market Size Value (USD Mn) & Volume (Units) Trend Analysis By Market Taxonomy, 2020-2024
    • Market Size Value (USD Mn) & Volume (Units) Forecast By Market Taxonomy, 2025-2035
      • By Country
        • China
        • Japan
        • South Korea
      • By Device Use
      • By Axis Rotation
      • By Mounting
      • By Sales Channel
    • Market Attractiveness Analysis
      • By Country
      • By Device Use
      • By Axis Rotation
      • By Mounting
      • By Sales Channel
    • Key Takeaways
  15. South Asia Pacific Market Analysis 2020-2024 and Forecast 2025-2035, By Country
    • Historical Market Size Value (USD Mn) & Volume (Units) Trend Analysis By Market Taxonomy, 2020-2024
    • Market Size Value (USD Mn) & Volume (Units) Forecast By Market Taxonomy, 2025-2035
      • By Country
        • India
        • ASEAN Countries
        • Australia & New Zealand
        • Rest of South Asia Pacific
      • By Device Use
      • By Axis Rotation
      • By Mounting
      • By Sales Channel
    • Market Attractiveness Analysis
      • By Country
      • By Device Use
      • By Axis Rotation
      • By Mounting
      • By Sales Channel
    • Key Takeaways
  16. Eastern Europe Market Analysis 2020-2024 and Forecast 2025-2035, By Country
    • Historical Market Size Value (USD Mn) & Volume (Units) Trend Analysis By Market Taxonomy, 2020-2024
    • Market Size Value (USD Mn) & Volume (Units) Forecast By Market Taxonomy, 2025-2035
      • By Country
        • Russia
        • Poland
        • Hungary
        • Balkan & Baltics
        • Rest of Eastern Europe
      • By Device Use
      • By Axis Rotation
      • By Mounting
      • By Sales Channel
    • Market Attractiveness Analysis
      • By Country
      • By Device Use
      • By Axis Rotation
      • By Mounting
      • By Sales Channel
    • Key Takeaways
  17. Middle East & Africa Market Analysis 2020-2024 and Forecast 2025-2035, By Country
    • Historical Market Size Value (USD Mn) & Volume (Units) Trend Analysis By Market Taxonomy, 2020-2024
    • Market Size Value (USD Mn) & Volume (Units) Forecast By Market Taxonomy, 2025-2035
      • By Country
        • KSA
        • Other GCC Countries
        • Turkiye
        • South Africa
        • Rest of MEA
      • By Device Use
      • By Axis Rotation
      • By Mounting
      • By Sales Channel
    • Market Attractiveness Analysis
      • By Country
      • By Device Use
      • By Axis Rotation
      • By Mounting
      • By Sales Channel
    • Key Takeaways
  18. Key Countries Market Analysis
    • China
      • Pricing Analysis
      • Market Share Analysis, 2024
        • By Device Use
        • By Axis Rotation
        • By Mounting
        • By Sales Channel
    • USA
      • Pricing Analysis
      • Market Share Analysis, 2024
        • By Device Use
        • By Axis Rotation
        • By Mounting
        • By Sales Channel
    • Japan
      • Pricing Analysis
      • Market Share Analysis, 2024
        • By Device Use
        • By Axis Rotation
        • By Mounting
        • By Sales Channel
    • Germany
      • Pricing Analysis
      • Market Share Analysis, 2024
        • By Device Use
        • By Axis Rotation
        • By Mounting
        • By Sales Channel
    • South Korea
      • Pricing Analysis
      • Market Share Analysis, 2024
        • By Device Use
        • By Axis Rotation
        • By Mounting
        • By Sales Channel
  19. Market Structure Analysis
    • Competition Dashboard
    • Competition Benchmarking
    • Market Share Analysis of Top Players
      • By Regional
      • By Device Use
      • By Axis Rotation
      • By Mounting
      • By Sales Channel
  20. Competition Analysis
    • Competition Deep Dive
      • DJI
        • Overview
        • Product Portfolio
        • Profitability by Market Segments (Product/Age /Sales Channel/Region)
        • Sales Footprint
        • Strategy Overview
          • Marketing Strategy
          • Product Strategy
          • Channel Strategy
      • Hohem
        • Overview
        • Product Portfolio
        • Profitability by Market Segments (Product/Age /Sales Channel/Region)
        • Sales Footprint
        • Strategy Overview
          • Marketing Strategy
          • Product Strategy
          • Channel Strategy
      • Generic
        • Overview
        • Product Portfolio
        • Profitability by Market Segments (Product/Age /Sales Channel/Region)
        • Sales Footprint
        • Strategy Overview
          • Marketing Strategy
          • Product Strategy
          • Channel Strategy
      • Unmanned Systems Technology
        • Overview
        • Product Portfolio
        • Profitability by Market Segments (Product/Age /Sales Channel/Region)
        • Sales Footprint
        • Strategy Overview
          • Marketing Strategy
          • Product Strategy
          • Channel Strategy
      • Ikan Corporation
        • Overview
        • Product Portfolio
        • Profitability by Market Segments (Product/Age /Sales Channel/Region)
        • Sales Footprint
        • Strategy Overview
          • Marketing Strategy
          • Product Strategy
          • Channel Strategy
      • Adofys
        • Overview
        • Product Portfolio
        • Profitability by Market Segments (Product/Age /Sales Channel/Region)
        • Sales Footprint
        • Strategy Overview
          • Marketing Strategy
          • Product Strategy
          • Channel Strategy
      • FeiyuTech
        • Overview
        • Product Portfolio
        • Profitability by Market Segments (Product/Age /Sales Channel/Region)
        • Sales Footprint
        • Strategy Overview
          • Marketing Strategy
          • Product Strategy
          • Channel Strategy
      • Glidecam Industries, Inc.
        • Overview
        • Product Portfolio
        • Profitability by Market Segments (Product/Age /Sales Channel/Region)
        • Sales Footprint
        • Strategy Overview
          • Marketing Strategy
          • Product Strategy
          • Channel Strategy
      • Gudsen Tehnology Co, Ltd.
        • Overview
        • Product Portfolio
        • Profitability by Market Segments (Product/Age /Sales Channel/Region)
        • Sales Footprint
        • Strategy Overview
          • Marketing Strategy
          • Product Strategy
          • Channel Strategy
      • HIFFIN
        • Overview
        • Product Portfolio
        • Profitability by Market Segments (Product/Age /Sales Channel/Region)
        • Sales Footprint
        • Strategy Overview
          • Marketing Strategy
          • Product Strategy
          • Channel Strategy
  21. Assumptions & Acronyms Used
  22. Research Methodology

List Of Table

  • Table 1: Global Market Value (USD Mn) Forecast by Region, 2020 to 2035
  • Table 2: Global Market Volume (Units) Forecast by Region, 2020 to 2035
  • Table 3: Global Market Value (USD Mn) Forecast by Device Use, 2020 to 2035
  • Table 4: Global Market Volume (Units) Forecast by Device Use, 2020 to 2035
  • Table 5: Global Market Value (USD Mn) Forecast by Axis Rotation, 2020 to 2035
  • Table 6: Global Market Volume (Units) Forecast by Axis Rotation, 2020 to 2035
  • Table 7: Global Market Value (USD Mn) Forecast by Mounting, 2020 to 2035
  • Table 8: Global Market Volume (Units) Forecast by Mounting, 2020 to 2035
  • Table 9: Global Market Value (USD Mn) Forecast by Sales Channel, 2020 to 2035
  • Table 10: Global Market Volume (Units) Forecast by Sales Channel, 2020 to 2035
  • Table 11: North America Market Value (USD Mn) Forecast by Country, 2020 to 2035
  • Table 12: North America Market Volume (Units) Forecast by Country, 2020 to 2035
  • Table 13: North America Market Value (USD Mn) Forecast by Device Use, 2020 to 2035
  • Table 14: North America Market Volume (Units) Forecast by Device Use, 2020 to 2035
  • Table 15: North America Market Value (USD Mn) Forecast by Axis Rotation, 2020 to 2035
  • Table 16: North America Market Volume (Units) Forecast by Axis Rotation, 2020 to 2035
  • Table 17: North America Market Value (USD Mn) Forecast by Mounting, 2020 to 2035
  • Table 18: North America Market Volume (Units) Forecast by Mounting, 2020 to 2035
  • Table 19: North America Market Value (USD Mn) Forecast by Sales Channel, 2020 to 2035
  • Table 20: North America Market Volume (Units) Forecast by Sales Channel, 2020 to 2035
  • Table 21: Latin America Market Value (USD Mn) Forecast by Country, 2020 to 2035
  • Table 22: Latin America Market Volume (Units) Forecast by Country, 2020 to 2035
  • Table 23: Latin America Market Value (USD Mn) Forecast by Device Use, 2020 to 2035
  • Table 24: Latin America Market Volume (Units) Forecast by Device Use, 2020 to 2035
  • Table 25: Latin America Market Value (USD Mn) Forecast by Axis Rotation, 2020 to 2035
  • Table 26: Latin America Market Volume (Units) Forecast by Axis Rotation, 2020 to 2035
  • Table 27: Latin America Market Value (USD Mn) Forecast by Mounting, 2020 to 2035
  • Table 28: Latin America Market Volume (Units) Forecast by Mounting, 2020 to 2035
  • Table 29: Latin America Market Value (USD Mn) Forecast by Sales Channel, 2020 to 2035
  • Table 30: Latin America Market Volume (Units) Forecast by Sales Channel, 2020 to 2035
  • Table 31: Western Europe Market Value (USD Mn) Forecast by Country, 2020 to 2035
  • Table 32: Western Europe Market Volume (Units) Forecast by Country, 2020 to 2035
  • Table 33: Western Europe Market Value (USD Mn) Forecast by Device Use, 2020 to 2035
  • Table 34: Western Europe Market Volume (Units) Forecast by Device Use, 2020 to 2035
  • Table 35: Western Europe Market Value (USD Mn) Forecast by Axis Rotation, 2020 to 2035
  • Table 36: Western Europe Market Volume (Units) Forecast by Axis Rotation, 2020 to 2035
  • Table 37: Western Europe Market Value (USD Mn) Forecast by Mounting, 2020 to 2035
  • Table 38: Western Europe Market Volume (Units) Forecast by Mounting, 2020 to 2035
  • Table 39: Western Europe Market Value (USD Mn) Forecast by Sales Channel, 2020 to 2035
  • Table 40: Western Europe Market Volume (Units) Forecast by Sales Channel, 2020 to 2035
  • Table 41: East Asia Market Value (USD Mn) Forecast by Country, 2020 to 2035
  • Table 42: East Asia Market Volume (Units) Forecast by Country, 2020 to 2035
  • Table 43: East Asia Market Value (USD Mn) Forecast by Device Use, 2020 to 2035
  • Table 44: East Asia Market Volume (Units) Forecast by Device Use, 2020 to 2035
  • Table 45: East Asia Market Value (USD Mn) Forecast by Axis Rotation, 2020 to 2035
  • Table 46: East Asia Market Volume (Units) Forecast by Axis Rotation, 2020 to 2035
  • Table 47: East Asia Market Value (USD Mn) Forecast by Mounting, 2020 to 2035
  • Table 48: East Asia Market Volume (Units) Forecast by Mounting, 2020 to 2035
  • Table 49: East Asia Market Value (USD Mn) Forecast by Sales Channel, 2020 to 2035
  • Table 50: East Asia Market Volume (Units) Forecast by Sales Channel, 2020 to 2035
  • Table 51: South Asia Pacific Market Value (USD Mn) Forecast by Country, 2020 to 2035
  • Table 52: South Asia Pacific Market Volume (Units) Forecast by Country, 2020 to 2035
  • Table 53: South Asia Pacific Market Value (USD Mn) Forecast by Device Use, 2020 to 2035
  • Table 54: South Asia Pacific Market Volume (Units) Forecast by Device Use, 2020 to 2035
  • Table 55: South Asia Pacific Market Value (USD Mn) Forecast by Axis Rotation, 2020 to 2035
  • Table 56: South Asia Pacific Market Volume (Units) Forecast by Axis Rotation, 2020 to 2035
  • Table 57: South Asia Pacific Market Value (USD Mn) Forecast by Mounting, 2020 to 2035
  • Table 58: South Asia Pacific Market Volume (Units) Forecast by Mounting, 2020 to 2035
  • Table 59: South Asia Pacific Market Value (USD Mn) Forecast by Sales Channel, 2020 to 2035
  • Table 60: South Asia Pacific Market Volume (Units) Forecast by Sales Channel, 2020 to 2035
  • Table 61: Eastern Europe Market Value (USD Mn) Forecast by Country, 2020 to 2035
  • Table 62: Eastern Europe Market Volume (Units) Forecast by Country, 2020 to 2035
  • Table 63: Eastern Europe Market Value (USD Mn) Forecast by Device Use, 2020 to 2035
  • Table 64: Eastern Europe Market Volume (Units) Forecast by Device Use, 2020 to 2035
  • Table 65: Eastern Europe Market Value (USD Mn) Forecast by Axis Rotation, 2020 to 2035
  • Table 66: Eastern Europe Market Volume (Units) Forecast by Axis Rotation, 2020 to 2035
  • Table 67: Eastern Europe Market Value (USD Mn) Forecast by Mounting, 2020 to 2035
  • Table 68: Eastern Europe Market Volume (Units) Forecast by Mounting, 2020 to 2035
  • Table 69: Eastern Europe Market Value (USD Mn) Forecast by Sales Channel, 2020 to 2035
  • Table 70: Eastern Europe Market Volume (Units) Forecast by Sales Channel, 2020 to 2035
  • Table 71: Middle East & Africa Market Value (USD Mn) Forecast by Country, 2020 to 2035
  • Table 72: Middle East & Africa Market Volume (Units) Forecast by Country, 2020 to 2035
  • Table 73: Middle East & Africa Market Value (USD Mn) Forecast by Device Use, 2020 to 2035
  • Table 74: Middle East & Africa Market Volume (Units) Forecast by Device Use, 2020 to 2035
  • Table 75: Middle East & Africa Market Value (USD Mn) Forecast by Axis Rotation, 2020 to 2035
  • Table 76: Middle East & Africa Market Volume (Units) Forecast by Axis Rotation, 2020 to 2035
  • Table 77: Middle East & Africa Market Value (USD Mn) Forecast by Mounting, 2020 to 2035
  • Table 78: Middle East & Africa Market Volume (Units) Forecast by Mounting, 2020 to 2035
  • Table 79: Middle East & Africa Market Value (USD Mn) Forecast by Sales Channel, 2020 to 2035
  • Table 80: Middle East & Africa Market Volume (Units) Forecast by Sales Channel, 2020 to 2035

List Of Figures

  • Figure 1: Global Market Volume (Units) Forecast 2020 to 2035
  • Figure 2: Global Market Pricing Analysis
  • Figure 3: Global Market Value (USD Mn) Forecast 2020 to 2035
  • Figure 4: Global Market Value Share and BPS Analysis by Device Use, 2025 and 2035
  • Figure 5: Global Market Y-o-Y Growth Comparison by Device Use, 2025 to 2035
  • Figure 6: Global Market Attractiveness Analysis by Device Use
  • Figure 7: Global Market Value Share and BPS Analysis by Axis Rotation, 2025 and 2035
  • Figure 8: Global Market Y-o-Y Growth Comparison by Axis Rotation, 2025 to 2035
  • Figure 9: Global Market Attractiveness Analysis by Axis Rotation
  • Figure 10: Global Market Value Share and BPS Analysis by Mounting, 2025 and 2035
  • Figure 11: Global Market Y-o-Y Growth Comparison by Mounting, 2025 to 2035
  • Figure 12: Global Market Attractiveness Analysis by Mounting
  • Figure 13: Global Market Value Share and BPS Analysis by Sales Channel, 2025 and 2035
  • Figure 14: Global Market Y-o-Y Growth Comparison by Sales Channel, 2025 to 2035
  • Figure 15: Global Market Attractiveness Analysis by Sales Channel
  • Figure 16: Global Market Value (USD Mn) Share and BPS Analysis by Region, 2025 and 2035
  • Figure 17: Global Market Y-o-Y Growth Comparison by Region, 2025 to 2035
  • Figure 18: Global Market Attractiveness Analysis by Region
  • Figure 19: North America Market Incremental $ Opportunity, 2025 to 2035
  • Figure 20: Latin America Market Incremental $ Opportunity, 2025 to 2035
  • Figure 21: Western Europe Market Incremental $ Opportunity, 2025 to 2035
  • Figure 22: East Asia Market Incremental $ Opportunity, 2025 to 2035
  • Figure 23: South Asia Pacific Market Incremental $ Opportunity, 2025 to 2035
  • Figure 24: Eastern Europe Market Incremental $ Opportunity, 2025 to 2035
  • Figure 25: Middle East & Africa Market Incremental $ Opportunity, 2025 to 2035
  • Figure 26: North America Market Value Share and BPS Analysis by Country, 2025 and 2035
  • Figure 27: North America Market Value Share and BPS Analysis by Device Use, 2025 and 2035
  • Figure 28: North America Market Y-o-Y Growth Comparison by Device Use, 2025 to 2035
  • Figure 29: North America Market Attractiveness Analysis by Device Use
  • Figure 30: North America Market Value Share and BPS Analysis by Axis Rotation, 2025 and 2035
  • Figure 31: North America Market Y-o-Y Growth Comparison by Axis Rotation, 2025 to 2035
  • Figure 32: North America Market Attractiveness Analysis by Axis Rotation
  • Figure 33: North America Market Value Share and BPS Analysis by Mounting, 2025 and 2035
  • Figure 34: North America Market Y-o-Y Growth Comparison by Mounting, 2025 to 2035
  • Figure 35: North America Market Attractiveness Analysis by Mounting
  • Figure 36: North America Market Value Share and BPS Analysis by Sales Channel, 2025 and 2035
  • Figure 37: North America Market Y-o-Y Growth Comparison by Sales Channel, 2025 to 2035
  • Figure 38: North America Market Attractiveness Analysis by Sales Channel
  • Figure 39: Latin America Market Value Share and BPS Analysis by Country, 2025 and 2035
  • Figure 40: Latin America Market Value Share and BPS Analysis by Device Use, 2025 and 2035
  • Figure 41: Latin America Market Y-o-Y Growth Comparison by Device Use, 2025 to 2035
  • Figure 42: Latin America Market Attractiveness Analysis by Device Use
  • Figure 43: Latin America Market Value Share and BPS Analysis by Axis Rotation, 2025 and 2035
  • Figure 44: Latin America Market Y-o-Y Growth Comparison by Axis Rotation, 2025 to 2035
  • Figure 45: Latin America Market Attractiveness Analysis by Axis Rotation
  • Figure 46: Latin America Market Value Share and BPS Analysis by Mounting, 2025 and 2035
  • Figure 47: Latin America Market Y-o-Y Growth Comparison by Mounting, 2025 to 2035
  • Figure 48: Latin America Market Attractiveness Analysis by Mounting
  • Figure 49: Latin America Market Value Share and BPS Analysis by Sales Channel, 2025 and 2035
  • Figure 50: Latin America Market Y-o-Y Growth Comparison by Sales Channel, 2025 to 2035
  • Figure 51: Latin America Market Attractiveness Analysis by Sales Channel
  • Figure 52: Western Europe Market Value Share and BPS Analysis by Country, 2025 and 2035
  • Figure 53: Western Europe Market Value Share and BPS Analysis by Device Use, 2025 and 2035
  • Figure 54: Western Europe Market Y-o-Y Growth Comparison by Device Use, 2025 to 2035
  • Figure 55: Western Europe Market Attractiveness Analysis by Device Use
  • Figure 56: Western Europe Market Value Share and BPS Analysis by Axis Rotation, 2025 and 2035
  • Figure 57: Western Europe Market Y-o-Y Growth Comparison by Axis Rotation, 2025 to 2035
  • Figure 58: Western Europe Market Attractiveness Analysis by Axis Rotation
  • Figure 59: Western Europe Market Value Share and BPS Analysis by Mounting, 2025 and 2035
  • Figure 60: Western Europe Market Y-o-Y Growth Comparison by Mounting, 2025 to 2035
  • Figure 61: Western Europe Market Attractiveness Analysis by Mounting
  • Figure 62: Western Europe Market Value Share and BPS Analysis by Sales Channel, 2025 and 2035
  • Figure 63: Western Europe Market Y-o-Y Growth Comparison by Sales Channel, 2025 to 2035
  • Figure 64: Western Europe Market Attractiveness Analysis by Sales Channel
  • Figure 65: East Asia Market Value Share and BPS Analysis by Country, 2025 and 2035
  • Figure 66: East Asia Market Value Share and BPS Analysis by Device Use, 2025 and 2035
  • Figure 67: East Asia Market Y-o-Y Growth Comparison by Device Use, 2025 to 2035
  • Figure 68: East Asia Market Attractiveness Analysis by Device Use
  • Figure 69: East Asia Market Value Share and BPS Analysis by Axis Rotation, 2025 and 2035
  • Figure 70: East Asia Market Y-o-Y Growth Comparison by Axis Rotation, 2025 to 2035
  • Figure 71: East Asia Market Attractiveness Analysis by Axis Rotation
  • Figure 72: East Asia Market Value Share and BPS Analysis by Mounting, 2025 and 2035
  • Figure 73: East Asia Market Y-o-Y Growth Comparison by Mounting, 2025 to 2035
  • Figure 74: East Asia Market Attractiveness Analysis by Mounting
  • Figure 75: East Asia Market Value Share and BPS Analysis by Sales Channel, 2025 and 2035
  • Figure 76: East Asia Market Y-o-Y Growth Comparison by Sales Channel, 2025 to 2035
  • Figure 77: East Asia Market Attractiveness Analysis by Sales Channel
  • Figure 78: South Asia Pacific Market Value Share and BPS Analysis by Country, 2025 and 2035
  • Figure 79: South Asia Pacific Market Value Share and BPS Analysis by Device Use, 2025 and 2035
  • Figure 80: South Asia Pacific Market Y-o-Y Growth Comparison by Device Use, 2025 to 2035
  • Figure 81: South Asia Pacific Market Attractiveness Analysis by Device Use
  • Figure 82: South Asia Pacific Market Value Share and BPS Analysis by Axis Rotation, 2025 and 2035
  • Figure 83: South Asia Pacific Market Y-o-Y Growth Comparison by Axis Rotation, 2025 to 2035
  • Figure 84: South Asia Pacific Market Attractiveness Analysis by Axis Rotation
  • Figure 85: South Asia Pacific Market Value Share and BPS Analysis by Mounting, 2025 and 2035
  • Figure 86: South Asia Pacific Market Y-o-Y Growth Comparison by Mounting, 2025 to 2035
  • Figure 87: South Asia Pacific Market Attractiveness Analysis by Mounting
  • Figure 88: South Asia Pacific Market Value Share and BPS Analysis by Sales Channel, 2025 and 2035
  • Figure 89: South Asia Pacific Market Y-o-Y Growth Comparison by Sales Channel, 2025 to 2035
  • Figure 90: South Asia Pacific Market Attractiveness Analysis by Sales Channel
  • Figure 91: Eastern Europe Market Value Share and BPS Analysis by Country, 2025 and 2035
  • Figure 92: Eastern Europe Market Value Share and BPS Analysis by Device Use, 2025 and 2035
  • Figure 93: Eastern Europe Market Y-o-Y Growth Comparison by Device Use, 2025 to 2035
  • Figure 94: Eastern Europe Market Attractiveness Analysis by Device Use
  • Figure 95: Eastern Europe Market Value Share and BPS Analysis by Axis Rotation, 2025 and 2035
  • Figure 96: Eastern Europe Market Y-o-Y Growth Comparison by Axis Rotation, 2025 to 2035
  • Figure 97: Eastern Europe Market Attractiveness Analysis by Axis Rotation
  • Figure 98: Eastern Europe Market Value Share and BPS Analysis by Mounting, 2025 and 2035
  • Figure 99: Eastern Europe Market Y-o-Y Growth Comparison by Mounting, 2025 to 2035
  • Figure 100: Eastern Europe Market Attractiveness Analysis by Mounting
  • Figure 101: Eastern Europe Market Value Share and BPS Analysis by Sales Channel, 2025 and 2035
  • Figure 102: Eastern Europe Market Y-o-Y Growth Comparison by Sales Channel, 2025 to 2035
  • Figure 103: Eastern Europe Market Attractiveness Analysis by Sales Channel
  • Figure 104: Middle East & Africa Market Value Share and BPS Analysis by Country, 2025 and 2035
  • Figure 105: Middle East & Africa Market Value Share and BPS Analysis by Device Use, 2025 and 2035
  • Figure 106: Middle East & Africa Market Y-o-Y Growth Comparison by Device Use, 2025 to 2035
  • Figure 107: Middle East & Africa Market Attractiveness Analysis by Device Use
  • Figure 108: Middle East & Africa Market Value Share and BPS Analysis by Axis Rotation, 2025 and 2035
  • Figure 109: Middle East & Africa Market Y-o-Y Growth Comparison by Axis Rotation, 2025 to 2035
  • Figure 110: Middle East & Africa Market Attractiveness Analysis by Axis Rotation
  • Figure 111: Middle East & Africa Market Value Share and BPS Analysis by Mounting, 2025 and 2035
  • Figure 112: Middle East & Africa Market Y-o-Y Growth Comparison by Mounting, 2025 to 2035
  • Figure 113: Middle East & Africa Market Attractiveness Analysis by Mounting
  • Figure 114: Middle East & Africa Market Value Share and BPS Analysis by Sales Channel, 2025 and 2035
  • Figure 115: Middle East & Africa Market Y-o-Y Growth Comparison by Sales Channel, 2025 to 2035
  • Figure 116: Middle East & Africa Market Attractiveness Analysis by Sales Channel
  • Figure 117: Global Market - Tier Structure Analysis
  • Figure 118: Global Market - Company Share Analysis

- FAQs -

What was the global gimbal stabilizers market size reported by Fact.MR for 2025?

The global gimbal stabilizers market was valued at USD 793 million in 2025.

Who are the major players operating in the gimbal stabilizers market?

Prominent players in the market are Hohem, Generic, Unmanned Systems Technology, Ikan Corporation, Adofys, and others.

What is the estimated valuation of the gimbal stabilizers market in 2035?

The market is expected to reach a valuation of USD 1,380 million in 2035.

What value CAGR did the gimbal stabilizers market exhibit over the last five years?

The historic growth rate of the gimbal stabilizers market was 5.1% from 2020-2024.

Gimbal Stabilizers Market

Schedule a Call