- Market Value (2025): USD 211.4 Mn
- Estimated Value (2026): USD 230.6 Mn
- Forecast Value (2036): USD 549.9 Mn
- CAGR (2026-2036): 9.1%
What is the Hydration-Tracking Devices Market forecast to be worth by 2036?
USD 230.6 million in 2026 to USD 549.9 million by 2036 at a 9.1% CAGR.
- Hydration-tracking devices generated USD 211.4 million in 2025, with sports users and occupational safety buyers accounting for most early purchases.
- Revenue will expand from USD 230.6 million in 2026 to USD 549.9 million by 2036, as sweat sensing and wrist-based estimation move into mainstream fitness ecosystems.
- A 9.1% CAGR reflects a young category where repeat patch sales, app subscriptions and team deployments add to first-time hardware revenue.
| Year | Basis | Market Value (USD million) |
|---|---|---|
| 2025 | Actual | 211.4 |
| 2026 | Estimate | 230.6 |
| 2036 | Forecast | 549.9 |
| CAGR 2026 to 2036 | Forecast period | 9.1% |
Source: Fact.MR analysis. Updated Nov 12, 2026
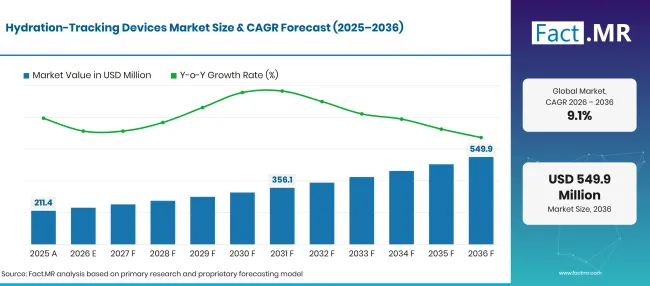
Hydration Tracking Devices Market Forecast Global | Source: Fact.MR
What are the defining numbers behind Hydration-Tracking Devices Market growth?
The 2026 to 2036 period will add USD 319.3 million in new value, led by wearable formats sold with companion software.
- Demand Drivers in the Market
- Rising heat exposure at work: WHO and WMO reported in August 2025 that worker productivity falls by 2% to 3% for every degree above 20°C, and that more than 2.4 billion workers face excessive heat. Employers now look for tools that flag fluid loss before heat illness sets in.
- Warmer seasons for outdoor sport: WMO confirmed that 2025 was the third warmest year on record, at 1.44°C above the 1850 to 1900 average. Coaches who once tested sweat rate in a lab now want field readings during hot training blocks.
- Clearer regulatory treatment of non-invasive wearables: the FDA’s January 2026 general wellness guidance states that certain products using non-invasive sensing, such as optical sensing, can qualify as low-risk wellness products when they meet the listed conditions. That clarity lowers the barrier for consumer launches in the United States.
- Better sensors and app ecosystems: sweat patches, electrode pods and optical watches now stream data to phones and bike computers, so users see fluid and sodium loss while the session is still under way.
- Key Segments Analyzed
- By Hydration Monitoring Method: Bioimpedance Estimation will account for 27.3% of 2026 value, since it reuses electrodes already common in wrist and scale designs.
- By Device Form Factor: Wrist / Finger Wearable will capture 28.3% in 2026, helped by the habit of wearing a watch or ring all day.
- By Data Processing: Smartphone Companion will hold 28.8% of 2026 revenue as most users already read health data on a phone.
- By Sales Channel: Clinical / Professional will take 28.1% in 2026, given that teams, sports scientists and safety managers buy in volume and pay for validated readings.
- Analyst Opinion at Fact.MR
- Shambhu Nath Jha, Principal Consultant at Fact.MR, states, “Hydration tracking will earn a lasting place only where the reading changes what a person drinks in the next hour. Vendors that publish validation data across heat, humidity and exercise intensity will win the team and workplace contracts that consumer sales later follow. Over the forecast period, sweat sodium data and wrist estimates will converge inside the same apps, and buyers will compare products on decision quality more than on sensor count.”
- Strategic Implications
- Manufacturers should test accuracy across sweat rates, skin types and climates, and publish the results in plain terms on product pages.
- App developers should connect hydration data with the watches and bike computers athletes already own, so alerts arrive during the session.
- Employers in construction, farming and logistics should treat sweat and heat sensors as one layer of a heat plan that still includes water, shade and rest breaks.
- Distributors should explain the difference between intake logging, sweat electrolyte measurement and physiological estimation, since buyers often confuse the three.
China leads the country set at 11.8%, where a deep electronics supply base and an ageing population open both sport and senior use cases. South Korea follows at 10.3%, a full 1.5 points behind, as record heat illness counts push hydration into public health messaging. The United States trails Korea by 1.6 points at 8.7%, because a larger installed base of wearables already exists and growth comes from upgrades and workplace programs. Japan, at 8.4%, stays only 0.3 points under the United States, with new employer heatstroke duties lifting institutional buying. Germany closes the list at 8.0%, where sports science buyers lead and consumer uptake builds more slowly.
How does the Hydration-Tracking Devices Market break down by segment?
Bioimpedance Estimation will lead Hydration Monitoring Method at 27.3%; Wrist / Finger Wearable will head Device Form Factor at 28.3%; Smartphone Companion will hold Data Processing at 28.8%; Clinical / Professional will lead Sales Channel at 28.1% in 2026.
Which Hydration Monitoring Method leads?
Bioimpedance Estimation holds 27.3% of 2026 sales.
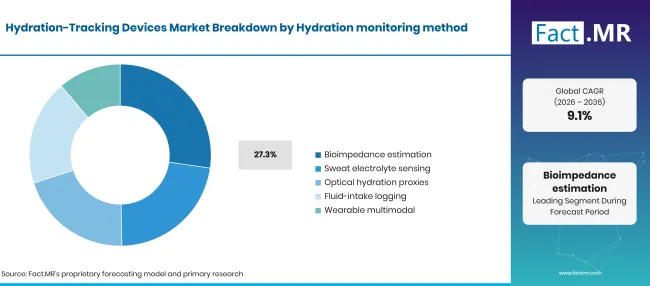
Hydration Tracking Devices Market Breakdown Hydration Monitoring Method | Source: Fact.MR
| Hydration Monitoring Method | Share (2026) |
|---|---|
| Bioimpedance Estimation (Leading segment) | 27.3% |
| Other segments combined | 72.7%* |
| Total | 100.0% |
Source: Fact.MR analysis. Updated Nov 12, 2026
Electrodes that pass a small current through tissue can estimate body water without any consumable, which keeps running costs low for daily wearers. The same hardware already appears in body composition scales and some watches, so makers can add a hydration estimate through firmware. Readings shift with posture, skin contact and recent meals, and brands that disclose these limits build more trust with coaches. Sweat electrolyte sensing is the main alternative for athletes who need sodium data. Epicore Biosystems describes its industrial armband as tracking sweat and electrolyte losses, skin temperature and motion for real-time interventions. Sensors of this kind share much of the chemistry used in glucose biosensors, although they read sweat, not blood. Optical proxies, fluid-intake logging and multimodal systems complete the method mix.
What supports Wrist / Finger Wearable within Device Form Factor?
Wrist / Finger Wearable accounts for 28.3% of 2026 revenue.
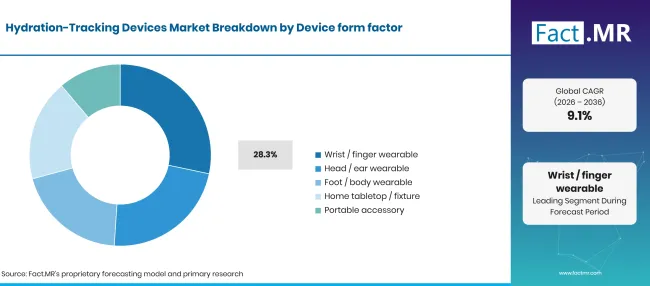
Hydration Tracking Devices Market Breakdown Device Form Factor | Source: Fact.MR
| Device Form Factor | Share (2026) |
|---|---|
| Wrist / Finger Wearable (Leading segment) | 28.3% |
| Other segments combined | 71.7%* |
| Total | 100.0% |
Source: Fact.MR analysis. Updated Nov 12, 2026
People who already sleep and train with a watch or ring accept one more metric far more easily than a new device on the arm. Compact screens borrowed from the wearable display supply chain let these products show a drink prompt without a phone. Head and ear wearables, foot and body pods, tabletop fixtures and portable accessories serve narrower needs. hDrop Technologies, for example, streams sweat data from its reusable sensor to Garmin watches and bike computers through the Connect IQ store. Smart bottles in the portable accessory group record intake with no skin contact at all.
How does Data Processing shape demand?
Smartphone Companion represents 28.8% of 2026 value.
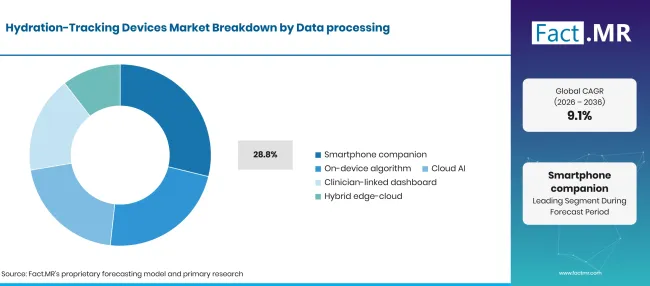
Hydration Tracking Devices Market Breakdown Data Processing | Source: Fact.MR
| Data Processing | Share (2026) |
|---|---|
| Smartphone Companion (Leading segment) | 28.8% |
| Other segments combined | 71.2%* |
| Total | 100.0% |
Source: Fact.MR analysis. Updated Nov 12, 2026
A phone app is where most users set a daily goal, read a sweat score and receive reminders. Developers borrow onboarding and habit features from mHealth apps, which keeps learning costs low for first-time buyers. Subscription tiers for plans and history give brands revenue after the hardware sale. On-device algorithms help when athletes train without a phone, while cloud AI finds patterns across many sessions. Coaching engines similar to those in AI health coaching turn those patterns into a pre-race drinking plan. Clinician-linked dashboards and hybrid edge-cloud setups serve research and care settings.
Which Sales Channel leads?
Clinical / Professional takes 28.1% of 2026 sales.
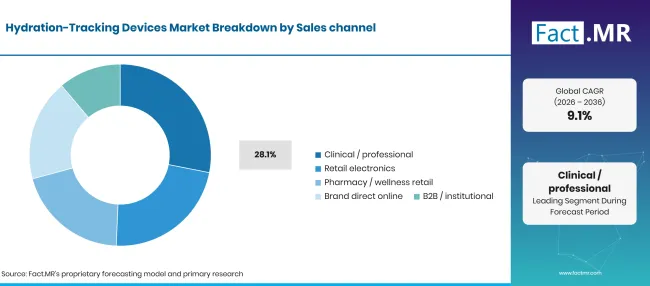
Hydration Tracking Devices Market Breakdown Sales Channel | Source: Fact.MR
| Sales Channel | Share (2026) |
|---|---|
| Clinical / Professional (Leading segment) | 28.1% |
| Other segments combined | 71.9%* |
| Total | 100.0% |
Source: Fact.MR analysis. Updated Nov 12, 2026
Pro teams, university labs and safety departments buy dozens of units at once and judge vendors on published validation. These buyers also pay for dashboards that let one staff member watch a whole squad or crew. Retail electronics, pharmacy and wellness stores, brand-direct online sales and B2B institutional channels reach consumers and smaller employers. Online stores let a brand explain sweat testing in detail, and consumer fitness buyers often first meet hydration features inside home fitness apps. Institutional buyers in heavy industry sometimes bundle sensors with smart PPE such as connected vests and helmets.
What is accelerating Hydration-Tracking Devices Market adoption, and what is holding it back?
Hotter work sites and training seasons, wider wearable ownership and clearer wellness rules are pulling hydration sensing into sport, industry and senior care. Uptake still slows where accuracy varies between users and climates. Device and patch costs deter casual buyers, and many shoppers cannot yet tell intake logging apart from true physiological measurement.
Drivers Impact Analysis
| DRIVER | (~) % IMPACT ON CAGR | GEOGRAPHIC RELEVANCE | IMPACT TIMELINE |
|---|---|---|---|
| Rising adoption of wearable fitness and hydration monitoring technologies | +1.0% | North America, Western Europe | Medium term (2-4 years) |
| Growing awareness of dehydration and heat-related health risks | +0.9% | Global | Short term (<=2 years) |
| Increasing use of sweat-based hydration monitoring among athletes | +0.7% | North America, Western Europe, East Asia | Medium term (2-4 years) |
| Integration with smartphones and connected fitness ecosystems | +0.5% | Global | Short term (<=2 years) |
| Workplace heat-safety rules and occupational hydration programs | +0.4% | North America, East Asia, Western Europe | Long term (>=4 years) |
Source: Fact.MR analysis. Updated Nov 12, 2026
Opportunity Impact Analysis
| OPPORTUNITY | (~) % IMPACT ON CAGR | GEOGRAPHIC RELEVANCE | IMPACT TIMELINE |
|---|---|---|---|
| Improved sensor accuracy and validated hydration estimation algorithms | +0.8% | Global | Medium term (2-4 years) |
| Personalized hydration plans using sweat-rate and electrolyte data | +0.6% | North America, Western Europe | Medium term (2-4 years) |
| Integration with sports performance and occupational health platforms | +0.5% | North America, Latin America, East Asia | Long term (>=4 years) |
| Affordable and comfortable wearable hydration sensors | +0.4% | Global | Short term (<=2 years) |
Source: Fact.MR analysis. Updated Nov 12, 2026
Restraints Impact Analysis
| RESTRAINT | (~) % IMPACT ON CAGR | GEOGRAPHIC RELEVANCE | IMPACT TIMELINE |
|---|---|---|---|
| High device and patch costs for general consumers | -0.8% | Global | Short term (<=2 years) |
| Variability in sweat composition and estimation accuracy | -0.6% | Global | Medium term (2-4 years) |
| Limited consumer understanding of hydration-monitoring methods | -0.5% | South Asia & Pacific, Latin America, Middle East & Africa | Short term (<=2 years) |
| Battery, connectivity and sensor maintenance limits | -0.4% | Global | Medium term (2-4 years) |
Source: Fact.MR analysis. Updated Nov 12, 2026
Which countries are scaling the Hydration-Tracking Devices Market through 2036?
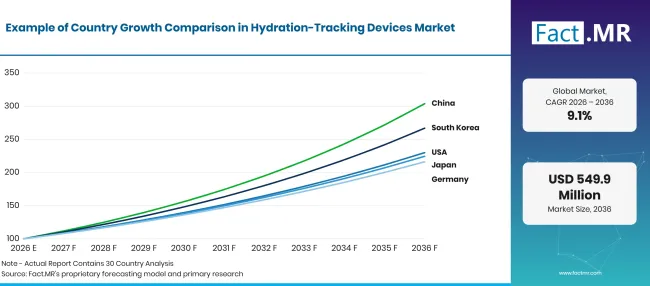
Hydration Tracking Devices Market Growth Index | Source: Fact.MR
| Country | CAGR (2026 to 2036) |
|---|---|
| China | 11.8% |
| South Korea | 10.3% |
| United States | 8.7% |
| Japan | 8.4% |
| Germany | 8.0% |
Source: Fact.MR analysis. Updated Nov 12, 2026
What supports hydration-tracking device adoption in China?
11.8% CAGR, driven by domestic wearable manufacturing and a fast-ageing population.
China’s electronics base gives local brands cheap access to sensors, radios and batteries. The National Bureau of Statistics counted 1.54 billion mobile phones produced in 2025, and people aged 60 and over reached 23.0% of the population at year end. Phone-linked hydration reminders suit both groups, from young runners to older adults who drink too little in summer. Price-led wrist devices will carry most volume, while sweat patches stay with pro teams.
How is South Korea developing demand?
10.3% CAGR, as heat illness cases rise and public agencies stress hydration.
The Korea Disease Control and Prevention Agency logged 4,460 heat-related illness emergency visits in summer 2025, up 20.4% from 3,704 in 2024. Health messaging that tells people to drink before they feel thirst gives hydration features a clear purpose. Korean consumers already own smartwatches in large numbers, so app-based alerts and sweat accessories reach buyers through familiar devices.
What is supporting United States adoption?
8.7% CAGR, backed by workplace heat programs and a broad wearable base.
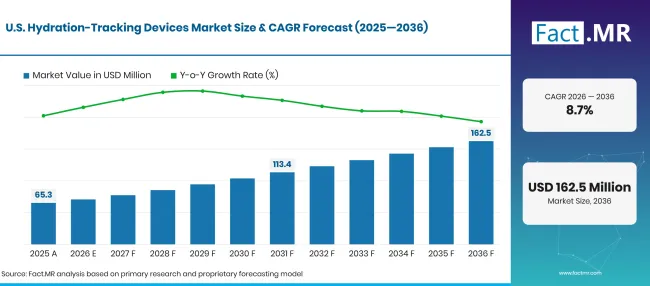
Hydration Tracking Devices Market Forecast Usa | Source: Fact.MR
NIOSH advises workers in moderate heat to drink 1 cup (8 oz.) of water every 15 to 20 minutes and to keep total intake at or below six cups per hour. Guidance that precise invites tools able to show whether a worker is keeping pace. Employers in construction, energy and agriculture form the institutional core, while endurance athletes and college teams drive sweat patch volume.
How is Japan building demand?
8.4% CAGR, helped by new employer heatstroke duties and an older population.
The Fire and Disaster Management Agency recorded 100,510 heatstroke emergency transports from May to September 2025, the most since its survey began in 2008, and 57.1% of patients were aged 65 or older. Since June 1, 2025, employers must set up reporting systems and response procedures for work at a WBGT of 28°C or above. Both trends favour compact wrist devices and simple intake reminders.
What supports Germany’s adoption?
8.0% CAGR, reflecting sports science demand and steady wellness uptake.
The Federal Statistical Office reported an average of about 1,400 hospital treatments a year for heat and sunlight damage between 2004 and 2024, with a peak of just over 2,300 in 2015. Clubs, cycling teams and sports universities use sweat testing to set fluid plans for summer events. Buyers ask for technical documentation and data protection detail, which favours vendors with published validation and EU hosting.
Who leads the Hydration-Tracking Devices Market?
Competition splits into three groups. Sweat chemistry specialists, namely Epicore Biosystems, Nix Biosensors, FLOWBIO, hDrop Technologies and Liipoo, sell sensors that read fluid and sodium loss and compete on lab validation and links to watches.
Epicore extends this model into industrial safety with an armband that tracks sweat, skin temperature and motion. A second group estimates hydration without sweat collection. Hydrostasis launched its GECA Watch 2.0 optical wrist device in December 2025 and made its products eligible for HSA and FSA payment in February 2026, a step that lowers the cost barrier for older users. The third group, led by HidrateSpark, tracks intake through connected bottles and reaches mass retail with lower prices but no physiological reading. The vendors that link a reading to a clear drinking action will gain ground across all three groups.
Which companies are the key providers?
Key companies in the Hydration-Tracking Devices Market include Epicore Biosystems, Nix Biosensors, FLOWBIO, hDrop Technologies, Liipoo, Hydrostasis and HidrateSpark.
- Epicore Biosystems
- Nix Biosensors
- FLOWBIO
- hDrop Technologies
- Liipoo
- Hydrostasis
- HidrateSpark
Bibliography
- Epicore Biosystems. (2026, November 5). Epicore Biosystems Wearable Hydration & Heat Stress Monitor.
- Fire and Disaster Management Agency. (2025, October 29).
- hDrop Technologies. (2025, March 13). Hydration monitor Garmin.
- Hydrostasis. (2025, December). GECA Watch 2.0 Is Live.
- Hydrostasis. (2026, February). Hydrostasis Is Now Eligible for HSA/FSA Payments.
- Korea Disease Control and Prevention Agency. (2025, October 21).
- Ministry of Health, Labour and Welfare, Chiba Labour Bureau. (2025, May 2).
- National Bureau of Statistics of China. (2026, February 28). Statistical Communiqué of the People’s Republic of China on the 2025 National Economic and Social Development.
- National Institute for Occupational Safety and Health. (2026, July 16). Workplace Recommendations: Heat Stress.
- Statistisches Bundesamt. (2026, July 2). Durchschnittlich knapp 1 400 Krankenhausbehandlungen im Jahr bedingt durch Hitze und Sonnenlicht.
- U.S. Food and Drug Administration. (2026, January 6). General Wellness: Policy for Low Risk Devices.
- World Health Organization. (2025, August 22). WHO, WMO issue new report and guidance to protect workers from increasing heat stress.
- World Meteorological Organization. (2026, January 14). WMO confirms 2025 was one of warmest years on record.
This Report Answers
- How large the hydration-tracking devices market was in 2025 and what it will be worth by 2036.
- Which monitoring method, form factor, processing model and sales channel hold the lead, and why buyers favour them.
- Why China and South Korea outpace the United States, Japan and Germany on growth.
- What heat exposure, wellness regulation and wearable ownership mean for device demand.
- Where sweat sensing, wrist estimation and smart bottles compete or overlap.
- Which vendors are building validated, connected hydration products today.
What does the Hydration-Tracking Devices Market cover?
This study tracks devices whose main job is to tell the user something about body water, sweat loss or fluid intake. It counts the hardware, consumable patches and companion software sold as part of the same product.
Values are stated in USD million at manufacturer selling prices. Subscription revenue is counted only when it is tied to a hydration device.
What is included in the scope?
Reusable and single-use sweat sensors and patches that measure fluid and electrolyte loss.
Watches, rings and bands that estimate hydration through bioimpedance or optical methods.
Connected bottles and portable accessories that log intake and send reminders.
Apps, dashboards and cloud analytics sold with these devices for athletes, workers and patients.
What is excluded from the scope?
Water bottles, hydration packs and containers with no sensing or connectivity.
Fitness trackers that offer no hydration estimate or measurement.
Electrolyte drinks, supplements and other consumables not tied to a device.
Clinical laboratory tests and standalone apps without a dedicated hydration sensor or bottle.
How Was the Analysis Built?
The analysis draws on 120+ sources, 35+ company portfolios, 25+ countries, and more than 20 industry interviews.
- Primary Research: Primary research includes discussions with manufacturers, service providers, technology developers, distributors, end users, and subject-matter experts. These conversations examine purchasing priorities, product adoption, operational challenges, approval requirements, competitive positioning, and the factors that influence wider market acceptance.
- Desk Research: Desk research covers government statistics, regulatory publications, company filings, trade data, technical studies, industry associations, standards, public policy, and other authoritative sources. Every source used in the analysis is documented in the bibliography.
- Market Sizing and Forecasting: Market estimates combine historical performance, demand indicators, pricing and volume trends, segment shares, company participation, country-level growth, adoption patterns, investment activity, and barriers to market expansion.
- Data Validation and Update Cycle: Findings are validated by comparing primary interviews with public data, company activity, regulatory changes, trade patterns, and industry developments. Regular updates review new product launches, capacity changes, partnerships, approvals, and shifts in commercial adoption.
Segmentation
What is the report’s scope and coverage?
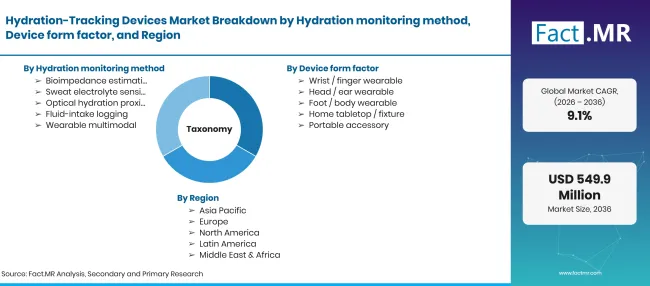
Hydration Tracking Devices Market Taxonomy | Source: Fact.MR
| Attribute | Details |
|---|---|
| Quantitative Units | USD million |
| Market Definition | Wearable and connected devices, with their companion software, that estimate hydration status, measure sweat fluid and electrolyte loss, or log fluid intake. |
| Hydration Monitoring Method | Bioimpedance Estimation; Sweat Electrolyte Sensing; Optical Hydration Proxies; Fluid-Intake Logging; Wearable Multimodal |
| Device Form Factor | Wrist / Finger Wearable; Head / Ear Wearable; Foot / Body Wearable; Home Tabletop / Fixture; Portable Accessory |
| Data Processing | Smartphone Companion; On-Device Algorithm; Cloud AI; Clinician-Linked Dashboard; Hybrid Edge-Cloud |
| Sales Channel | Clinical / Professional; Retail Electronics; Pharmacy / Wellness Retail; Brand Direct Online; B2B / Institutional |
| Regions Covered | North America; Latin America; Western Europe; Eastern Europe; East Asia; South Asia & Pacific; Middle East & Africa |
| Countries Covered | China; South Korea; United States; Japan; Germany |
| Companies Profiled | Epicore Biosystems; Nix Biosensors; FLOWBIO; hDrop Technologies; Liipoo; Hydrostasis; HidrateSpark |
| Forecast Period | 2026 to 2036 |
| Approach | Device shipment and price modelling by method and form factor, cross-checked against heat exposure, wearable ownership and channel data. |
Source: Fact.MR analysis. Updated Nov 12, 2026
How is the market segmented?
-
By Hydration Monitoring Method
- Bioimpedance Estimation
- Sweat Electrolyte Sensing
- Optical Hydration Proxies
- Fluid-Intake Logging
- Wearable Multimodal
-
By Device Form Factor
- Wrist / Finger Wearable
- Head / Ear Wearable
- Foot / Body Wearable
- Home Tabletop / Fixture
- Portable Accessory
-
By Data Processing
- Smartphone Companion
- On-Device Algorithm
- Cloud AI
- Clinician-Linked Dashboard
- Hybrid Edge-Cloud
-
By Sales Channel
- Clinical / Professional
- Retail Electronics
- Pharmacy / Wellness Retail
- Brand Direct Online
- B2B / Institutional
-
By Region
- North America
- Latin America
- Western Europe
- Eastern Europe
- East Asia
- South Asia & Pacific
- Middle East & Africa
Frequently Asked Questions
How large is the hydration-tracking devices market in 2026?
What growth rate will the hydration-tracking devices market record?
Which hydration monitoring method leads?
Which device form factor leads?
Which data processing model leads?
Which sales channel leads?
Which country will grow quickest?
Who are the main companies?
What holds the market back?
Who worked on this report


Preview the report firsthand - request a free sample
Free SampleGet the brochure for pricing and purchase details
Download PDF