Laundry and Dry Cleaning Services Market Size, Share, Growth and Forecast (2026 - 2036)
The Laundry and Dry Cleaning Services Market is segmented by Service Type (Conventional Service, Online Laundry Service, Mobile Laundry Service, Self-service Laundry, Subscription-based Laundry Service), Application (Residential Laundry, Commercial Laundry, Dry Cleaning, Textile Care, Specialty Garment Care), End User (Households, Hotels and Hospitality, Healthcare Facilities, Corporate and Workwear Users, Institutions), Service Format (Store-based Service, Pickup and Delivery Service, Laundromats, On-demand App-based Service), Garment Type (Daily Wear, Formal Wear, Uniforms and Workwear, Bedding and Linen, Delicate and Premium Garments), and Region. Forecast for 2026 to 2036.
Fact.MR analysis indicates that laundry and dry cleaning services demand is shifting from neighborhood garment cleaning toward convenience-based textile care. Conventional service is projected to lead by service type. Residential laundry is expected to dominate by application during the forecast period.
Laundry and Dry Cleaning Services Market Size, Market Forecast and Outlook by Fact.MR
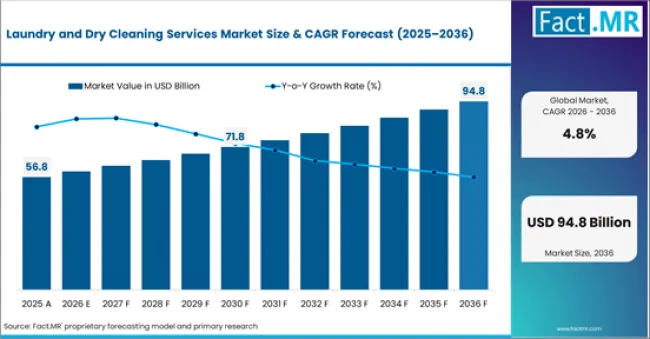
- The laundry and dry cleaning services market was valued at USD 56.8 billion in 2025.
- Demand is set to reach USD 59.3 billion in 2026 at a CAGR of 4.8% during the forecast period.
- Sustained service adoption takes the valuation to USD 94.8 billion through 2036 as urban households, hotels, hospitals, and workwear users outsource more textile cleaning needs.
| Metric | Details |
|---|---|
| Industry Size (2026) | USD 59.3 billion |
| Industry Value (2036) | USD 94.8 billion |
| CAGR (2026 to 2036) | 4.8% |
Summary of Laundry and Dry Cleaning Services Market
- Market Definition
- Laundry and dry cleaning services cover professional cleaning and finishing of garments, household textiles, linens, uniforms, and delicate fabrics. Scope is defined by service type, garment handling, cleaning method, pickup model, and end-user demand across residential and commercial users.
- Demand Drivers in the Market
- Urban households need time-saving garment care with pickup and delivery convenience.
- Hotels require linen cleaning services that support room turnover and guest experience.
- Healthcare facilities need textile hygiene processes for bedsheets, gowns, and patient-care fabrics.
- Key Segments Analyzed
- Conventional Service: Conventional service is expected to hold 78.0% share in 2026 because store-based cleaning remains the main service model in many countries.
- Residential Laundry: Residential laundry is projected to account for 46.0% share in 2026 as households outsource washing, ironing, and garment care.
- Households: Households are estimated to capture 52.0% share in 2026 due to repeat demand for daily wear and household textile care.
- Store-based Service: Store-based service is likely to hold 57.0% share in 2026 because neighborhood providers remain accessible and familiar.
- Daily Wear: Daily wear is projected to account for 41.0% share in 2026 as routine garment cleaning creates recurring service volume.
- Geography: India is forecast to grow at 6.2% CAGR through 2036, supported by urban households, hospitality growth, and organized laundry adoption.
- Analyst Opinion at Fact.MR
- Shambhu Nath Jha, Senior Analyst at Fact.MR, states, “Laundry and dry cleaning services are becoming more organized as customers expect reliability, convenience, and garment safety. Providers will gain where they can combine clean processing, faster pickup, clear pricing, and repeat service routines. The market will reward operators that turn garment cleaning into a dependable household and commercial service habit.”
- Strategic Implications
- Laundry operators must improve turnaround reliability to retain repeat customers.
- Dry cleaners should strengthen solvent safety and garment handling practices.
- App-based providers need route density before expanding pickup and delivery services.
- Methodology
- Fact.MR interviews laundry service operators, hotel linen managers, dry cleaners, app-based service providers, and commercial laundry contractors.
- Research reviews company filings, workplace safety guidance, textile service models, hospitality demand signals, and laundry service disclosures.
- Estimates use service frequency, order value, customer mix, commercial linen demand, and regional urban adoption.
- Forecasts are validated through provider checks, price review, customer behavior signals, and commercial laundry demand assessment.
Service operators are being pushed to decide between walk-in service models and pickup-based garment care. This shift is visible in urban households, hotels, corporate uniforms, and healthcare linen services. OSHA notes that dry cleaning hazards often relate to perchloroethylene exposure, which makes workplace practices and solvent control important for operators. A practical point often missed is that service growth depends on trust and turnaround time, not only garment volume. Customers need clean handling, predictable delivery, and garment safety.
The main inflection point arrives when laundry service becomes a scheduled convenience rather than an emergency errand. Operators trigger this shift by offering digital booking, repeat pickup routes, transparent pricing, and garment tracking. Once this happens, laundry services move from local shop visits to managed care routines.
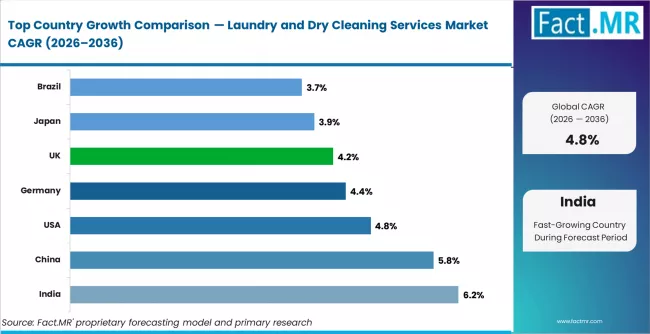
India is projected to record 6.2% CAGR through 2036 as urban households and hospitality users increase outsourced garment care. China is likely to grow at 5.8% CAGR through urban living, app-based service access, and commercial laundry demand. The United States is forecast to post 4.8% CAGR as households, hotels, and uniform rental services support repeat demand. Germany is projected to grow at 4.4% CAGR, the UK at 4.2% CAGR, Japan at 3.9% CAGR, and Brazil at 3.7% CAGR. Country variation depends on urban density, service affordability, hospitality activity, and consumer adoption of pickup-based laundry.
Segmental Analysis
Laundry and Dry Cleaning Services Market Analysis by Service Type
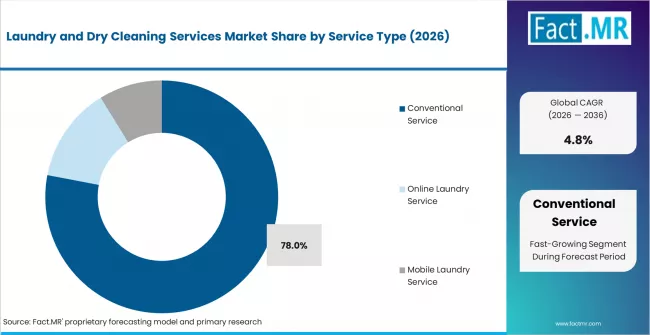
Conventional service is projected to hold 78.0% share in 2026 because store-based laundry and dry cleaning remain the most familiar service model. Many customers still prefer local providers for garment drop-off, stain discussion, and pickup certainty. Fact.MR analysis suggests that conventional service leads because trust and location access matter in garment care. Online laundry service is gaining adoption in dense urban markets. Mobile laundry works best where pickup routes can be planned efficiently. Self-service laundromats remain important for renters and students. Subscription laundry services are emerging where households prefer routine weekly cleaning. Service type choice depends on convenience, garment value, and customer trust.
- Local Trust: Conventional shops retain customers through familiarity and direct garment handling.
- Digital Convenience: Online laundry service reduces booking friction for urban customers.
- Route Economics: Mobile laundry works best in dense neighborhoods with repeat users.
Laundry and Dry Cleaning Services Market Analysis by Application
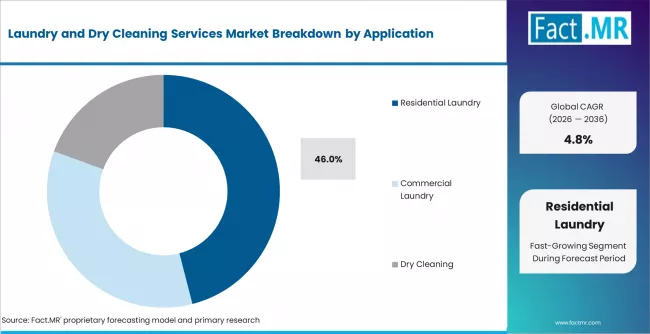
Residential laundry creates the largest application base as households generate frequent garment and linen cleaning needs. Daily wear, bedding, towels, and formal clothing support repeat service demand. Residential laundry is projected to account for 46.0% share in 2026 as urban consumers outsource time-consuming washing and ironing. Commercial laundry remains important for hotels, restaurants, gyms, and offices. Dry cleaning is used for delicate garments and formal wear. Textile care supports fabrics that need controlled cleaning and finishing. Specialty garment care serves wedding wear, leather, and premium fabrics. OSHA dry cleaning guidance notes that PERC-related hazards are addressed under general industry standards, which keeps dry cleaning safety relevant.
- Household Routine: Residential laundry creates repeat demand through daily wear and home textiles.
- Commercial Need: Hotels and offices require regular linen and uniform cleaning.
- Fabric Safety: Dry cleaning remains important for delicate and formal garments.
Laundry and Dry Cleaning Services Market Analysis by End User
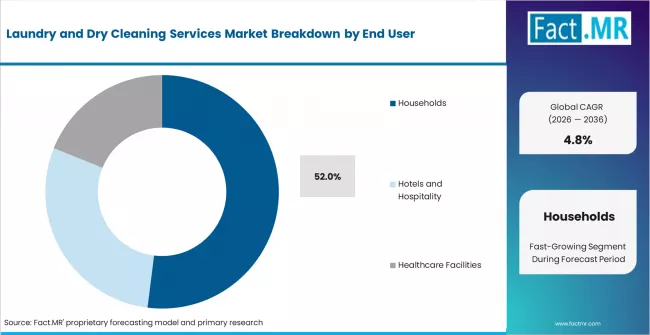
Households remain the largest end-user group because routine clothing care creates steady service demand. Time-constrained consumers use laundry services for washing, ironing, folding, and dry cleaning. Households are estimated to capture 52.0% share in 2026 as urban lifestyles raise reliance on outsourced garment care. Hotels and hospitality users need high-volume linen cleaning to support guest turnover. Healthcare facilities require strict textile handling for patient-care fabrics. Corporate and workwear users depend on regular uniform cleaning. Institutions such as schools and hostels use laundry services where internal capacity is limited. End-user needs differ by volume, hygiene requirement, and turnaround speed.
- Consumer Convenience: Households outsource laundry when time and space are limited.
- Hotel Turnover: Hospitality users need clean linens to maintain room availability.
- Uniform Care: Corporate users require dependable cleaning for workwear and staff presentation.
Laundry and Dry Cleaning Services Market Analysis by Service Format
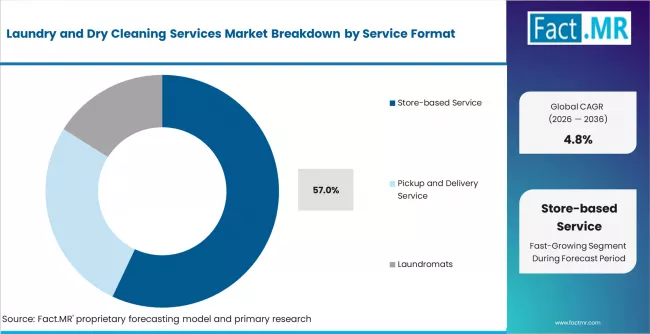
Store-based service remains the leading format because customers can physically hand over garments and confirm instructions. This format also supports alterations, stain treatment, and direct dispute handling. Store-based service is likely to hold 57.0% share in 2026 because neighborhood access remains important in most markets. Pickup and delivery service is expanding as customers value time savings. Laundromats serve renters, students, and households without adequate washing capacity. On-demand app-based service is growing in dense urban markets where logistics can be optimized. Cintas reports that its Uniform Rental and Facility Services segment uses operational efficiency, inventory use, and route-based service improvements to support growth, showing why route density matters in textile service operations. [2]
- Neighborhood Access: Store-based outlets support direct garment drop-off and pickup.
- Pickup Convenience: Delivery models reduce customer time spent on laundry errands.
- Self-service Need: Laundromats serve customers who need machines rather than full service.
Laundry and Dry Cleaning Services Market Analysis by Garment Type
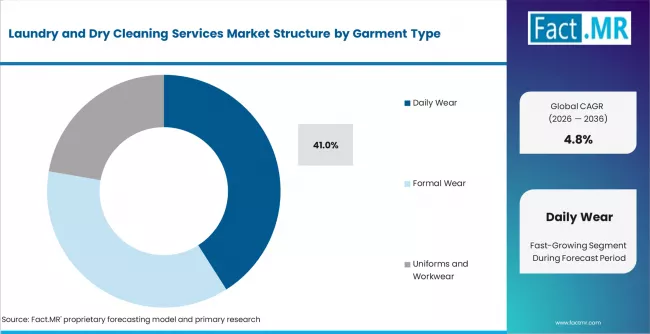
Daily wear is projected to account for 41.0% share in 2026 because routine clothing creates the highest repeat service volume. Shirts, trousers, dresses, uniforms, and casual wear require frequent cleaning and finishing. Formal wear remains important for dry cleaning because fabrics often need special handling. Uniforms and workwear support recurring commercial contracts. Bedding and linen care drives demand from households, hotels, and healthcare providers. Delicate and premium garments generate higher value per order but lower frequency. Elis reports that its services are rendered mainly to hospitality, industry, commerce and services, and healthcare customers, which supports the commercial linen and workwear demand logic. [3]
- Repeat Volume: Daily wear creates frequent cleaning and ironing needs.
- Commercial Textiles: Uniforms and linens support recurring service contracts.
- Premium Handling: Delicate garments need careful cleaning and finishing expertise.
Laundry and Dry Cleaning Services Market Drivers, Restraints, and Opportunities

Urban time pressure, service convenience, and commercial textile demand are the main demand anchors. Households outsource laundry when apartment living, work schedules, and garment volume make home washing less convenient. Hospitality and healthcare users create recurring demand for linen care. Elis reports flat linen and workwear revenue across its service categories, supporting the role of linen and uniform services in commercial textile care.
Labor cost, solvent regulation, and service consistency remain the main restraints. Laundry services depend on staff productivity, garment sorting, stain treatment, and timely delivery. Dry cleaning operators also face safety responsibilities linked with solvent exposure. OSHA states that many dry cleaning hazards relate to perchloroethylene and are addressed under general industry standards. Smaller shops may struggle with equipment upgrades and route delivery economics. Providers that cannot protect garment quality or meet delivery promises risk losing repeat customers.
Opportunities in the Laundry and Dry Cleaning Services Market
- Pickup Routes: Operators can grow through repeat pickup and delivery routes in dense urban areas.
- Commercial Linen: Hotels and healthcare facilities create recurring demand for outsourced textile care.
- Subscription Plans: Providers can stabilize revenue through weekly or monthly garment care packages.
Regional Analysis
Based on the regional analysis, the laundry and dry cleaning services market is segmented into North America, Latin America, Western Europe, Eastern Europe, East Asia, South Asia and Pacific, and Middle East and Africa across 40 plus countries.
.webp)
| Country | CAGR (2026 to 2036) |
|---|---|
| India | 6.2% |
| China | 5.8% |
| United States | 4.8% |
| Germany | 4.4% |
| UK | 4.2% |
| Japan | 3.9% |
| Brazil | 3.7% |
Source: Fact.MR analysis, based on proprietary forecasting model and primary research
South Asia and Pacific Laundry and Dry Cleaning Services Market Analysis
South Asia and Pacific is the fastest-growing regional zone because urban households and commercial users are increasing outsourced laundry use. India creates the strongest country opportunity through apartment living, dual-income households, and organized service platforms. Fact.MR analysis indicates that buyers in this region remain price-sensitive, but convenience is gaining weight. Service providers need reliable pickup timing, garment tracking, and transparent pricing. Growth is stronger in metro markets where route density supports delivery economics.
- India: India is projected to record 6.2% CAGR from 2026 to 2036 as urban households and hospitality users increase outsourced garment care. Apartment living and busy work schedules support demand for washing, ironing, and dry cleaning services. App-based booking improves access in metro areas. Providers with reliable pickup and clear pricing can gain repeat customers. Cost control remains important outside major cities.
East Asia Laundry and Dry Cleaning Services Market Analysis
East Asia demand is supported by urban lifestyles, hospitality activity, and growing acceptance of app-based services. China is the main growth country because urban consumers increasingly use convenience services. Japan has a mature garment care market where service quality and reliability shape demand.
- China: China is likely to grow at 5.8% CAGR over the assessment period as urban living and app-based service access support laundry and dry cleaning demand. Households use pickup-based services for time savings. Hotels and corporate users create recurring textile cleaning needs. Providers with digital scheduling and garment tracking can gain stronger retention. Service quality remains central to premium customer adoption.
- Japan: Japan has a mature laundry and dry cleaning service base with high customer expectations. Laundry and dry cleaning services demand in Japan is forecast to expand at 3.9% CAGR through 2036. Households value garment care quality and punctual service. Aging consumers may rely more on pickup and delivery. Providers gain where they combine careful fabric handling with convenient service formats.
North America Laundry and Dry Cleaning Services Market Analysis
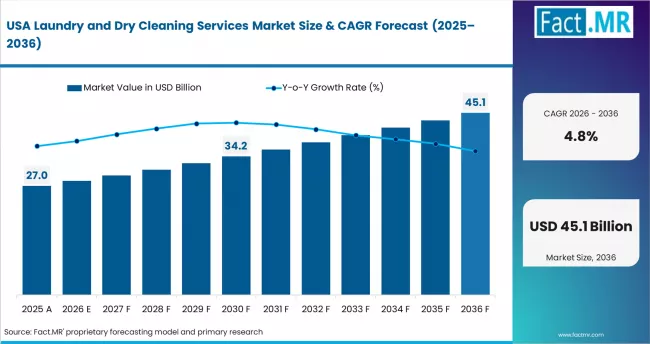
North America remains a major market because households, hotels, healthcare facilities, and workwear users generate repeat cleaning demand. The United States has a large base of dry cleaners, laundromats, and commercial textile service providers. Fact.MR analysis indicates that commercial laundry and uniform service operators benefit from route-based efficiency. Cintas’ 2025 results show continued revenue growth in uniform rental and facility services, which supports commercial textile service demand. [4]
- United States: The United States is forecast to post 4.8% CAGR by 2036 as households, hotels, and uniform rental services support repeat demand. Urban households use laundry services for convenience. Hospitality and healthcare users need reliable linen processing. Dry cleaners face ongoing solvent and labor considerations. Operators with efficient routes and digital booking can defend repeat service revenue.
Western Europe Laundry and Dry Cleaning Services Market Analysis

Western Europe demand is shaped by mature consumer habits, hospitality laundry, workwear cleaning, and environmental expectations. Germany and the UK are key markets in the region. Service quality, sustainability practices, and convenience influence provider selection. Fact.MR analysis suggests that commercial linen and workwear service providers hold stronger recurring demand than small one-off dry cleaning shops. Elis’ 2024 financial statements show services rendered mainly to hospitality, industry, commerce and services, and healthcare sectors.
- Germany: Germany is projected to grow at 4.4% CAGR during 2026 to 2036. Households, hotels, and workwear users support steady laundry and dry cleaning demand. Customers value service reliability and garment care quality. Commercial laundry providers benefit from recurring contracts. Environmental expectations can influence solvent choices and process upgrades.
- UK: The UK is expected to expand at 4.2% CAGR over the study period. Dense urban areas support store-based and pickup laundry services. Hospitality and healthcare users create demand for linen cleaning. Consumers increasingly prefer convenience where pickup and delivery are available. Providers with strong turnaround discipline can improve repeat use.
Latin America Laundry and Dry Cleaning Services Market Analysis
Latin America demand is supported by urban households, hospitality activity, and growing professional garment care services. Brazil leads regional demand because it has a large urban consumer base and expanding service access in major cities. Price sensitivity remains important, but service convenience is gaining traction. Fact.MR analysis indicates that providers need affordable packages and local outlet density to build repeat customers.
- Brazil: Brazil is projected to record 3.7% CAGR from 2026 to 2036. Urban households and hospitality users support laundry and dry cleaning demand. Store-based providers remain important, while pickup services are gaining in higher-income neighborhoods. Commercial laundry can expand through hotel and workwear contracts. Providers that balance price, garment care, and delivery reliability can build stronger retention.
Competitive Aligners for Market Players
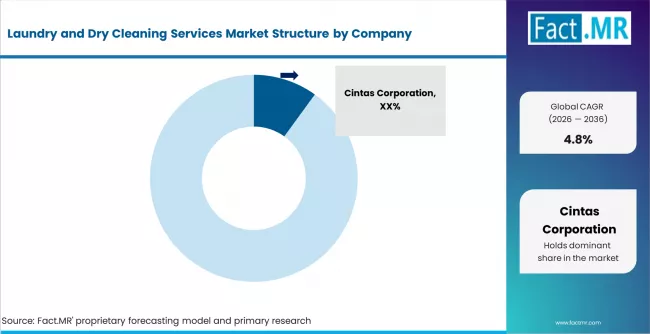
The laundry and dry cleaning services market is fragmented across local dry cleaners, laundromats, commercial laundry operators, franchise brands, and app-based platforms. Large commercial players gain through route density, linen contracts, and operational scale. Local providers compete through neighborhood trust and garment handling. Digital platforms compete through booking convenience and pickup logistics.
Competitive advantage depends on turnaround reliability, garment safety, and route economics. Cintas reports continued investment and efficiency gains in its Uniform Rental and Facility Services operations, which supports its position in commercial textile services. Elis reports large flat linen and workwear revenue categories, showing the importance of recurring commercial textile care. These companies show why scale and contract-based service models are important in commercial laundry.
Smaller operators remain relevant because garment care often depends on local trust. Dry cleaning providers must manage solvent exposure and workplace safety. OSHA’s dry cleaning guidance keeps perchloroethylene-related hazards central to operator compliance. [1] Providers that combine safe processing, fast turnaround, and customer-facing digital tools are better placed through 2036.
Key Players in Laundry and Dry Cleaning Services Market
- Cintas Corporation
- Elis SA
- Aramark
- UniFirst Corporation
- Alsco Uniforms
- The Huntington Company
- Tide Cleaners
- Rinse, Inc.
- Laundryheap
- Mulberrys Garment Care
- Lapels Cleaners
- ZIPS Cleaners
- CSC ServiceWorks
- Cleanly
Bibliography
- [1]. Occupational Safety and Health Administration. (2026). Dry cleaning. OSHA.
- [2]. Cintas Corporation. (2025). 2025 Form 10-K. Cintas Corporation.
- [3]. Elis SA. (2025, March 6). Financial statements 2024. Elis SA.
- [4]. Cintas Corporation. (2025, July 17). Cintas Corporation announces fiscal 2025 fourth quarter and full year results. Cintas Corporation.
This Report Addresses
- Strategic intelligence on laundry and dry cleaning services demand across conventional shops, pickup and delivery, laundromats, mobile service, and subscription laundry globally.
- Market forecast from USD 59.3 billion in 2026 to USD 94.8 billion by 2036 at a CAGR of 4.8%.
- Growth opportunity mapping across India urban service adoption, China app-based laundry access, United States commercial textile services, Germany garment care quality, and UK pickup demand.
- Segment analysis by service type, application, end user, service format, and garment type.
- Regional outlook covering South Asia urban laundry growth, East Asia digital service adoption, North America commercial textile services, Western Europe mature garment care, and Latin America urban service expansion.
- Competitive analysis of Cintas, Elis, Aramark, UniFirst, Alsco Uniforms, Tide Cleaners, Rinse, Laundryheap, Lapels Cleaners, and CSC ServiceWorks.
- Service assessment covering conventional laundry, dry cleaning, store-based service, pickup and delivery, commercial linen care, and workwear cleaning.
- Report delivered through PDF, Excel datasets, and presentation formats, supported by primary interviews, service provider checks, company disclosure review, pricing checks, and regional demand assessment.
Market Definition
The laundry and dry cleaning services market covers professional garment and textile cleaning services delivered through stores, laundromats, pickup and delivery providers, mobile units, hospitality laundries, healthcare laundries, and workwear service providers. The market includes washing, drying, ironing, folding, stain treatment, dry cleaning, linen care, and garment finishing. It differs from laundry products because revenue comes from cleaning service delivery rather than detergent or appliance sales.
Laundry and Dry Cleaning Services Market Inclusions
The scope includes conventional laundry service, dry cleaning, app-based laundry booking, pickup and delivery, self-service laundromats, mobile laundry, subscription laundry plans, hotel linen laundry, healthcare linen processing, corporate uniform cleaning, bedding and linen care, delicate garment care, stain removal, ironing, folding, and garment finishing. Services for households and commercial users are included when a third-party provider performs the cleaning or finishing work.
Laundry and Dry Cleaning Services Market Exclusions
The scope excludes detergent sales, washing machine sales, laundry appliance repair, textile manufacturing, garment rental without cleaning service, home cleaning services, and commercial cleaning unrelated to laundry. Uniform rental revenue is excluded unless cleaning and laundering are part of the service contract. Pure logistics platforms are excluded unless they directly manage laundry or dry cleaning transactions.
Laundry and Dry Cleaning Services Market Research Methodology
- Primary Research:Interviews with laundry chain operators, dry cleaning shop owners, hotel housekeeping managers, healthcare linen service providers, laundromat owners, and app-based laundry platforms.
- Desk Research:Review of company filings, workplace safety guidance, textile care standards, hospitality service activity, uniform rental disclosures, and commercial laundry operating models.
- Market-Sizing and Forecasting:Forecasting uses service visit frequency, average order value, urban household adoption, hospitality linen demand, healthcare textile needs, and commercial contract activity.
- Data Validation and Update Cycle:Forecasts are validated through operator interviews, service pricing checks, company disclosures, route-based service review, and regional urban demand assessment.
Scope of the Report

| Attribute | Details |
|---|---|
| Quantitative Units | USD 59.3 billion in 2026 to USD 94.8 billion by 2036, at a CAGR of 4.8% |
| Market Definition | Professional washing, drying, ironing, folding, dry cleaning, textile care, and garment finishing services delivered to households and commercial users. |
| Service Type | Conventional Service, Online Laundry Service, Mobile Laundry Service, Self-service Laundry, Subscription-based Laundry Service |
| Application | Residential Laundry, Commercial Laundry, Dry Cleaning, Textile Care, Specialty Garment Care |
| End User | Households, Hotels and Hospitality, Healthcare Facilities, Corporate and Workwear Users, Institutions |
| Service Format | Store-based Service, Pickup and Delivery Service, Laundromats, On-demand App-based Service |
| Garment Type | Daily Wear, Formal Wear, Uniforms and Workwear, Bedding and Linen, Delicate and Premium Garments |
| Regions Covered | North America, Latin America, Western Europe, Eastern Europe, East Asia, South Asia and Pacific, Middle East and Africa |
| Countries Covered | India, China, United States, Germany, UK, Japan, Brazil, and 40 plus countries |
| Key Companies Profiled | Cintas Corporation, Elis SA, Aramark, UniFirst Corporation, Alsco Uniforms, The Huntington Company, Tide Cleaners, Rinse, Laundryheap, Mulberrys Garment Care, Lapels Cleaners, ZIPS Cleaners, CSC ServiceWorks, Cleanly |
| Forecast Period | 2026 to 2036 |
| Approach | Hybrid top-down and bottom-up model using service visit frequency, average order value, household adoption, commercial linen demand, route density, and primary interviews with service operators. |
Laundry and Dry Cleaning Services Market Analysis by Segments
-
By Service Type:
- Conventional Service
- Online Laundry Service
- Mobile Laundry Service
- Self-service Laundry
- Subscription-based Laundry Service
-
By Application:
- Residential Laundry
- Commercial Laundry
- Dry Cleaning
- Textile Care
- Specialty Garment Care
-
By End User:
- Households
- Hotels and Hospitality
- Healthcare Facilities
- Corporate and Workwear Users
- Institutions
-
By Service Format:
- Store-based Service
- Pickup and Delivery Service
- Laundromats
- On-demand App-based Service
- By Garment Type:
- Daily Wear
- Formal Wear
- Uniforms and Workwear
- Bedding and Linen
- Delicate and Premium Garments
-
By Region:
- North America
- United States
- Canada
- Latin America
- Brazil
- Mexico
- Western Europe
- Germany
- UK
- France
- Eastern Europe
- Poland
- Russia
- East Asia
- China
- Japan
- South Korea
- South Asia and Pacific
- India
- ASEAN
- Australia and New Zealand
- Middle East and Africa
- GCC
- South Africa
- North America
- Frequently Asked Questions -
What is the future outlook for the laundry and dry cleaning service market?
By 2032, the laundry and dry cleaning services market is expected to reach a valuation of US$ 76.3 billion.
Which region is set to be the fastest-growing market?
The market in South Asia & Oceania is expected to increase at a CAGR of 6.1%.
How did the market perform over the past few years?
From 2017 to 2021, revenue of laundry and dry cleaning service providers increased at 3.7% CAGR.
What is the market size of the East Asian region?
In 2021, the East Asia market for laundry and dry cleaning services stood at US$ 9.1 billion.
Table of Content
- Executive Summary
- Global Market Outlook
- Demand to side Trends
- Supply to side Trends
- Technology Roadmap Analysis
- Analysis and Recommendations
- Market Overview
- Market Coverage / Taxonomy
- Market Definition / Scope / Limitations
- Research Methodology
- Chapter Orientation
- Analytical Lens and Working Hypotheses
- Market Structure, Signals, and Trend Drivers
- Benchmarking and Cross-market Comparability
- Market Sizing, Forecasting, and Opportunity Mapping
- Research Design and Evidence Framework
- Desk Research Programme (Secondary Evidence)
- Company Annual and Sustainability Reports
- Peer-reviewed Journals and Academic Literature
- Corporate Websites, Product Literature, and Technical Notes
- Earnings Decks and Investor Briefings
- Statutory Filings and Regulatory Disclosures
- Technical White Papers and Standards Notes
- Trade Journals, Industry Magazines, and Analyst Briefs
- Conference Proceedings, Webinars, and Seminar Materials
- Government Statistics Portals and Public Data Releases
- Press Releases and Reputable Media Coverage
- Specialist Newsletters and Curated Briefings
- Sector Databases and Reference Repositories
- Fact.MR Internal Proprietary Databases and Historical Market Datasets
- Subscription Datasets and Paid Sources
- Social Channels, Communities, and Digital Listening Inputs
- Additional Desk Sources
- Expert Input and Fieldwork (Primary Evidence)
- Primary Modes
- Qualitative Interviews and Expert Elicitation
- Quantitative Surveys and Structured Data Capture
- Blended Approach
- Why Primary Evidence is Used
- Field Techniques
- Interviews
- Surveys
- Focus Groups
- Observational and In-context Research
- Social and Community Interactions
- Stakeholder Universe Engaged
- C-suite Leaders
- Board Members
- Presidents and Vice Presidents
- R&D and Innovation Heads
- Technical Specialists
- Domain Subject-matter Experts
- Scientists
- Physicians and Other Healthcare Professionals
- Governance, Ethics, and Data Stewardship
- Research Ethics
- Data Integrity and Handling
- Primary Modes
- Tooling, Models, and Reference Databases
- Desk Research Programme (Secondary Evidence)
- Data Engineering and Model Build
- Data Acquisition and Ingestion
- Cleaning, Normalisation, and Verification
- Synthesis, Triangulation, and Analysis
- Quality Assurance and Audit Trail
- Market Background
- Market Dynamics
- Drivers
- Restraints
- Opportunity
- Trends
- Scenario Forecast
- Demand in Optimistic Scenario
- Demand in Likely Scenario
- Demand in Conservative Scenario
- Opportunity Map Analysis
- Product Life Cycle Analysis
- Supply Chain Analysis
- Investment Feasibility Matrix
- Value Chain Analysis
- PESTLE and Porter’s Analysis
- Regulatory Landscape
- Regional Parent Market Outlook
- Production and Consumption Statistics
- Import and Export Statistics
- Market Dynamics
- Global Market Analysis 2021 to 2025 and Forecast, 2026 to 2036
- Historical Market Size Value (USD Million) Analysis, 2021 to 2025
- Current and Future Market Size Value (USD Million) Projections, 2026 to 2036
- Y to o to Y Growth Trend Analysis
- Absolute $ Opportunity Analysis
- Global Market Pricing Analysis 2021 to 2025 and Forecast 2026 to 2036
- Global Market Analysis 2021 to 2025 and Forecast 2026 to 2036, By Backing Material
- Introduction / Key Findings
- Historical Market Size Value (USD Million) Analysis By Backing Material , 2021 to 2025
- Current and Future Market Size Value (USD Million) Analysis and Forecast By Backing Material , 2026 to 2036
- Non-woven
- Fabric
- Paper
- Non-woven
- Y to o to Y Growth Trend Analysis By Backing Material , 2021 to 2025
- Absolute $ Opportunity Analysis By Backing Material , 2026 to 2036
- Global Market Analysis 2021 to 2025 and Forecast 2026 to 2036, By Resin Type
- Introduction / Key Findings
- Historical Market Size Value (USD Million) Analysis By Resin Type, 2021 to 2025
- Current and Future Market Size Value (USD Million) Analysis and Forecast By Resin Type, 2026 to 2036
- Acrylic-based
- Silicone-based
- Rubber-based
- Acrylic-based
- Y to o to Y Growth Trend Analysis By Resin Type, 2021 to 2025
- Absolute $ Opportunity Analysis By Resin Type, 2026 to 2036
- Global Market Analysis 2021 to 2025 and Forecast 2026 to 2036, By Application
- Introduction / Key Findings
- Historical Market Size Value (USD Million) Analysis By Application, 2021 to 2025
- Current and Future Market Size Value (USD Million) Analysis and Forecast By Application, 2026 to 2036
- Wound Dressing
- Surgical Securement
- IV Line Securement
- Wound Dressing
- Y to o to Y Growth Trend Analysis By Application, 2021 to 2025
- Absolute $ Opportunity Analysis By Application, 2026 to 2036
- Global Market Analysis 2021 to 2025 and Forecast 2026 to 2036, By End User
- Introduction / Key Findings
- Historical Market Size Value (USD Million) Analysis By End User, 2021 to 2025
- Current and Future Market Size Value (USD Million) Analysis and Forecast By End User, 2026 to 2036
- Hospitals
- Ambulatory Surgical Centers
- Clinics
- Hospitals
- Y to o to Y Growth Trend Analysis By End User, 2021 to 2025
- Absolute $ Opportunity Analysis By End User, 2026 to 2036
- Global Market Analysis 2021 to 2025 and Forecast 2026 to 2036, By Distribution Channel
- Introduction / Key Findings
- Historical Market Size Value (USD Million) Analysis By Distribution Channel, 2021 to 2025
- Current and Future Market Size Value (USD Million) Analysis and Forecast By Distribution Channel, 2026 to 2036
- Direct Institutional Sales
- Medical Distributors
- Retail Pharmacies
- Direct Institutional Sales
- Y to o to Y Growth Trend Analysis By Distribution Channel, 2021 to 2025
- Absolute $ Opportunity Analysis By Distribution Channel, 2026 to 2036
- Global Market Analysis 2021 to 2025 and Forecast 2026 to 2036, By Region
- Introduction
- Historical Market Size Value (USD Million) Analysis By Region, 2021 to 2025
- Current Market Size Value (USD Million) Analysis and Forecast By Region, 2026 to 2036
- North America
- Latin America
- Western Europe
- Eastern Europe
- East Asia
- South Asia and Pacific
- Middle East & Africa
- Market Attractiveness Analysis By Region
- North America Market Analysis 2021 to 2025 and Forecast 2026 to 2036, By Country
- Historical Market Size Value (USD Million) Trend Analysis By Market Taxonomy, 2021 to 2025
- Market Size Value (USD Million) Forecast By Market Taxonomy, 2026 to 2036
- By Country
- USA
- Canada
- Mexico
- By Backing Material
- By Resin Type
- By Application
- By End User
- By Distribution Channel
- By Country
- Market Attractiveness Analysis
- By Country
- By Backing Material
- By Resin Type
- By Application
- By End User
- By Distribution Channel
- Key Takeaways
- Latin America Market Analysis 2021 to 2025 and Forecast 2026 to 2036, By Country
- Historical Market Size Value (USD Million) Trend Analysis By Market Taxonomy, 2021 to 2025
- Market Size Value (USD Million) Forecast By Market Taxonomy, 2026 to 2036
- By Country
- Brazil
- Chile
- Rest of Latin America
- By Backing Material
- By Resin Type
- By Application
- By End User
- By Distribution Channel
- By Country
- Market Attractiveness Analysis
- By Country
- By Backing Material
- By Resin Type
- By Application
- By End User
- By Distribution Channel
- Key Takeaways
- Western Europe Market Analysis 2021 to 2025 and Forecast 2026 to 2036, By Country
- Historical Market Size Value (USD Million) Trend Analysis By Market Taxonomy, 2021 to 2025
- Market Size Value (USD Million) Forecast By Market Taxonomy, 2026 to 2036
- By Country
- Germany
- UK
- Italy
- Spain
- France
- Nordic
- BENELUX
- Rest of Western Europe
- By Backing Material
- By Resin Type
- By Application
- By End User
- By Distribution Channel
- By Country
- Market Attractiveness Analysis
- By Country
- By Backing Material
- By Resin Type
- By Application
- By End User
- By Distribution Channel
- Key Takeaways
- Eastern Europe Market Analysis 2021 to 2025 and Forecast 2026 to 2036, By Country
- Historical Market Size Value (USD Million) Trend Analysis By Market Taxonomy, 2021 to 2025
- Market Size Value (USD Million) Forecast By Market Taxonomy, 2026 to 2036
- By Country
- Russia
- Poland
- Hungary
- Balkan & Baltic
- Rest of Eastern Europe
- By Backing Material
- By Resin Type
- By Application
- By End User
- By Distribution Channel
- By Country
- Market Attractiveness Analysis
- By Country
- By Backing Material
- By Resin Type
- By Application
- By End User
- By Distribution Channel
- Key Takeaways
- East Asia Market Analysis 2021 to 2025 and Forecast 2026 to 2036, By Country
- Historical Market Size Value (USD Million) Trend Analysis By Market Taxonomy, 2021 to 2025
- Market Size Value (USD Million) Forecast By Market Taxonomy, 2026 to 2036
- By Country
- China
- Japan
- South Korea
- By Backing Material
- By Resin Type
- By Application
- By End User
- By Distribution Channel
- By Country
- Market Attractiveness Analysis
- By Country
- By Backing Material
- By Resin Type
- By Application
- By End User
- By Distribution Channel
- Key Takeaways
- South Asia and Pacific Market Analysis 2021 to 2025 and Forecast 2026 to 2036, By Country
- Historical Market Size Value (USD Million) Trend Analysis By Market Taxonomy, 2021 to 2025
- Market Size Value (USD Million) Forecast By Market Taxonomy, 2026 to 2036
- By Country
- India
- ASEAN
- Australia & New Zealand
- Rest of South Asia and Pacific
- By Backing Material
- By Resin Type
- By Application
- By End User
- By Distribution Channel
- By Country
- Market Attractiveness Analysis
- By Country
- By Backing Material
- By Resin Type
- By Application
- By End User
- By Distribution Channel
- Key Takeaways
- Middle East & Africa Market Analysis 2021 to 2025 and Forecast 2026 to 2036, By Country
- Historical Market Size Value (USD Million) Trend Analysis By Market Taxonomy, 2021 to 2025
- Market Size Value (USD Million) Forecast By Market Taxonomy, 2026 to 2036
- By Country
- Kingdom of Saudi Arabia
- Other GCC Countries
- Turkiye
- South Africa
- Other African Union
- Rest of Middle East & Africa
- By Backing Material
- By Resin Type
- By Application
- By End User
- By Distribution Channel
- By Country
- Market Attractiveness Analysis
- By Country
- By Backing Material
- By Resin Type
- By Application
- By End User
- By Distribution Channel
- Key Takeaways
- Key Countries Market Analysis
- USA
- Pricing Analysis
- Market Share Analysis, 2025
- By Backing Material
- By Resin Type
- By Application
- By End User
- By Distribution Channel
- Canada
- Pricing Analysis
- Market Share Analysis, 2025
- By Backing Material
- By Resin Type
- By Application
- By End User
- By Distribution Channel
- Mexico
- Pricing Analysis
- Market Share Analysis, 2025
- By Backing Material
- By Resin Type
- By Application
- By End User
- By Distribution Channel
- Brazil
- Pricing Analysis
- Market Share Analysis, 2025
- By Backing Material
- By Resin Type
- By Application
- By End User
- By Distribution Channel
- Chile
- Pricing Analysis
- Market Share Analysis, 2025
- By Backing Material
- By Resin Type
- By Application
- By End User
- By Distribution Channel
- Germany
- Pricing Analysis
- Market Share Analysis, 2025
- By Backing Material
- By Resin Type
- By Application
- By End User
- By Distribution Channel
- UK
- Pricing Analysis
- Market Share Analysis, 2025
- By Backing Material
- By Resin Type
- By Application
- By End User
- By Distribution Channel
- Italy
- Pricing Analysis
- Market Share Analysis, 2025
- By Backing Material
- By Resin Type
- By Application
- By End User
- By Distribution Channel
- Spain
- Pricing Analysis
- Market Share Analysis, 2025
- By Backing Material
- By Resin Type
- By Application
- By End User
- By Distribution Channel
- France
- Pricing Analysis
- Market Share Analysis, 2025
- By Backing Material
- By Resin Type
- By Application
- By End User
- By Distribution Channel
- India
- Pricing Analysis
- Market Share Analysis, 2025
- By Backing Material
- By Resin Type
- By Application
- By End User
- By Distribution Channel
- ASEAN
- Pricing Analysis
- Market Share Analysis, 2025
- By Backing Material
- By Resin Type
- By Application
- By End User
- By Distribution Channel
- Australia & New Zealand
- Pricing Analysis
- Market Share Analysis, 2025
- By Backing Material
- By Resin Type
- By Application
- By End User
- By Distribution Channel
- China
- Pricing Analysis
- Market Share Analysis, 2025
- By Backing Material
- By Resin Type
- By Application
- By End User
- By Distribution Channel
- Japan
- Pricing Analysis
- Market Share Analysis, 2025
- By Backing Material
- By Resin Type
- By Application
- By End User
- By Distribution Channel
- South Korea
- Pricing Analysis
- Market Share Analysis, 2025
- By Backing Material
- By Resin Type
- By Application
- By End User
- By Distribution Channel
- Russia
- Pricing Analysis
- Market Share Analysis, 2025
- By Backing Material
- By Resin Type
- By Application
- By End User
- By Distribution Channel
- Poland
- Pricing Analysis
- Market Share Analysis, 2025
- By Backing Material
- By Resin Type
- By Application
- By End User
- By Distribution Channel
- Hungary
- Pricing Analysis
- Market Share Analysis, 2025
- By Backing Material
- By Resin Type
- By Application
- By End User
- By Distribution Channel
- Kingdom of Saudi Arabia
- Pricing Analysis
- Market Share Analysis, 2025
- By Backing Material
- By Resin Type
- By Application
- By End User
- By Distribution Channel
- Turkiye
- Pricing Analysis
- Market Share Analysis, 2025
- By Backing Material
- By Resin Type
- By Application
- By End User
- By Distribution Channel
- South Africa
- Pricing Analysis
- Market Share Analysis, 2025
- By Backing Material
- By Resin Type
- By Application
- By End User
- By Distribution Channel
- USA
- Market Structure Analysis
- Competition Dashboard
- Competition Benchmarking
- Market Share Analysis of Top Players
- By Regional
- By Backing Material
- By Resin Type
- By Application
- By End User
- By Distribution Channel
- Competition Analysis
- Competition Deep Dive
- 3M
- Overview
- Product Portfolio
- Profitability by Market Segments (Product/Age /Sales Channel/Region)
- Sales Footprint
- Strategy Overview
- Marketing Strategy
- Product Strategy
- Channel Strategy
- Cardinal Health
- Medtronic
- Johnson & Johnson
- Smith+Nephew
- Nitto Denko Corporation
- Avery Dennison Corporation
- 3M
- Competition Deep Dive
- Assumptions & Acronyms Used
List Of Table
- Table 1: Global Market Value (USD Million) Forecast by Region, 2021 to 2036
- Table 2: Global Market Value (USD Million) Forecast by Backing Material, 2021 to 2036
- Table 3: Global Market Value (USD Million) Forecast by Resin Type, 2021 to 2036
- Table 4: Global Market Value (USD Million) Forecast by Application, 2021 to 2036
- Table 5: Global Market Value (USD Million) Forecast by End User, 2021 to 2036
- Table 6: Global Market Value (USD Million) Forecast by Distribution Channel, 2021 to 2036
- Table 7: North America Market Value (USD Million) Forecast by Country, 2021 to 2036
- Table 8: North America Market Value (USD Million) Forecast by Backing Material, 2021 to 2036
- Table 9: North America Market Value (USD Million) Forecast by Resin Type, 2021 to 2036
- Table 10: North America Market Value (USD Million) Forecast by Application, 2021 to 2036
- Table 11: North America Market Value (USD Million) Forecast by End User, 2021 to 2036
- Table 12: North America Market Value (USD Million) Forecast by Distribution Channel, 2021 to 2036
- Table 13: Latin America Market Value (USD Million) Forecast by Country, 2021 to 2036
- Table 14: Latin America Market Value (USD Million) Forecast by Backing Material, 2021 to 2036
- Table 15: Latin America Market Value (USD Million) Forecast by Resin Type, 2021 to 2036
- Table 16: Latin America Market Value (USD Million) Forecast by Application, 2021 to 2036
- Table 17: Latin America Market Value (USD Million) Forecast by End User, 2021 to 2036
- Table 18: Latin America Market Value (USD Million) Forecast by Distribution Channel, 2021 to 2036
- Table 19: Western Europe Market Value (USD Million) Forecast by Country, 2021 to 2036
- Table 20: Western Europe Market Value (USD Million) Forecast by Backing Material, 2021 to 2036
- Table 21: Western Europe Market Value (USD Million) Forecast by Resin Type, 2021 to 2036
- Table 22: Western Europe Market Value (USD Million) Forecast by Application, 2021 to 2036
- Table 23: Western Europe Market Value (USD Million) Forecast by End User, 2021 to 2036
- Table 24: Western Europe Market Value (USD Million) Forecast by Distribution Channel, 2021 to 2036
- Table 25: Eastern Europe Market Value (USD Million) Forecast by Country, 2021 to 2036
- Table 26: Eastern Europe Market Value (USD Million) Forecast by Backing Material, 2021 to 2036
- Table 27: Eastern Europe Market Value (USD Million) Forecast by Resin Type, 2021 to 2036
- Table 28: Eastern Europe Market Value (USD Million) Forecast by Application, 2021 to 2036
- Table 29: Eastern Europe Market Value (USD Million) Forecast by End User, 2021 to 2036
- Table 30: Eastern Europe Market Value (USD Million) Forecast by Distribution Channel, 2021 to 2036
- Table 31: East Asia Market Value (USD Million) Forecast by Country, 2021 to 2036
- Table 32: East Asia Market Value (USD Million) Forecast by Backing Material, 2021 to 2036
- Table 33: East Asia Market Value (USD Million) Forecast by Resin Type, 2021 to 2036
- Table 34: East Asia Market Value (USD Million) Forecast by Application, 2021 to 2036
- Table 35: East Asia Market Value (USD Million) Forecast by End User, 2021 to 2036
- Table 36: East Asia Market Value (USD Million) Forecast by Distribution Channel, 2021 to 2036
- Table 37: South Asia and Pacific Market Value (USD Million) Forecast by Country, 2021 to 2036
- Table 38: South Asia and Pacific Market Value (USD Million) Forecast by Backing Material, 2021 to 2036
- Table 39: South Asia and Pacific Market Value (USD Million) Forecast by Resin Type, 2021 to 2036
- Table 40: South Asia and Pacific Market Value (USD Million) Forecast by Application, 2021 to 2036
- Table 41: South Asia and Pacific Market Value (USD Million) Forecast by End User, 2021 to 2036
- Table 42: South Asia and Pacific Market Value (USD Million) Forecast by Distribution Channel, 2021 to 2036
- Table 43: Middle East & Africa Market Value (USD Million) Forecast by Country, 2021 to 2036
- Table 44: Middle East & Africa Market Value (USD Million) Forecast by Backing Material, 2021 to 2036
- Table 45: Middle East & Africa Market Value (USD Million) Forecast by Resin Type, 2021 to 2036
- Table 46: Middle East & Africa Market Value (USD Million) Forecast by Application, 2021 to 2036
- Table 47: Middle East & Africa Market Value (USD Million) Forecast by End User, 2021 to 2036
- Table 48: Middle East & Africa Market Value (USD Million) Forecast by Distribution Channel, 2021 to 2036
List Of Figures
- Figure 1: Global Market Pricing Analysis
- Figure 2: Global Market Value (USD Million) Forecast 2021-2036
- Figure 3: Global Market Value Share and BPS Analysis by Backing Material, 2026 and 2036
- Figure 4: Global Market Y-o-Y Growth Comparison by Backing Material, 2026 to 2036
- Figure 5: Global Market Attractiveness Analysis by Backing Material
- Figure 6: Global Market Value Share and BPS Analysis by Resin Type, 2026 and 2036
- Figure 7: Global Market Y-o-Y Growth Comparison by Resin Type, 2026 to 2036
- Figure 8: Global Market Attractiveness Analysis by Resin Type
- Figure 9: Global Market Value Share and BPS Analysis by Application, 2026 and 2036
- Figure 10: Global Market Y-o-Y Growth Comparison by Application, 2026 to 2036
- Figure 11: Global Market Attractiveness Analysis by Application
- Figure 12: Global Market Value Share and BPS Analysis by End User, 2026 and 2036
- Figure 13: Global Market Y-o-Y Growth Comparison by End User, 2026 to 2036
- Figure 14: Global Market Attractiveness Analysis by End User
- Figure 15: Global Market Value Share and BPS Analysis by Distribution Channel, 2026 and 2036
- Figure 16: Global Market Y-o-Y Growth Comparison by Distribution Channel, 2026 to 2036
- Figure 17: Global Market Attractiveness Analysis by Distribution Channel
- Figure 18: Global Market Value (USD Million) Share and BPS Analysis by Region, 2026 and 2036
- Figure 19: Global Market Y-o-Y Growth Comparison by Region, 2026 to 2036
- Figure 20: Global Market Attractiveness Analysis by Region
- Figure 21: North America Market Incremental Dollar Opportunity, 2026 to 2036
- Figure 22: Latin America Market Incremental Dollar Opportunity, 2026 to 2036
- Figure 23: Western Europe Market Incremental Dollar Opportunity, 2026 to 2036
- Figure 24: Eastern Europe Market Incremental Dollar Opportunity, 2026 to 2036
- Figure 25: East Asia Market Incremental Dollar Opportunity, 2026 to 2036
- Figure 26: South Asia and Pacific Market Incremental Dollar Opportunity, 2026 to 2036
- Figure 27: Middle East & Africa Market Incremental Dollar Opportunity, 2026 to 2036
- Figure 28: North America Market Value Share and BPS Analysis by Country, 2026 and 2036
- Figure 29: North America Market Value Share and BPS Analysis by Backing Material, 2026 and 2036
- Figure 30: North America Market Y-o-Y Growth Comparison by Backing Material, 2026 to 2036
- Figure 31: North America Market Attractiveness Analysis by Backing Material
- Figure 32: North America Market Value Share and BPS Analysis by Resin Type, 2026 and 2036
- Figure 33: North America Market Y-o-Y Growth Comparison by Resin Type, 2026 to 2036
- Figure 34: North America Market Attractiveness Analysis by Resin Type
- Figure 35: North America Market Value Share and BPS Analysis by Application, 2026 and 2036
- Figure 36: North America Market Y-o-Y Growth Comparison by Application, 2026 to 2036
- Figure 37: North America Market Attractiveness Analysis by Application
- Figure 38: North America Market Value Share and BPS Analysis by End User, 2026 and 2036
- Figure 39: North America Market Y-o-Y Growth Comparison by End User, 2026 to 2036
- Figure 40: North America Market Attractiveness Analysis by End User
- Figure 41: North America Market Value Share and BPS Analysis by Distribution Channel, 2026 and 2036
- Figure 42: North America Market Y-o-Y Growth Comparison by Distribution Channel, 2026 to 2036
- Figure 43: North America Market Attractiveness Analysis by Distribution Channel
- Figure 44: Latin America Market Value Share and BPS Analysis by Country, 2026 and 2036
- Figure 45: Latin America Market Value Share and BPS Analysis by Backing Material, 2026 and 2036
- Figure 46: Latin America Market Y-o-Y Growth Comparison by Backing Material, 2026 to 2036
- Figure 47: Latin America Market Attractiveness Analysis by Backing Material
- Figure 48: Latin America Market Value Share and BPS Analysis by Resin Type, 2026 and 2036
- Figure 49: Latin America Market Y-o-Y Growth Comparison by Resin Type, 2026 to 2036
- Figure 50: Latin America Market Attractiveness Analysis by Resin Type
- Figure 51: Latin America Market Value Share and BPS Analysis by Application, 2026 and 2036
- Figure 52: Latin America Market Y-o-Y Growth Comparison by Application, 2026 to 2036
- Figure 53: Latin America Market Attractiveness Analysis by Application
- Figure 54: Latin America Market Value Share and BPS Analysis by End User, 2026 and 2036
- Figure 55: Latin America Market Y-o-Y Growth Comparison by End User, 2026 to 2036
- Figure 56: Latin America Market Attractiveness Analysis by End User
- Figure 57: Latin America Market Value Share and BPS Analysis by Distribution Channel, 2026 and 2036
- Figure 58: Latin America Market Y-o-Y Growth Comparison by Distribution Channel, 2026 to 2036
- Figure 59: Latin America Market Attractiveness Analysis by Distribution Channel
- Figure 60: Western Europe Market Value Share and BPS Analysis by Country, 2026 and 2036
- Figure 61: Western Europe Market Value Share and BPS Analysis by Backing Material, 2026 and 2036
- Figure 62: Western Europe Market Y-o-Y Growth Comparison by Backing Material, 2026 to 2036
- Figure 63: Western Europe Market Attractiveness Analysis by Backing Material
- Figure 64: Western Europe Market Value Share and BPS Analysis by Resin Type, 2026 and 2036
- Figure 65: Western Europe Market Y-o-Y Growth Comparison by Resin Type, 2026 to 2036
- Figure 66: Western Europe Market Attractiveness Analysis by Resin Type
- Figure 67: Western Europe Market Value Share and BPS Analysis by Application, 2026 and 2036
- Figure 68: Western Europe Market Y-o-Y Growth Comparison by Application, 2026 to 2036
- Figure 69: Western Europe Market Attractiveness Analysis by Application
- Figure 70: Western Europe Market Value Share and BPS Analysis by End User, 2026 and 2036
- Figure 71: Western Europe Market Y-o-Y Growth Comparison by End User, 2026 to 2036
- Figure 72: Western Europe Market Attractiveness Analysis by End User
- Figure 73: Western Europe Market Value Share and BPS Analysis by Distribution Channel, 2026 and 2036
- Figure 74: Western Europe Market Y-o-Y Growth Comparison by Distribution Channel, 2026 to 2036
- Figure 75: Western Europe Market Attractiveness Analysis by Distribution Channel
- Figure 76: Eastern Europe Market Value Share and BPS Analysis by Country, 2026 and 2036
- Figure 77: Eastern Europe Market Value Share and BPS Analysis by Backing Material, 2026 and 2036
- Figure 78: Eastern Europe Market Y-o-Y Growth Comparison by Backing Material, 2026 to 2036
- Figure 79: Eastern Europe Market Attractiveness Analysis by Backing Material
- Figure 80: Eastern Europe Market Value Share and BPS Analysis by Resin Type, 2026 and 2036
- Figure 81: Eastern Europe Market Y-o-Y Growth Comparison by Resin Type, 2026 to 2036
- Figure 82: Eastern Europe Market Attractiveness Analysis by Resin Type
- Figure 83: Eastern Europe Market Value Share and BPS Analysis by Application, 2026 and 2036
- Figure 84: Eastern Europe Market Y-o-Y Growth Comparison by Application, 2026 to 2036
- Figure 85: Eastern Europe Market Attractiveness Analysis by Application
- Figure 86: Eastern Europe Market Value Share and BPS Analysis by End User, 2026 and 2036
- Figure 87: Eastern Europe Market Y-o-Y Growth Comparison by End User, 2026 to 2036
- Figure 88: Eastern Europe Market Attractiveness Analysis by End User
- Figure 89: Eastern Europe Market Value Share and BPS Analysis by Distribution Channel, 2026 and 2036
- Figure 90: Eastern Europe Market Y-o-Y Growth Comparison by Distribution Channel, 2026 to 2036
- Figure 91: Eastern Europe Market Attractiveness Analysis by Distribution Channel
- Figure 92: East Asia Market Value Share and BPS Analysis by Country, 2026 and 2036
- Figure 93: East Asia Market Value Share and BPS Analysis by Backing Material, 2026 and 2036
- Figure 94: East Asia Market Y-o-Y Growth Comparison by Backing Material, 2026 to 2036
- Figure 95: East Asia Market Attractiveness Analysis by Backing Material
- Figure 96: East Asia Market Value Share and BPS Analysis by Resin Type, 2026 and 2036
- Figure 97: East Asia Market Y-o-Y Growth Comparison by Resin Type, 2026 to 2036
- Figure 98: East Asia Market Attractiveness Analysis by Resin Type
- Figure 99: East Asia Market Value Share and BPS Analysis by Application, 2026 and 2036
- Figure 100: East Asia Market Y-o-Y Growth Comparison by Application, 2026 to 2036
- Figure 101: East Asia Market Attractiveness Analysis by Application
- Figure 102: East Asia Market Value Share and BPS Analysis by End User, 2026 and 2036
- Figure 103: East Asia Market Y-o-Y Growth Comparison by End User, 2026 to 2036
- Figure 104: East Asia Market Attractiveness Analysis by End User
- Figure 105: East Asia Market Value Share and BPS Analysis by Distribution Channel, 2026 and 2036
- Figure 106: East Asia Market Y-o-Y Growth Comparison by Distribution Channel, 2026 to 2036
- Figure 107: East Asia Market Attractiveness Analysis by Distribution Channel
- Figure 108: South Asia and Pacific Market Value Share and BPS Analysis by Country, 2026 and 2036
- Figure 109: South Asia and Pacific Market Value Share and BPS Analysis by Backing Material, 2026 and 2036
- Figure 110: South Asia and Pacific Market Y-o-Y Growth Comparison by Backing Material, 2026 to 2036
- Figure 111: South Asia and Pacific Market Attractiveness Analysis by Backing Material
- Figure 112: South Asia and Pacific Market Value Share and BPS Analysis by Resin Type, 2026 and 2036
- Figure 113: South Asia and Pacific Market Y-o-Y Growth Comparison by Resin Type, 2026 to 2036
- Figure 114: South Asia and Pacific Market Attractiveness Analysis by Resin Type
- Figure 115: South Asia and Pacific Market Value Share and BPS Analysis by Application, 2026 and 2036
- Figure 116: South Asia and Pacific Market Y-o-Y Growth Comparison by Application, 2026 to 2036
- Figure 117: South Asia and Pacific Market Attractiveness Analysis by Application
- Figure 118: South Asia and Pacific Market Value Share and BPS Analysis by End User, 2026 and 2036
- Figure 119: South Asia and Pacific Market Y-o-Y Growth Comparison by End User, 2026 to 2036
- Figure 120: South Asia and Pacific Market Attractiveness Analysis by End User
- Figure 121: South Asia and Pacific Market Value Share and BPS Analysis by Distribution Channel, 2026 and 2036
- Figure 122: South Asia and Pacific Market Y-o-Y Growth Comparison by Distribution Channel, 2026 to 2036
- Figure 123: South Asia and Pacific Market Attractiveness Analysis by Distribution Channel
- Figure 124: Middle East & Africa Market Value Share and BPS Analysis by Country, 2026 and 2036
- Figure 125: Middle East & Africa Market Value Share and BPS Analysis by Backing Material, 2026 and 2036
- Figure 126: Middle East & Africa Market Y-o-Y Growth Comparison by Backing Material, 2026 to 2036
- Figure 127: Middle East & Africa Market Attractiveness Analysis by Backing Material
- Figure 128: Middle East & Africa Market Value Share and BPS Analysis by Resin Type, 2026 and 2036
- Figure 129: Middle East & Africa Market Y-o-Y Growth Comparison by Resin Type, 2026 to 2036
- Figure 130: Middle East & Africa Market Attractiveness Analysis by Resin Type
- Figure 131: Middle East & Africa Market Value Share and BPS Analysis by Application, 2026 and 2036
- Figure 132: Middle East & Africa Market Y-o-Y Growth Comparison by Application, 2026 to 2036
- Figure 133: Middle East & Africa Market Attractiveness Analysis by Application
- Figure 134: Middle East & Africa Market Value Share and BPS Analysis by End User, 2026 and 2036
- Figure 135: Middle East & Africa Market Y-o-Y Growth Comparison by End User, 2026 to 2036
- Figure 136: Middle East & Africa Market Attractiveness Analysis by End User
- Figure 137: Middle East & Africa Market Value Share and BPS Analysis by Distribution Channel, 2026 and 2036
- Figure 138: Middle East & Africa Market Y-o-Y Growth Comparison by Distribution Channel, 2026 to 2036
- Figure 139: Middle East & Africa Market Attractiveness Analysis by Distribution Channel
- Figure 140: Global Market - Tier Structure Analysis
- Figure 141: Global Market - Company Share Analysis
