- Market Value (2025): USD 1.4 Bn
- Estimated Value (2026): USD 1.4 Bn
- Forecast Value (2036): USD 2.0 Bn
- CAGR (2026-2036): 3.6%
What is the Light Vehicle Speedometer Market forecast to be worth by 2036?
USD 1.4 billion in 2026 to USD 2.0 billion by 2036 at a 3.6% CAGR.
- As per Fact.MR analysis, the light vehicle speedometer market reached USD 1.4 billion in 2025.
- Demand will increase from USD 1.4 billion in 2026 to USD 2.0 billion by 2036.
- The light vehicle speedometer market will record 3.6% CAGR from 2026 to 2036.
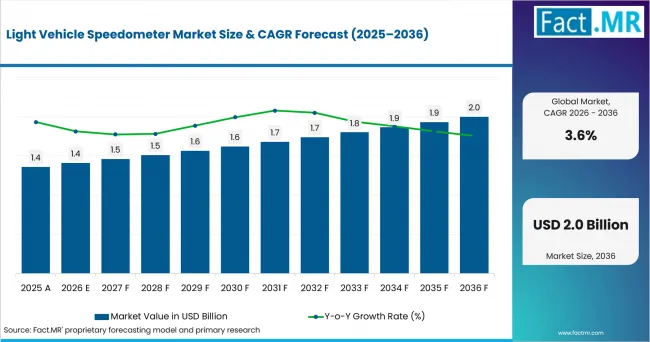
Light Vehicle Speedometer Market Value Analysis | Source: Fact.MR
What are the defining numbers behind Light Vehicle Speedometer Market growth?
An absolute opportunity of USD 0.6 billion will be created between 2026 and 2036.
- Demand Drivers in the Market
- Electric vehicle growth will lift demand for fully digital speed displays. The International Energy Agency reported that electric car sales exceeded 20 million in 2025, equal to one-quarter of new cars sold worldwide [1]. Battery models usually show speed on screens next to driving range.
- Road safety policy keeps the speed readout central to cluster design. The European Commission counted 19,940 road deaths in the EU in 2024, or 45 deaths per million inhabitants [2]. Intelligent speed assistance alerts under the EU General Safety Regulation appear beside the speedometer, adding software work to each cluster.
- Cockpit consolidation will move speed display functions onto shared processors. Tier 1 suppliers now offer cluster and infotainment functions on one hardware platform, so OEMs can scale a single design across trim levels.
- Accuracy rules under UN Regulation No. 39 keep calibration and validation work inside every vehicle program. A speedometer must never show a speed below the true vehicle speed, so suppliers test sensor inputs and tire sizes before type approval.
- Key Segments Analyzed
- By Product Type: Digital Speedometers will hold 58.3% share in 2026, supported by TFT cluster screens moving into mid-range cars.
- By Vehicle Type: Passenger Cars will account for 74.3% share in 2026 owing to higher build volumes and shorter redesign cycles.
- By Technology: Electronic speedometers will capture 66.7% share in 2026, reflecting wheel-speed signals shared over the vehicle network.
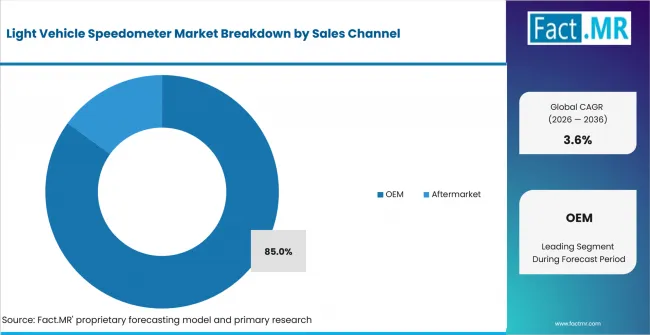
- By Sales Channel: OEM will represent 85.0% share in 2026 given that the cluster is fitted during vehicle assembly.
- Analyst Opinion at Fact.MR
- Shambhu Nath Jha, Principal Consultant at Fact.MR, states, “The speedometer has turned into a software feature inside the cluster screen, and that shift will shape supplier selection. OEMs now judge cluster suppliers on graphics performance and driver monitoring integration alongside unit cost. Analog gauges keep a role in cost-sensitive vans, yet their share of new programs will narrow with each model cycle.”
- Strategic Implications
- Tier 1 suppliers should build scalable cluster software so one speed display platform can serve entry and premium trims.
- OEMs should design speedometer graphics around intelligent speed assistance alerts, since speed-limit alerts appear next to the speed readout in EU vehicles.
- Display panel makers should secure automotive-grade TFT and OLED capacity, given that screens will replace more gauges in mid-range cars.
- Aftermarket distributors should keep analog and electromechanical replacement stock for older fleets, where repair demand will continue.
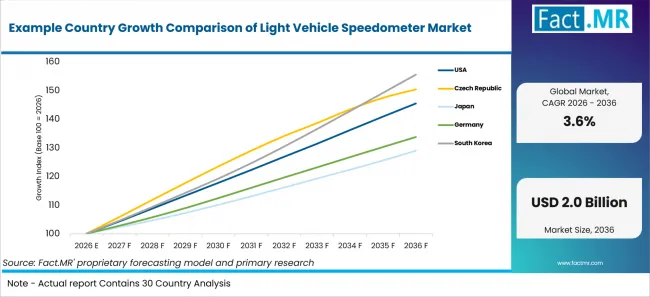
South Korea will post 4.5% CAGR through 2036, supported by electrified model output. The Czech Republic will record 4.2% as car assembly and an older fleet sustain demand. U.S. demand will grow at 3.8% given high travel volumes. Sweden will reach 3.4% because plug-in cars take most new registrations. Germany will grow at 3.0% as battery electric registrations lift digital cluster fitment. Japan will post 2.6% in a mature fleet.
How does the Light Vehicle Speedometer Market break down by segment?
Digital Speedometers will lead Product Type at 58.3%; Passenger Cars will lead Vehicle Type at 74.3%.
Which Product Type dominates?
Digital Speedometers will hold 58.3% share in 2026.
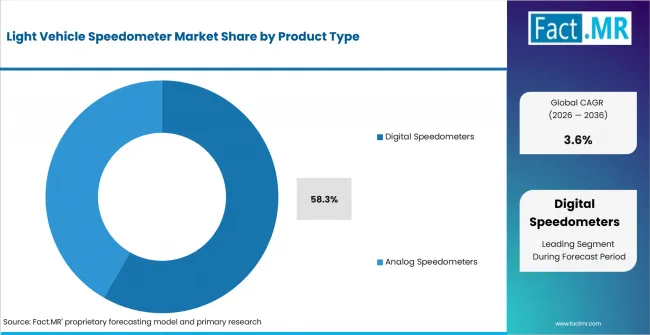
Light Vehicle Speedometer Market Analysis By Product Type | Source: Fact.MR
Digital speedometers will hold the lead, driven by vehicle makers now building the speed readout into TFT cluster screens that carry navigation and assistance status. The trend mirrors wider use of automotive smart displays in car interiors. Software can reconfigure one screen for different trims, which cuts tooling costs compared with printed dials.
Electric vehicles push the shift further since most battery models use digital clusters. The IEA reported that China sold more than 11 million electric cars in 2024, nearly half of all car sales in the country [3]. Analog speedometers keep a place in lower-cost combustion models and replacement channels.
What leads the Vehicle Type segment?
Passenger Cars will account for 74.3% share in 2026.
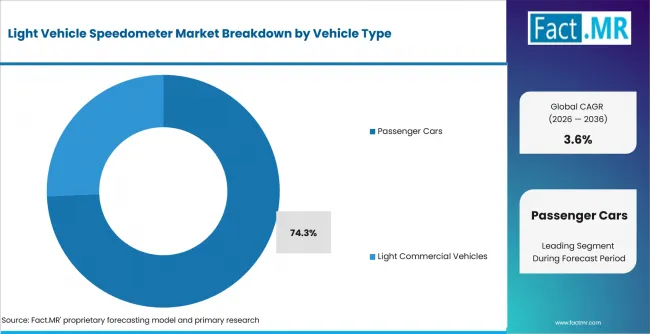
Light Vehicle Speedometer Market Analysis By Vehicle Type | Source: Fact.MR
Passenger cars make up most global light vehicle output and change cluster designs with each model refresh. Buyers compare cockpit screens in showrooms, so OEMs treat the speed display as a design feature. Light commercial vehicles follow longer model cycles, and many cargo vans keep simpler clusters sized for fleet cost targets.
Car ownership levels keep the installed base wide for new fitment and replacement. Eurostat reported an average of 0.55 passenger cars per inhabitant across the EU in 2023 [4].
How does Technology shape demand?
Electronic speedometers will lead with 66.7% share in 2026.
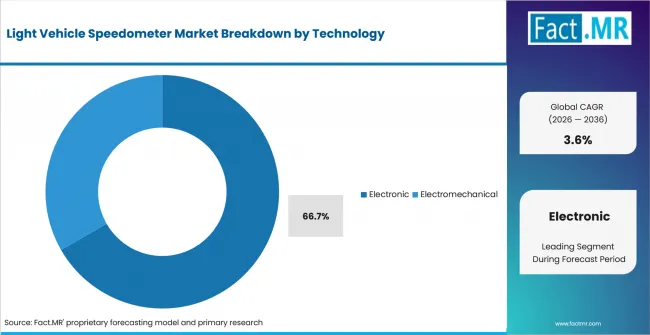
Light Vehicle Speedometer Market Analysis By Technology | Source: Fact.MR
Electronic speedometers will lead since modern cars already calculate road speed from wheel-speed sensors used by ABS and stability control. The cluster reads that signal over the vehicle network, so no mechanical cable is needed. Those readings can feed automotive human machine interface functions such as speed-limit alerts and driver warnings.
Electromechanical units remain in use where OEMs want a physical needle driven by a stepper motor. These designs are common in value models and some light commercial vehicles. Their share will narrow as screen costs fall and more platforms move to automotive cockpit electronics built around a central processor.
What supports OEM within Sales Channel?
OEM will represent 85.0% share in 2026.
Light Vehicle Speedometer Market Analysis By Sales Channel | Source: Fact.MR
OEM fitment will hold most volume, supported by the speedometer’s status as a mandatory instrument installed with the cluster during assembly. Tier 1 suppliers win these contracts years before launch and deliver the same part for the full model cycle. Type approval under UN Regulation No. 39 ties each speedometer to specific vehicle types.
Aftermarket demand comes from cluster failures, accident repairs and restoration of older vehicles. Independent workshops often repair or recalibrate existing clusters, which limits unit sales. Fleet operators can add fleet telematics sensor modules to monitor speed outside the factory-fitted cluster.
What is accelerating Light Vehicle Speedometer Market adoption, and what is holding it back?
Demand will rise with digital cluster adoption in electric and mid-range cars, supported by speed-limit display needs under road safety rules. Growth will be restrained by display costs in entry models and supply risks for cluster processors.
Drivers Impact Analysis
| DRIVER | (~) % IMPACT ON CAGR | GEOGRAPHIC RELEVANCE | IMPACT TIMELINE |
|---|---|---|---|
| Digital TFT cluster adoption in electric and mid-range cars | +1.0% | Global | Short term (<= 2 years) |
| Intelligent speed assistance and speed-limit display rules | +0.8% | Europe, East Asia | Medium term (2-4 years) |
| Cockpit consolidation onto shared cluster and infotainment hardware | +0.6% | North America, Europe, East Asia | Medium term (2-4 years) |
| Driver monitoring integration within cluster screens | +0.4% | Europe, Japan | Long term (>= 4 years) |
Opportunity Impact Analysis
| OPPORTUNITY | (~) % IMPACT ON CAGR | GEOGRAPHIC RELEVANCE | IMPACT TIMELINE |
|---|---|---|---|
| OLED and under-display camera clusters for premium models | +0.7% | Europe, North America | Medium term (2-4 years) |
| Cluster supply for export-focused assembly hubs | +0.5% | South Korea, Czech Republic | Medium term (2-4 years) |
| Replacement clusters for older passenger car fleets | +0.4% | Eastern Europe, North America | Short term (<= 2 years) |
Restraints Impact Analysis
| RESTRAINT | (~) % IMPACT ON CAGR | GEOGRAPHIC RELEVANCE | IMPACT TIMELINE |
|---|---|---|---|
| Display and processor cost pressure in entry vehicles | -0.6% | Global | Short term (<= 2 years) |
| Semiconductor supply and allocation risk for cluster processors | -0.5% | Global | Medium term (2-4 years) |
| Longer vehicle replacement cycles in mature markets | -0.3% | Japan, Western Europe | Long term (>= 4 years) |
Which countries are scaling the Light Vehicle Speedometer Market through 2036?
- The country comparison spans 1.9 percentage points between South Korea at 4.5% and Japan at 2.6%.
- South Korea will remain 0.3 percentage point above the Czech Republic as electrified model output raises digital cluster fitment.
- The Czech Republic will remain 0.4 percentage point above the United States through export-focused car assembly and an older fleet.
- U.S. growth will remain 0.4 percentage point above Sweden as high annual travel keeps speed accuracy in focus.
- Sweden will remain 0.4 percentage point above Germany through plug-in car registrations that favor screen-based clusters.
- Germany will remain 0.4 percentage point above Japan as battery electric registrations lift digital speedometer content.
- Japan will close the displayed range as cluster upgrades in a mature fleet follow model refreshes.
Comparable CAGRs can still create different entry conditions, since assembly scale and fleet age shape the OEM and replacement mix. Full report coverage includes North America, Latin America, Western Europe, Eastern Europe, East Asia, South Asia & Pacific, Middle East & Africa.
Example Country Growth Comparison Of Light Vehicle Speedometer Market | Source: Fact.MR
| Country | CAGR (2026-2036) |
|---|---|
| South Korea | 4.5% |
| Czech Republic | 4.2% |
| United States | 3.8% |
| Sweden | 3.4% |
| Germany | 3.0% |
| Japan | 2.6% |
What supports South Korea adoption?
4.5% CAGR, supported by electrified vehicle output and export-grade cluster content.
Korean plants built 4.1 million vehicles in 2025, according to the Ministry of Trade, Industry and Resources [5]. Eco-friendly vehicle sales reached 813,000 units in the same year, or 48% of new vehicle sales [5]. Hybrid and electric models ship with digital clusters that show speed beside energy flow data, raising electronic content per vehicle for domestic cluster suppliers.
How is the Czech Republic scaling demand?
4.2% CAGR, driven by passenger car assembly and replacement needs in an older fleet.
The Czech Statistical Office reported in September 2025 that the country ranks fourth in the EU for passenger cars per capita [6]. Its vehicle fleet is the second oldest in the EU, and the 2021 Census found that more than 2 million people used a car as their main way of getting to work [6]. Heavy car use and older vehicles support cluster repair demand, while domestic plants add steady OEM volumes.
What supports the United States’ growth?
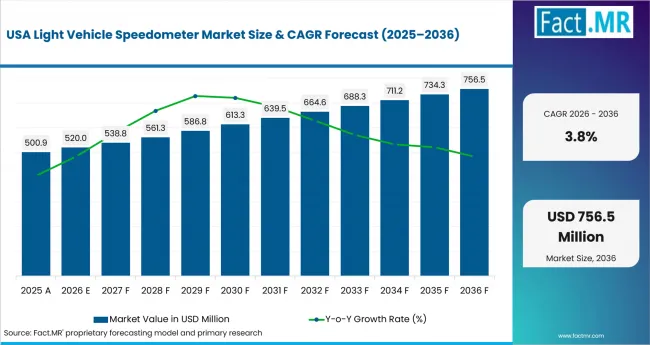
3.8% CAGR, supported by high travel volumes and speed safety enforcement.
Light Vehicle Speedometer Market Country Value Analysis | Source: Fact.MR
The Federal Highway Administration estimated that U.S. road users logged 3,323.8 billion vehicle miles in 2025, up 0.9% from 2024 [7]. NHTSA counted 11,775 speeding-related deaths in 2023, or 29% of all traffic fatalities [8]. Such exposure keeps speed display accuracy in focus for OEMs, and many new models pair the speedometer with posted speed-limit data.
How is Sweden developing demand?
3.4% CAGR, backed by plug-in car registrations and a large passenger car fleet.
Trafikanalys reported that 61% of passenger cars newly registered in Sweden in 2025 were plug-in models [9]. The country had 5,039,431 passenger cars in traffic at the end of 2025 [9]. Plug-in cars rely on screen-based clusters that combine speed with charge level, so new registrations will keep lifting digital speedometer demand across the fleet.
What is supporting Germany’s adoption?
3.0% CAGR, supported by battery electric registrations and premium cluster programs.
The Kraftfahrt-Bundesamt recorded 545,142 new battery electric passenger cars in 2025, a 19.1% share of registrations [10]. Total new car registrations reached about 2.9 million, up 1.4% on 2024 [10]. Volume segments are moving from electromechanical needles to electronic displays, although modest registration growth keeps the pace measured.
How does Japan perform?
2.6% CAGR, shaped by a mature fleet and safety-led cluster upgrades.
Japan’s National Police Agency reported 2,547 traffic deaths in 2025, down 4.4% from 2024 and a record low since records began in 1948 [11]. Safety policy keeps pressure on OEMs to present speed and warning information clearly, which supports digital cluster upgrades.
Who leads the Light Vehicle Speedometer Market?
AUMOVIO SE began trading on the Frankfurt Stock Exchange in September 2025 after its spin-off from Continental AG [12]. The company now holds the former Continental Automotive business in display systems and digital clusters. In April 2026, AUMOVIO won a production order from a European premium vehicle maker for an OLED driver display with a camera hidden beneath the screen [13].
Visteon Corporation supplies digital instrument clusters in entry, mid-range and premium series for passenger car programs. In May 2026, Visteon and Smart Eye introduced an LCD instrument cluster with a driver monitoring camera placed beneath the display [14]. Denso Corporation lists instrument clusters and head-up displays within its cockpit information systems portfolio.
Nippon Seiki Co., Ltd. builds instrument clusters and head-up displays for car and motorcycle makers. At the Automotive Engineering Exposition in Yokohama in May 2026, the company showed next-generation clusters and a slope-based projection head-up display used in the Toyota RAV4 [15]. Yazaki Corporation supplies instrument clusters and head-up displays through its driver information business.
Marelli Holdings Co., Ltd. continues to offer cluster and infotainment platforms for passenger cars under its LeanConnect and ProConnect lines, with display options from TFT to OLED. Competition centers on display quality and software scalability across trim levels. OEMs weigh driver monitoring integration, cybersecurity support and cost control when awarding new cluster programs.
Which companies are the key providers?
Key companies include AUMOVIO SE (formerly Continental Automotive); Denso Corporation; Nippon Seiki Co., Ltd.; Visteon Corporation; Yazaki Corporation; and Marelli Holdings Co., Ltd.
- AUMOVIO SE (formerly Continental Automotive)
- Denso Corporation
- Nippon Seiki Co., Ltd.
- Visteon Corporation
- Yazaki Corporation
- Marelli Holdings Co., Ltd.
Bibliography
- [1] International Energy Agency. (2026, May 20). Global EV Outlook 2026.
- [2] European Commission, Directorate-General for Mobility and Transport. (2025, October 17). Road Safety Statistics for 2024: Progress continues amid persistent challenges.
- [3] International Energy Agency. (2025, May 14). Global EV Outlook 2025.
- [4] Eurostat. (2025, May 21). Passenger cars per inhabitant stable in 2023.
- [5] Ministry of Trade, Industry and Resources. (2026, January 15). Automobile Exports Hit Record High of $72 Billion in 2025.
- [6] Czech Statistical Office. (2025, September 18). Tématem zářijového vydání Statistika&My jsou automobily [Cars are the theme of the September issue of Statistika&My].
- [7] Federal Highway Administration. (2026, January 28). Traffic Volume Trends: December 2025.
- [8] National Highway Traffic Safety Administration. (2025, June). Speeding: 2023 Data.
- [9] Trafikanalys. (2026, February 12). Fordon i län och kommuner 2025 [Vehicles in counties and municipalities 2025].
- [10] Kraftfahrt-Bundesamt. (2026, January 6). Fahrzeugzulassungen im Dezember 2025 - Jahresbilanz [Vehicle registrations in December 2025: Annual review].
- [11] National Police Agency. (2026, January 6). 令和7年中の交通事故死者数について [Traffic accident fatalities in 2025].
- [12] AUMOVIO. (2025, September 18). AUMOVIO makes successful stock market debut.
- [13] AUMOVIO. (2026, April 7). AUMOVIO secures major order for OLED display with invisibly integrated camera.
- [14] Visteon Corporation. (2026, May 26). Smart Eye and Visteon Introduce LCD Instrument Cluster with Integrated DMS.
- [15] Nippon Seiki Co., Ltd. (2026, May 20). Nippon Seiki to Exhibit at Automotive Engineering Exposition 2026 YOKOHAMA: Showcasing Latest Technologies Contributing to Safe and Comfortable Driving, Including Slope-Based Projection Head-Up Display and Circular TFT Cluster.
This Report Answers
- The report explains how light vehicle speedometer demand splits by product type, vehicle type, technology and sales channel.
- Segment analysis identifies the leading subsegments and the design choices behind their 2026 shares.
- Country analysis compares the six listed markets and the conditions shaping demand.
- Competitive analysis reviews active cluster suppliers and their display platforms.
- Channel analysis compares OEM fitment with aftermarket replacement for older vehicles.
What does the Light Vehicle Speedometer Market cover?
The Light Vehicle Speedometer Market covers instruments that show road speed to drivers of passenger cars and light commercial vehicles. It includes analog dials and digital speed readouts on cluster screens.
Coverage extends to electronic designs that read networked wheel-speed data and electromechanical designs that move a needle with a stepper motor. Demand is assessed across OEM fitment and aftermarket replacement.
What is included in the scope?
The scope includes stand-alone speedometer gauges and the speed display function of digital cluster screens. Screen technology context includes OLED display systems for EVs used for driver displays.
Adjacent context covers augmented reality head-up displays that repeat speed information on the windshield. Replacement clusters, recalibrated units and add-on gauges sold through the aftermarket fall within the boundary.
What is excluded from the scope?
The scope excludes speedometers for two-wheelers, heavy trucks, buses and off-highway machinery. Standalone center information displays are excluded when they do not carry the primary speed readout.
Wide-screen products such as pillar-to-pillar displays are counted only for the cluster portion that shows vehicle speed. Wheel-speed sensors and navigation software remain outside the revenue boundary.
How Was the Analysis Built?
The analysis draws on 120+ sources, 35+ company portfolios, 25+ countries, and more than 20 industry interviews.
- Primary Research: Primary research includes discussions with manufacturers, service providers, technology developers, distributors, end users, and subject-matter experts. These conversations examine purchasing priorities, product adoption, operational challenges, approval requirements, competitive positioning, and the factors that influence wider market acceptance.
- Desk Research: Desk research covers government statistics, regulatory publications, company filings, trade data, technical studies, industry associations, standards, public policy, and other authoritative sources. Every source used in the analysis is documented in the bibliography.
- Market Sizing and Forecasting: Market estimates combine historical performance, demand indicators, pricing and volume trends, segment shares, company participation, country-level growth, adoption patterns, investment activity, and barriers to market expansion.
- Data Validation and Update Cycle: Findings are validated by comparing primary interviews with public data, company activity, regulatory changes, trade patterns, and industry developments. Regular updates review new product launches, capacity changes, partnerships, approvals, and shifts in commercial adoption.
What is the report’s scope and coverage?
Light Vehicle Speedometer Market Breakdown By Product Type, Vehicle Type, And Region | Source: Fact.MR
| Attribute | Details |
|---|---|
| Quantitative Units | USD billion |
| Market Definition | Speed-indicating instruments fitted in passenger cars and light commercial vehicles, covering analog dials and digital speed readouts sold through OEM and aftermarket channels. |
| Product Type | Digital Speedometers; Analog Speedometers |
| Vehicle Type | Passenger Cars; Light Commercial Vehicles |
| Technology | Electronic; Electromechanical |
| Sales Channel | OEM; Aftermarket |
| Regions Covered | North America; Latin America; Western Europe; Eastern Europe; East Asia; South Asia & Pacific; Middle East & Africa |
| Countries Covered | South Korea; Czech Republic; United States; Sweden; Germany; Japan |
| Key Companies Profiled | AUMOVIO SE; Denso Corporation; Nippon Seiki Co., Ltd.; Visteon Corporation; Yazaki Corporation; Marelli Holdings Co., Ltd. |
| Forecast Period | 2026 to 2036 |
| Approach | Hybrid top-down and bottom-up approach using light vehicle production; cluster fitment by product type and technology; OEM and aftermarket channel mix; country growth; and supplier portfolio review. |
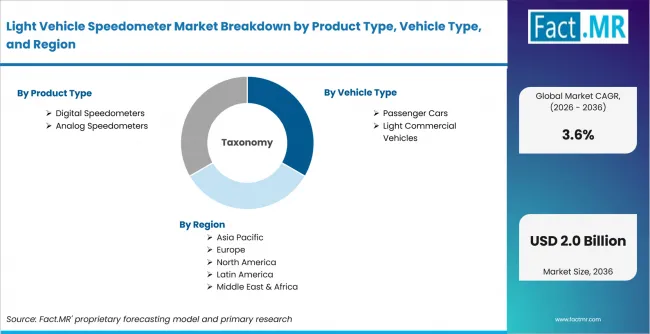
How is the market segmented?
-
By Product Type:
- Digital Speedometers
- Analog Speedometers
-
By Vehicle Type:
- Passenger Cars
- Light Commercial Vehicles
-
By Technology:
- Electronic
- Electromechanical
- By Sales Channel
- OEM
- Aftermarket
-
By Region:
- North America
- Latin America
- Western Europe
- Eastern Europe
- East Asia
- South Asia & Pacific
- Middle East & Africa