- Market Value (2025): USD 558.1 Mn
- Estimated Value (2026): USD 620 Mn
- Forecast Value (2036): USD 1776 Mn
- CAGR (2026-2036): 11.1%
What is the Marine DC Power Distribution Systems Market forecast to be worth by 2036?
USD 620 million in 2026 to USD 1776 million by 2036, at 11.1% CAGR.
- The marine DC power distribution systems market was valued at USD 558.1 million in 2025.
- Demand is projected to increase from USD 620 million in 2026 to USD 1776 million by 2036.
- The market is forecast to record 11.1% CAGR from 2026 to 2036 owing to ferry electrification and battery-linked newbuild design.
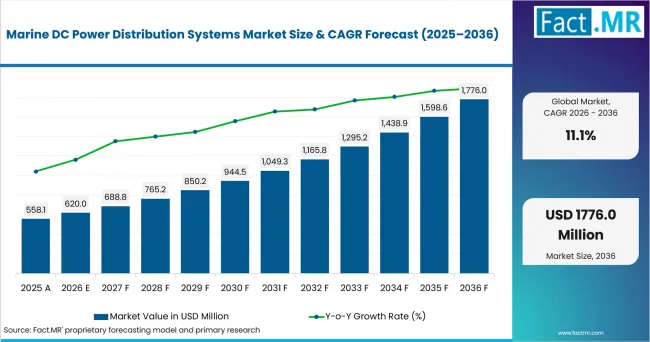
Marine Dc Power Distribution Systems Market Value Analysis | Source: Fact.MR
What are the defining numbers behind Marine DC Power Distribution Systems Market growth?
USD 1.16 billion absolute opportunity by 2036, led by DC switchboards, 1-5 MW systems and newbuild installations.
- Demand Drivers in the Market
- Shipyards need DC switchboards that combine propulsion loads and hotel loads without adding extra conversion stages.
- Ferry operators need simpler battery integration because fixed routes place repeat stress on onboard energy systems.
- The International Maritime Organization approved the IMO Net-Zero Framework in April 2025 for large ocean-going ships over 5,000 gross tonnage, which account for 85% of total CO2 emissions from international shipping.
- EMSA and the European Environment Agency reported in February 2025 that EU maritime transport emitted 137.5 million tonnes of CO2 in 2022.
- Key Segments Analyzed
- By Component: DC switchboards are expected to hold 34.0% share in 2026 because vessel electrical rooms need a central DC control point.
- By Vessel Type: Ferries & RoRo are projected to account for 29.0% share in 2026 due to fixed routes and shore charging use.
- By Power Rating: 1-5 MW is anticipated to capture 45.0% share in 2026 supported by medium ferry and workboat power needs.
- By Installation: Newbuild is estimated to represent 63.0% share in 2026 owing to easier integration during vessel design.
- Analyst Opinion at Fact.MR
- Shambhu Nath Jha, Principal Consultant at Fact.MR, states, "Marine DC distribution is drawing attention because electric vessels need switchboards and batteries to work as one system. Yard acceptance is expected to depend on fault-protection proof. Suppliers should combine switchboard design with charger and shore-connection interfaces."
- Strategic Implications
- Shipyards should lock DC architecture decisions before propulsion and battery packages move into procurement.
- Ferry operators should compare lifecycle service needs across switchboards, converters and battery interfaces.
- Component providers should document protection behavior in a form that class societies and vessel owners can review quickly.
- Investors should separate vessel-grade DC power distribution exposure from land-based power-electronics revenue.
South Korea is expected to record 13.3% CAGR through shipyard scale. Norway is projected at 12.1% CAGR due to ferry electrification. The Netherlands is anticipated at 11.8% CAGR. Italy is estimated at 11.5% CAGR, Germany at 11.2% CAGR and Japan at 11.0% CAGR.
How does the Marine DC Power Distribution Systems Market break down by segment?
DC switchboards lead Component at 34.0%; 1-5 MW leads Power Rating at 45.0%.
Which component dominates?
DC switchboards are projected to account for 34.0% share in 2026.
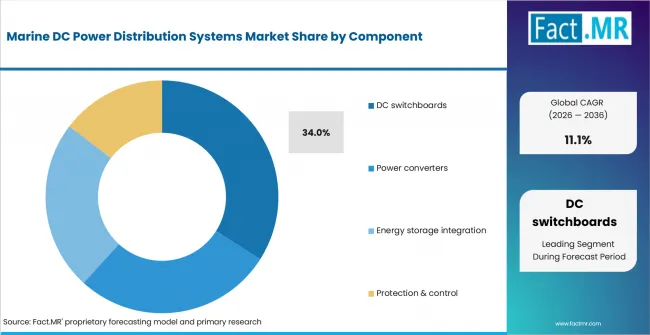
Marine Dc Power Distribution Systems Market Analysis By Component | Source: Fact.MR
DC switchboards are projected to lead Component with 34.0% share in 2026 because they route battery and propulsion loads across marine electrical systems. Kongsberg Maritime said in May 2026 that its technology scope for Svitzer’s full-electric tugs includes DC and AC switchboards as part of the vessels’ integrated electrical, propulsion, and automation architecture.
What leads the Vessel Type segment?
Ferries & RoRo are expected to hold 29.0% share in 2026.
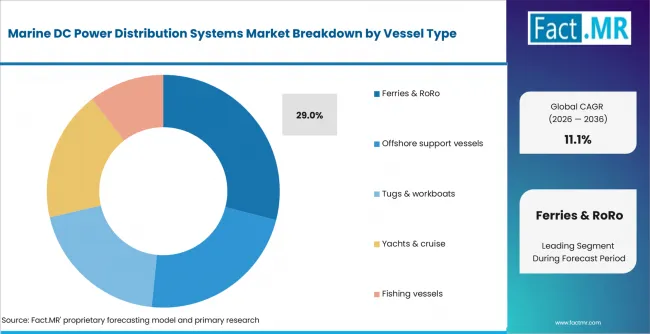
Marine Dc Power Distribution Systems Market Analysis By Vessel Type | Source: Fact.MR
Ferries & RoRo are expected to lead Vessel Type with 29.0% share in 2026 because fixed routes support predictable charging and operating profiles. Wärtsilä announced in May 2025 that it would supply full electric propulsion systems, including DC Hubs, for three battery-electric San Francisco Bay ferries, demonstrating the application of DC-based electrical distribution in scheduled ferry operations.
How does Power Rating shape demand?
1-5 MW is anticipated to lead with 45.0% share in 2026.
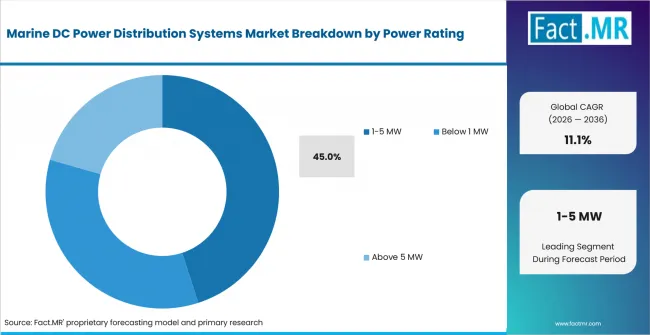
Marine Dc Power Distribution Systems Market Analysis By Power Rating | Source: Fact.MR
The 1-5 MW class is anticipated to lead Power Rating with 45.0% share in 2026 because many ferries and workboats require medium-power propulsion architectures. ABB states that its Onboard DC Grid™ is suitable for passenger vessels and other marine segments, providing flexible DC power distribution and integration of multiple energy sources and loads.
What supports Newbuild within Installation?
Newbuild is estimated to represent 63.0% share in 2026.
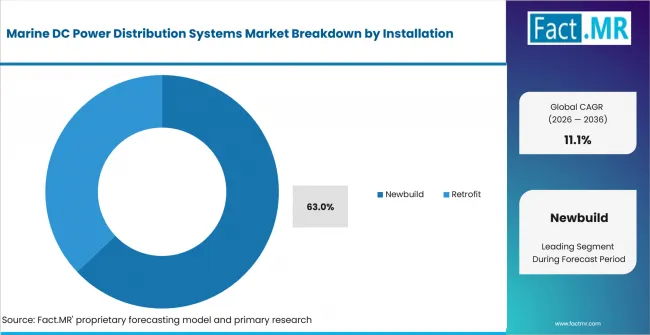
Marine Dc Power Distribution Systems Market Analysis By Installation | Source: Fact.MR
Newbuild is estimated to lead Installation with 63.0% share in 2026 because DC buses, converters and battery interfaces are easier to integrate during vessel design. ABB announced in October 2025 that it would supply onboard power distribution and propulsion systems for seven new all-electric CMAL ferries, alongside shore connection technology for multiple ferry terminals, demonstrating an integrated approach to vessel and shoreside electrification.
What is accelerating Marine DC Power Distribution Systems Market adoption, and what is holding it back?
Ferry electrification drives it; protection complexity restrains it.
Drivers Impact Analysis
| Driver | (~) % Impact on CAGR | Geographic Relevance | Impact Timeline |
|---|---|---|---|
| Ferry electrification | +2.8% | Norway, South Korea, Netherlands | Short term (<= 2 years) |
| Battery and shore-power integration | +2.4% | Europe and East Asia | Short term (<= 2 years) |
| Offshore service-vessel hybridization | +1.9% | Norway, Germany, Netherlands | Medium term (2-4 years) |
| Compact DC switchboard design | +1.5% | Shipbuilding clusters | Medium term (2-4 years) |
| Class-ready protection logic | +1.1% | Global newbuild yards | Long term (>= 4 years) |
- Ferry electrification: Fixed routes are expected to favor DC distribution because charging stops are known. Norway adopted zero-emission requirements for tourist ships and ferries in the World Heritage fjords in April 2025, providing operators with a clear regulatory compliance requirement from 2026 for passenger vessels under 10,000 gross tonnage.
- Battery and shore-power integration: Vessel owners need safe links between batteries and chargers. Marine power battery systems are expected to raise switchboard value where monitored energy flow is required.
- Offshore service-vessel hybridization: Offshore vessels face variable loads. German offshore wind capacity reached around 10.8 GW by June 30, 2026, providing a growing operating base for DC- and hybrid-electric power architectures.
- Compact DC switchboard design: Smaller ferries and tugs have limited electrical rooms. Marine switchboards are expected to gain when builders need protected distribution inside compact layouts.
Opportunity Impact Analysis
| Opportunity | (~) % Impact on CAGR | Geographic Relevance | Impact Timeline |
|---|---|---|---|
| Modular DC switchboards | +1.3% | Shipyards and ferry routes | Short term (<= 2 years) |
| Retrofit battery packages | +1.1% | Harbor craft and workboats | Medium term (2-4 years) |
| Offshore wind service craft | +0.9% | North Sea and East Asia | Medium term (2-4 years) |
| Medium-voltage DC testing | +0.7% | Larger vessel programs | Long term (>= 4 years) |
- Modular DC switchboards: Repeat ferry classes are expected to benefit from modular panels. Shipyards can reuse drawings and protection studies across sister vessels.
- Retrofit battery packages: Retrofit demand is projected to rise where owners add batteries before vessel renewal. Harbor craft chargers shape the case because route charging affects payback.
- Offshore wind service craft: North Sea wind farms are expected to increase service-vessel demand. RVO states that the Netherlands will need 30-40 GW of offshore wind capacity by 2040.
- Medium-voltage DC testing: Larger vessels require stronger proof before operators accept higher-power DC architecture. Tests are expected to focus on fault behavior and converter coordination.
Restraints Impact Analysis
| Restraint | (~) % Impact on CAGR | Geographic Relevance | Impact Timeline |
|---|---|---|---|
| Protection and fault-isolation complexity | -1.3% | Global | Short term (<= 2 years) |
| Port charging limits | -1.0% | Ferry and harbor routes | Short term (<= 2 years) |
| Skilled electrical integration capacity | -0.8% | Shipbuilding clusters | Medium term (2-4 years) |
| Battery and converter cost exposure | -0.6% | Retrofit programs | Medium term (2-4 years) |
- Protection and fault-isolation complexity: DC faults need fast isolation. Class review is expected to lengthen when protection zones are not documented early.
- Port charging limits: Shore charging must match vessel schedules and grid capacity. The Dutch government said in March 2025 that more than 100 grid-congestion measures were under way.
- Skilled electrical integration capacity: DC work requires marine electrical engineers. OECD reported in 2026 that Korean shipbuilding employment declined by about 44.0% from 2014 to 2024.
- Battery and converter cost exposure: Batteries and converters remain material cost items. Retrofit owners are expected to compare DC packages against conventional switchboard replacement.
Which countries are scaling Marine DC Power Distribution Systems Market fastest?
- The country comparison spans 2.30 percentage points across the forecast period.
- South Korea remains 1.22 points above Norway through shipyard scale.
- Norway remains 0.22 point above the Netherlands through ferry electrification.
- The Netherlands remains 0.33 point above Italy through ports and offshore wind.
- Italy remains 0.31 point above Germany through ferry and RoRo electrical work.
- Germany remains 0.22 point above Japan through offshore service craft.
- Japan closes the range through shipbuilding capability and vessel energy redesign.
Marine DC Power Distribution Systems Market is segmented into North America, Latin America, Europe, East Asia, South Asia and Pacific, Middle East and Africa.
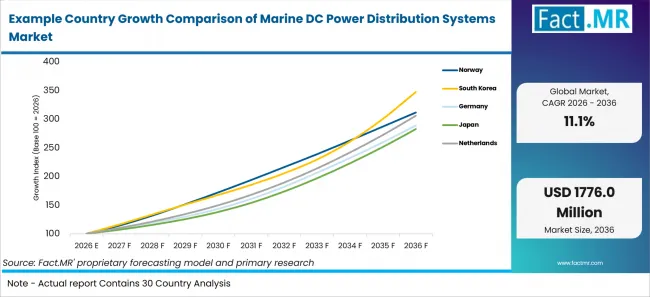
Example Country Growth Comparison Of Marine Dc Power Distribution Systems Market | Source: Fact.MR
| Country | CAGR |
|---|---|
| South Korea | 13.3% |
| Norway | 12.1% |
| Netherlands | 11.8% |
| Italy | 11.5% |
| Germany | 11.2% |
| Japan | 11.0% |
How is South Korea scaling demand?
13.3% CAGR, driven by shipyard scale and future-vessel programs.
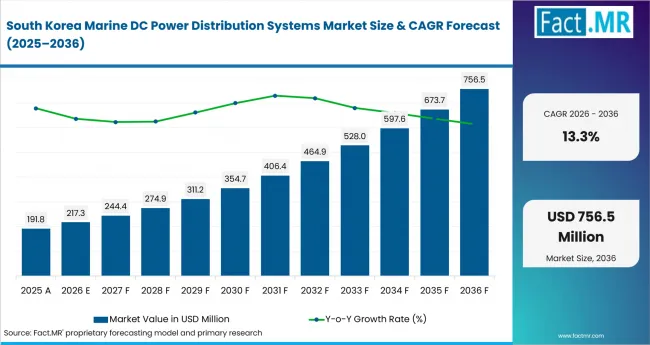
Marine Dc Power Distribution Systems Market Country Value Analysis | Source: Fact.MR
South Korea’s growth is supported by large shipyards and expanding vessel programs. MOTIR reported that Korean ship exports rose 16.7% year over year to USD 2.6 billion in May 2026, while an April 2026 launch event for the shipbuilding–shipping strategic council brought together more than 100 participants. Labor shortages, commissioning requirements and owner approval cycles may slow project execution.
What supports Norway adoption?
12.1% CAGR, supported by zero-emission ferry rules and offshore vessel work.
Norway’s growth reflects zero-emission ferry requirements and strong offshore-vessel activity. The Norwegian Maritime Authority stated that new zero-emission requirements for World Heritage fjords apply from January 1, 2026 to passenger ships under 10,000 gross tonnage, while Statistics Norway reported total electricity production of 161.8 TWh in 2025. Harsh-weather requirements and phased charger investment may constrain smaller operators.
How is the Netherlands developing demand?
11.8% CAGR, driven by port activity and offshore wind infrastructure planning.
Netherlands growth is supported by major seaport activity and offshore wind development. Statistics Netherlands reported 577 million tonnes of cargo handled by Dutch seaports in 2024, while RVO indicates 30-40 GW of offshore wind capacity will be needed by 2040. Grid congestion and proof requirements may delay DC conversion projects.
What supports Italy growth?
11.5% CAGR, backed by ferry, RoRo and cruise-vessel electrical work.
Italy’s growth is supported by extensive short-sea shipping and passenger-vessel electrical activity. The European Commission reported Italy accounted for 304 million tonnes of EU short sea shipping in 2024, while Terna recorded 311.3 TWh of electricity demand in 2025. Protection reviews and retrofit economics may constrain smaller ferry projects.
How does Germany perform?
11.2% CAGR, led by offshore wind service craft and marine electrical engineering.
Germany’s growth reflects offshore wind development and established marine engineering capabilities. The German Offshore-Windenergy Foundation reported 1,764 turbines and 10.8 GW operating by June 30, 2026, while renewables represented 58.8% of electricity generation in 2025. Tender timing and documentation requirements may slow DC-system changes.
What supports Japan demand?
11.0% CAGR, shaped by shipbuilding capability and vessel energy-system redesign.
Japan’s growth is supported by domestic marine-equipment capability and battery-linked vessel design. OECD reported 92% domestic self-sufficiency in marine equipment in 2022, while METI recorded 0.9911 PWh of electricity generation in FY2024. Export certification requirements and slower fleet renewal may limit retrofit demand.
Who leads the Marine DC Power Distribution Systems Market?
ABB, Wärtsilä, Siemens Energy, Kongsberg Maritime, The Switch and Danfoss as relevant companies in marine DC power distribution and vessel-electrification systems.
ABB supports marine DC distribution through Compact Onboard DC Grid. Wärtsilä adds electric propulsion systems for battery-electric ferries. Wärtsilä announced in May 2025 that its San Francisco Bay Ferry electric-propulsion package includes batteries and a DC Hub, while Kongsberg Maritime’s 2026 Svitzer electric-tug package includes DC and AC switchboards.
Which companies are the key providers?
Key companies include ABB, Wärtsilä, Siemens Energy, Kongsberg Maritime, The Switch and Danfoss.
- ABB
- Wärtsilä Corporation
- Siemens Energy
- Kongsberg Maritime
- The Switch
- Danfoss
Bibliography
- ABB. (2025, October 28). Caledonian Maritime Assets relies on ABB to power multiple all-electric ferries on board and ashore.
- Bundesnetzagentur. (2026, January 5). Bundesnetzagentur publishes 2025 electricity market data.
- Bundesverband WindEnergie e.V., Bundesverband Windenergie Offshore e.V., VDMA Power Systems, WAB e.V., WindEnergy Network e.V., & Stiftung OFFSHORE-WINDENERGIE. (2026, January 27). Ausbau der Offshore-Windenergie 2025: Offshore-Wind-Branche sieht dringenden politischen Handlungsbedarf.
- European Commission, Joint Research Centre. (2026, May 21). Maritime transport. EU Blue Economy Observatory.
- European Maritime Safety Agency, & European Environment Agency. (2025, February 4). EU maritime transport: Progress made, but environmental, sustainability challenges persist.
- International Maritime Organization. (2025, April 11). IMO approves net-zero regulations for global shipping.
- Kongsberg Maritime. (2026, May 5). Integrated technology package for Svitzer’s next generation full-electric tug series.
- Ministry of Trade, Industry and Resources. (2026, June 1). May 2026 exports reach monthly record of $87.8 billion.
- Ministry of Trade, Industry and Resources. (2026, April 28). Korea launches shipbuilding–shipping alliance under next-generation W.A.V.E. strategy.
- Norwegian Maritime Authority. (2025, April 14). Adoption of zero-emission requirements for cruise ships, tourist boats and ferries in the World Heritage fjords.
- Norwegian Offshore Directorate. (2026, January 20). Production figures December 2025.
- OECD. (2026, April 8). Peer review of the Japanese shipbuilding industry 2026. OECD Publishing.
- Government of the Netherlands. (2025, March 24). Kabinet en netbeheerders werken aan ruim 100 maatregelen tegen vol stroomnet.
- Statistics Netherlands. (2025, August 8). Fewer goods handled at Dutch seaports, particularly coal and natural gas.
- Wärtsilä Corporation. (2025, May 28). Wärtsilä to supply the electric propulsion system for USA’s first battery-electric, zero-emission high-speed passenger ferries.
This Report Answers
- The report provides strategic intelligence on the Marine DC Power Distribution Systems Market across Component and Vessel Type choices that shape electric ship systems.
- Segment analysis covers DC switchboards and 1-5 MW systems, with adjacent context from DC distribution networks when vessel-grade hardware is separated from land grids.
- Country outlook evaluates South Korea and Norway alongside the Netherlands. Italy, Germany and Japan complete the growth comparison.
- Competitive analysis profiles ABB and Wärtsilä alongside Siemens Energy and Kongsberg Maritime. The Switch and Danfoss complete the provider set.
- Technology assessment covers power converters and energy storage integration.
What does the Marine DC Power Distribution Systems Market cover?
DC switchboards, power converters, energy storage interfaces and protection controls used for marine power routing.
The market covers vessel systems that distribute DC power across propulsion and auxiliary loads. It includes marine switchboards designed for onboard DC control.
Coverage differs from general power hardware because marine systems must pass class review. It includes marine gensets only when output ties into vessel DC distribution.
What is included in the scope?
Marine DC power systems used on newbuild and retrofit vessels.
Included hardware covers DC switchboards, converters and protection used on ferries and RoRo ships. It includes electric boats when DC buses coordinate batteries with propulsion. Floating dock chargers are included only when they affect vessel-side design.
What is excluded from the scope?
General land-based DC systems and unrelated shipboard AC equipment are outside the scope.
The scope excludes land-based DC grids and conventional AC switchboards unless they are part of a vessel DC package. Standalone chargers are excluded unless they change vessel-side DC design.
How Was the Analysis Built?
The analysis draws on 120+ sources, 35+ company portfolios, 25+ countries, and more than 20 industry interviews.
- Primary Research: Primary research includes discussions with manufacturers, service providers, technology developers, distributors, end users, procurement teams, and subject-matter experts. These conversations examine purchasing priorities, product adoption, operational challenges, approval requirements, competitive positioning, and the factors that influence wider market acceptance.
- Desk Research: Desk research covers government statistics, regulatory publications, company filings, trade data, technical studies, industry associations, standards, public policy, and other authoritative sources. Every source used in the analysis is documented in the bibliography.
- Market Sizing and Forecasting: Market estimates combine historical performance, demand indicators, pricing and volume trends, segment shares, company participation, country-level growth, adoption patterns, investment activity, and barriers to market expansion.
- Data Validation and Update Cycle: Findings are validated by comparing primary interviews with public data, company activity, regulatory changes, trade patterns, and industry developments. Regular updates review new product launches, capacity changes, partnerships, approvals, procurement trends, and shifts in commercial adoption.
What is the report’s scope and coverage?
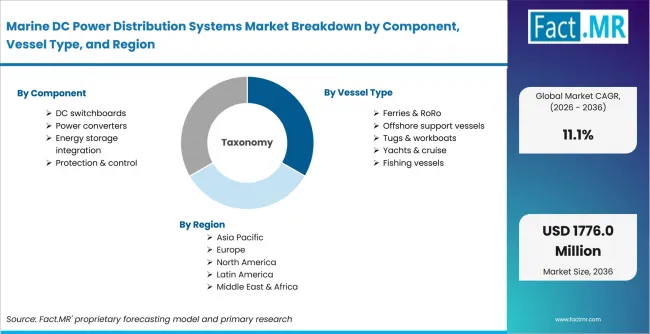
Marine Dc Power Distribution Systems Market Breakdown By Component, Vessel Type, And Region | Source: Fact.MR
| Attribute | Details |
|---|---|
| Quantitative Units | USD million |
| Market Definition | Direct-current power distribution systems used on marine vessels where switchboards, converters, energy storage interfaces and protection controls route onboard electrical power. |
| Component | DC switchboards; Power converters; Energy storage integration; Protection & control |
| Vessel Type | Ferries & RoRo; Offshore support vessels; Tugs & workboats; Yachts & cruise; Fishing vessels |
| Power Rating | Below 1 MW; 1-5 MW; Above 5 MW |
| Installation | Newbuild; Retrofit |
| Regions Covered | North America; Latin America; Europe; East Asia; South Asia and Pacific; Middle East and Africa |
| Countries Covered | South Korea; Norway; Netherlands; Italy; Germany; Japan |
| Key Companies Profiled | ABB; Wärtsilä Corporation; Siemens Energy; Kongsberg Maritime; The Switch; Danfoss |
| Forecast Period | 2026 to 2036 |
| Approach | Hybrid top-down and bottom-up approach using marine electrification, switchboard demand, vessel classes, charging readiness, country CAGRs and company portfolio review |
How is the market segmented?
-
By Component:
- DC switchboards
- Power converters
- Energy storage integration
- Protection & control
-
By Vessel Type:
- Ferries & RoRo
- Offshore support vessels
- Tugs & workboats
- Yachts & cruise
- Fishing vessels
-
By Power Rating:
- Below 1 MW
- 1-5 MW
- Above 5 MW
-
By Installation:
- Newbuild
- Retrofit
-
By Region:
- North America
- Latin America
- Europe
- East Asia
- South Asia and Oceania
- Middle East and Africa