- Market Value (2025): USD 7.9 Bn
- Estimated Value (2026): USD 8.9 Bn
- Forecast Value (2036): USD 27.8 Bn
- CAGR (2026-2036): 12.1%
What is the Medical Device and Medtech Enterprise Resource Planning Market forecast to be worth by 2036?
USD 8.9 billion in 2026 and USD 27.8 billion by 2036 at a 12.1% CAGR.
- The Medical Device and Medtech Enterprise Resource Planning Market reached USD 7.9 billion in 2025.
- Demand is projected to increase from USD 8.9 billion in 2026 to USD 27.8 billion by 2036.
- The market is valued at USD 8.9 billion in 2026 as manufacturers connect production and enterprise records across regulated operations.
- Demand is projected to reach USD 27.8 billion by 2036.
- The market is forecast to record a 12.1% CAGR from 2026 to 2036, with purchasing concentrated in cloud deployment, manufacturing management and large-enterprise programs.
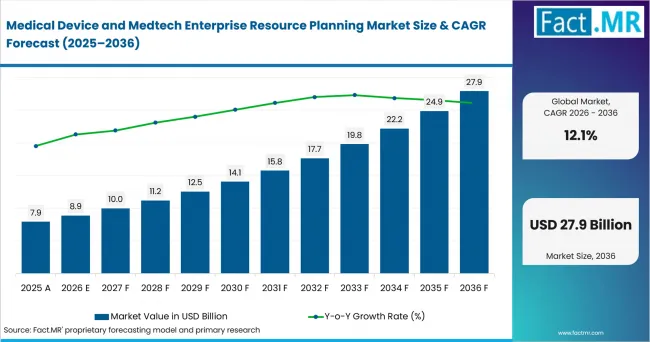
Medical Device And Medtech Enterprise Resource Planning Market Value Analysis | Source: Fact.MR
Why does Software lead Component?
USD 18.9 billion absolute opportunity by 2036. Software leads Component with 69.0% share in 2026. Cloud-Based leads Deployment with 74.0%. Manufacturing & Production Management leads Application with 31.0%. Large Enterprises lead Enterprise Size with 65.0%. Medical Device Manufacturers lead End User with 48.0%.
- Demand Drivers in the Market
- Regulatory and quality-system convergence: FDA QMSR, ISO 13485-based controls, EUDAMED registration and national device requirements increase the value of governed product, supplier and quality data.
- Multi-site manufacturing control: Global manufacturers need common bills of material, routings, production orders, procurement rules and financial records across plants and contract partners.
- Traceability across the product lifecycle: Lot, serial, UDI, supplier, complaint and service records must connect without forcing teams to reconcile separate spreadsheets during audits or recalls.
- Cloud operating models: Cloud ERP reduces infrastructure work and supports phased deployment, while validation, access control and interface governance remain decisive buying tests.
- Key Segments Analyzed
- By Component: Software is projected to hold 69.0% share in 2026 because the platform and compliance modules carry the core process logic, data model and recurring license value.
- By Deployment: Cloud-Based is anticipated to account for 74.0% share in 2026 as organizations standardize multiple sites without maintaining separate local infrastructure at each facility.
- By Application: Manufacturing & Production Management is forecast to hold 31.0% share in 2026 because production planning and execution sit closest to regulated device output, cost and traceability.
- By Enterprise Size: Large Enterprises are expected to represent 65.0% share in 2026 because global manufacturers carry the widest site, product and regulatory complexity.
- By End User: Medical Device Manufacturers are projected to account for 48.0% share in 2026 as diagnostic and surgical device producers require integrated manufacturing, quality and supply-chain records.
- Analyst Opinion at Fact.MR
- Shambhu Nath Jha, Principal Consultant at Fact.MR, states, “The buying decision is no longer about replacing finance software alone. Medical device manufacturers need one governed data spine for bills of material, production orders, supplier quality, lot and serial history, UDI records and regulatory evidence. Cloud adoption can reduce infrastructure work, but vendors still have to prove validation, access control and integration discipline. The strongest implementations will be phased around manufacturing and quality processes that auditors and plant teams use every day.” Fact.MR opines that ERP providers will be assessed on validated workflows, traceability, and deployment control.
- Fact.MR opines that phased manufacturing and quality deployments will outperform broad, finance-first programs in this market.
- Strategic Implications
- Manufacturers should establish clean item, supplier, routing and quality master data before moving complex plants into a common ERP instance.
- Implementation teams should apply risk-based computer software assurance to production and quality functions instead of testing every configuration with equal intensity.
- Buyers should map interfaces with QMS, MES, PLM, CRM, warehouse systems and contract manufacturers before selecting a cloud, hybrid or on-premise architecture.
- ERP providers should package medtech-specific workflows for UDI, lot and serial traceability, supplier qualification, nonconformance, change control and device history records.
South Korea is expected to record a 13.17% CAGR from 2026 to 2036. The USA follows at 12.58%, with Canada at 12.19%. The UK is forecast at 11.93%, Australia at 11.87%, Germany at 11.71% and Japan at 11.36% through 2036.
How does the Medical Device and Medtech Enterprise Resource Planning Market break down by segment?
Software leads Component, Cloud-Based leads Deployment and Manufacturing & Production Management leads Application. Large Enterprises and Medical Device Manufacturers lead their respective parent segments in 2026.
Why does Cloud-Based lead Deployment?
Software is projected to account for 69.0% share in 2026.
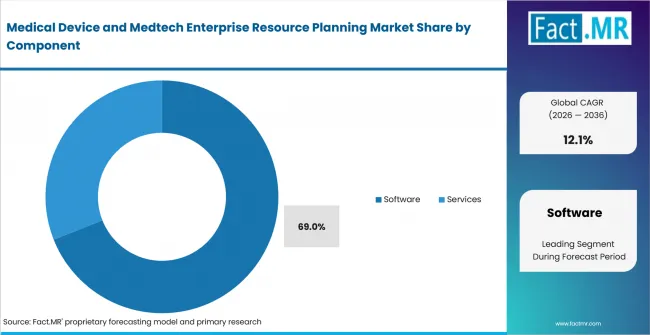
Medical Device And Medtech Enterprise Resource Planning Market Analysis By Component | Source: Fact.MR
Software carries the process model that links finance, procurement, inventory, production, quality and reporting. ERP Platforms provide the transactional core, while Regulatory Compliance Modules add controlled workflows, electronic records and audit support. Services remain essential for configuration, integration and user adoption, but the platform retains the recurring license and subscription value after implementation.
Why does Manufacturing & Production Management lead Application?
Cloud-Based deployment is anticipated to hold 74.0% share in 2026.
Cloud deployment gives corporate teams a common release path across factories, distribution sites and acquired businesses. Public Cloud supports standardized processes and regular updates. Hybrid Cloud gives manufacturers more control over plant interfaces, sensitive workloads and regional requirements. On-Premise deployment remains relevant where local production systems, validated customizations or data policies make a full cloud move impractical.
Why do Large Enterprises lead Enterprise Size?
Manufacturing & Production Management is forecast to represent 31.0% share in 2026.
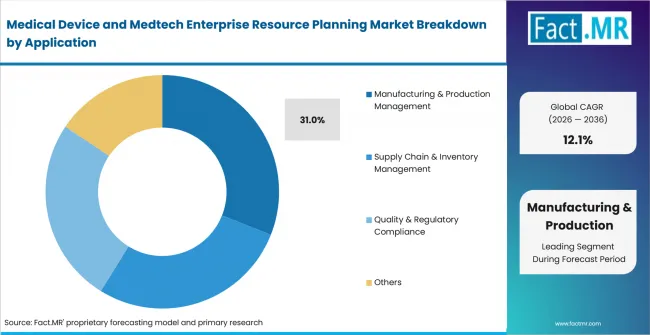
Medical Device And Medtech Enterprise Resource Planning Market Analysis By Application | Source: Fact.MR
Production Planning and Manufacturing Execution determine whether materials, labor, tooling and approved instructions are available for each device build. These functions also connect output, scrap, rework and cost to lot or serial history. Supply chain and inventory modules become more valuable when they share the same item and supplier records. Quality, financial, CRM and product lifecycle functions support the wider operating model, but production remains the point where regulated design becomes commercial product.
Why do Medical Device Manufacturers lead End User?
Large Enterprises are expected to account for 65.0% share in 2026.
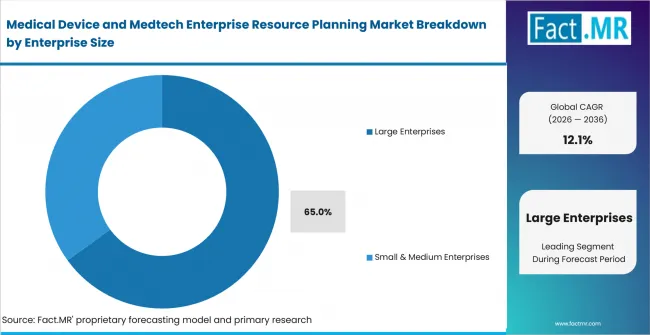
Medical Device And Medtech Enterprise Resource Planning Market Analysis By Enterprise Size | Source: Fact.MR
Global Medical Device Manufacturers and Multinational MedTech Companies operate across multiple plants, legal entities, product classes and regulatory markets. They need consolidated financial control without losing plant-level traceability. Acquisitions add another reason to standardize item masters, supplier records and reporting. Small & Medium Enterprises often prefer shorter projects, preconfigured industry templates and lower integration overhead, especially when they are regional manufacturers or medtech startups.
Why do Medical Device Manufacturers lead End User?
Medical Device Manufacturers are projected to hold 48.0% share in 2026.
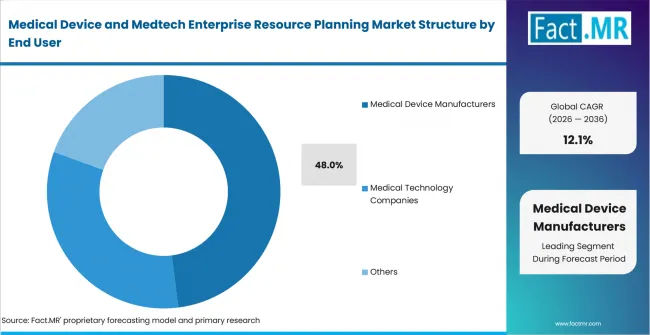
Medical Device And Medtech Enterprise Resource Planning Market Analysis By End User | Source: Fact.MR
Diagnostic Device Manufacturers and Surgical Device Manufacturers depend on controlled production records, supplier quality, lot and serial tracking and change management. Medical Technology Companies also need enterprise coordination, particularly when software, service and hardware revenue are combined. Implant Manufacturers carry long traceability horizons. CMOs, healthcare equipment suppliers and biotechnology companies use ERP for related operational needs, but direct device manufacturers face the broadest combination of production and regulatory requirements.
What is accelerating Medical Device and Medtech Enterprise Resource Planning Market adoption, and what is holding it back?
Regulatory data convergence, product traceability and multi-site manufacturing are expected to support demand. Validated cloud deployment and integrated quality workflows create the clearest opportunities. Validation workload, legacy interfaces and master-data inconsistency remain the main barriers to timely implementation.
Drivers Impact Analysis
| DRIVER | QUALITATIVE RELEVANCE | GEOGRAPHIC RELEVANCE | IMPACT TIMELINE |
|---|---|---|---|
| Regulatory and quality-system data convergence | High | USA, Germany, UK and Japan | Current forecast period |
| Lot, serial and supplier traceability | High | USA, Canada, Australia and South Korea | Current forecast period |
| Multi-site production and contract manufacturing control | Medium | Global manufacturers and CMOs | Current forecast period |
Source: Fact.MR analysis. Updated Aug 5, 2026
- Regulatory and quality-system data convergence: The ERP buying case strengthens when the same controlled records support production, supplier management, internal review and regulator-facing evidence. FDA QMSR and EUDAMED make fragmented ownership harder to defend.
- Lot, serial and supplier traceability: Manufacturers need to identify which supplier lot, work order, inspection result and shipment relate to a specific device. An integrated transaction trail reduces the time needed to investigate nonconformance or field action.
- Multi-site production and contract manufacturing control: A common ERP model helps corporate teams compare capacity, inventory, purchase commitments and cost across owned plants and outsourced production without removing local execution detail.
Opportunity Impact Analysis
| OPPORTUNITY | QUALITATIVE RELEVANCE | GEOGRAPHIC RELEVANCE | IMPACT TIMELINE |
|---|---|---|---|
| Validated cloud ERP rollout | High | USA, Canada, UK and Australia | Current forecast period |
| ERP-QMS-MES-PLM integration | High | Germany, Japan and South Korea | Current forecast period |
| Mid-market medtech implementation templates | Medium | Regional manufacturers and startups | Current forecast period |
Source: Fact.MR analysis. Updated Aug 5, 2026
- Validated cloud ERP rollout: Providers can reduce implementation friction by pairing standard cloud processes with documented configuration control, security roles, testing evidence and release management for regulated functions.
- ERP-QMS-MES-PLM integration: Manufacturers want design changes, production instructions, inspection results and financial consequences to move through connected systems with clear ownership. Prebuilt interfaces can shorten project risk.
- Mid-market medtech implementation templates: Regional manufacturers and startups need traceability and compliance without the cost and duration of a global transformation. Industry templates can make scope, validation and training easier to manage.
Restraints Impact Analysis
| RESTRAINT | QUALITATIVE RELEVANCE | GEOGRAPHIC RELEVANCE | IMPACT TIMELINE |
|---|---|---|---|
| Validation and data-migration workload | High | Regulated manufacturing sites | Current forecast period |
| Legacy interfaces and master-data inconsistency | High | Large enterprises | Current forecast period |
| Cybersecurity, access and data-residency requirements | Medium | Cloud and hybrid deployments | Current forecast period |
Source: Fact.MR analysis. Updated Aug 5, 2026
- Validation and data-migration workload: A technically successful migration can still fail an operational review if item, supplier, batch or quality history loses context. Regulated sites need evidence that the configured system works for its intended use.
- Legacy interfaces and master-data inconsistency: Plants often use different part numbers, units, routings and quality codes. Consolidation can expose years of local workarounds before any process benefit reaches users.
- Cybersecurity, access and data-residency requirements: Cloud and hybrid buyers must define privileged access, segregation of duties, backup, incident response and regional data handling before moving production-critical workloads.
Which countries are scaling Medical Device and Medtech Enterprise Resource Planning Market fastest?
- South Korea leads the listed country outlook as manufacturers align GMP, digital-device and export documentation with production and enterprise records.
- The USA follows as QMSR and FDA computer software assurance sharpen expectations for production and quality-system software.
- Canada advances through MDSAP participation and medical-device licensing requirements that depend on consistent quality evidence.
- The UK requires separate data handling for Great Britain and Northern Ireland market routes, making product and registration governance a practical ERP issue.
- Australia links manufacturer evidence and quality-system documentation to ARTG inclusion, supporting demand for controlled records.
- Germany is managing the EUDAMED transition across actor, UDI/device and certificate data, increasing the need for dependable product masters.
- Japan remains shaped by PMDA document-based and on-site QMS inspections across domestic and overseas manufacturing sites.
Comparable CAGRs can create different implementation conditions. Regulatory architecture determines which records must be controlled, while plant complexity determines how ERP connects with QMS, MES, PLM, warehouse and service systems. The full report provides regional coverage across North America, Latin America, Europe, East Asia, South Asia and Pacific, and the Middle East and Africa.
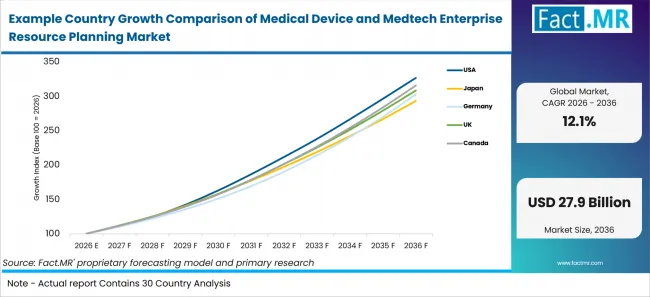
Example Country Growth Comparison Of Medical Device And Medtech Enterprise Resource Planning Market | Source: Fact.MR
| Country | CAGR (2026-2036) |
|---|---|
| South Korea | 13.17% |
| USA | 12.58% |
| Canada | 12.19% |
| UK | 11.93% |
| Australia | 11.87% |
| Germany | 11.71% |
| Japan | 11.36% |
Source: Fact.MR analysis. Updated Aug 5, 2026
What is shaping South Korea’s outlook through 2036?
13.17% CAGR, supported by medical-device GMP, digital-device controls and approval documentation.
South Korea’s buying case is tied to manufacturing and import workflows governed by the Ministry of Food and Drug Safety. The 2026 English compilation of medical-device GMP regulations covers conventional devices, in vitro diagnostics and digital medical devices. ERP programs therefore need controlled item, supplier, production and quality records that can support registration and approval work. Export-focused manufacturers also benefit when corporate finance and supply-chain data remain connected to Korean plant documentation.
How is the USA expanding adoption through 2036?
12.58% CAGR, supported by QMSR and risk-based computer software assurance.
The USA entered a new operating phase when the FDA Quality Management System Regulation became effective on February 2, 2026 and incorporated ISO 13485:2016 by reference. FDA guidance issued in February 2026 also defines a risk-based approach to computer software assurance for production and quality-management systems. Medical-device companies must therefore evaluate intended use, process risk, access, configuration and testing evidence when changing ERP. The strongest demand is expected where production, supplier quality and traceability can be governed without excessive custom validation.
What supports Canada’s growth through 2036?
12.19% CAGR, backed by MDSAP participation and medical-device licensing controls.
All manufacturers holding medical-device licences in Canada participate in the Medical Device Single Audit Program. This places sustained attention on quality-system evidence, audit readiness and controlled manufacturer information. ERP selection is therefore expected to favor systems that connect supplier, production, inventory and complaint records with clear ownership. Provincial distribution complexity and cross-border operations also make standardized product and shipment data commercially important.
How does the UK’s market route shape adoption?
11.93% CAGR, driven by separate Great Britain and Northern Ireland registration paths.
Devices placed on the Great Britain market must be registered with the MHRA and registration information must remain accurate and current. Northern Ireland follows a different route, with most devices requiring EUDAMED registration from May 28, 2026. Medtech companies selling across the UK therefore need ERP and connected regulatory systems to distinguish legal entities, representatives, product registrations and market status. Data governance matters because one product can carry different documentation obligations across the two routes.
What is driving Australia’s ERP demand?
11.87% CAGR, supported by manufacturer evidence and formal quality-system documentation.
The Therapeutic Goods Administration requires manufacturer evidence for medical-device and IVD applications. That evidence relates to conformity assessment and the manufacturer’s quality-management system, and it supports inclusion in the Australian Register of Therapeutic Goods. ERP demand is therefore expected to center on traceable manufacturing, supplier and inventory records that remain consistent with quality documentation. Sponsors and overseas manufacturers also need dependable handoffs between corporate systems and Australian submission processes.
What defines Germany’s outlook through 2036?
11.71% CAGR, shaped by EUDAMED adoption and structured device-data exchange.
Germany’s medtech manufacturers operate within the EU MDR and IVDR framework. Actor registration, UDI/device registration and notified-body certificate modules became mandatory in EUDAMED on May 28, 2026. German companies also have to manage the operational transition from national data processes to the European platform. ERP projects gain relevance when product masters, legal entities, UDI attributes and certificate references can be synchronized without duplicating ownership across quality and regulatory teams.
How does Japan develop demand through 2036?
11.36% CAGR, supported by PMDA QMS inspections and localized manufacturing controls.
PMDA conducts document-based and on-site QMS inspections for registered manufacturing sites in Japan and overseas. This encourages careful control of manufacturing-site records, approved processes and quality evidence. Japanese implementations are expected to favor disciplined change management and clear localization rather than broad customization. Global medtech groups also need the Japanese site to operate within corporate finance and supply-chain standards while preserving the documentation required for local inspection.
Who leads the Medical Device and Medtech Enterprise Resource Planning Market?
SAP SE accounts for 15.2% in 2026 among the named provider set. Its position reflects demand for an integrated enterprise core spanning finance, procurement, supply chain, production planning and quality management across large manufacturers.
Oracle Corporation addresses life-sciences ERP and supply-chain programs that include contract manufacturing and global network control. Microsoft Corporation, Infor Inc., IFS AB and Epicor Software Corporation compete through configurable manufacturing, finance and supply-chain suites. QAD Inc. and Rootstock Software have explicit medical-device positioning around traceability, supplier coordination and quality-ready processes.
Aptean Inc. and Deskera Holdings Ltd. add alternatives for focused industry and mid-market requirements. Competition is expected to depend on validation approach, implementation depth, integration architecture, regional support and the ability to manage regulated upgrades without disrupting production.
Which companies are the key providers?
Key companies include SAP SE; Oracle Corporation; Microsoft Corporation; Infor Inc.; IFS AB; QAD Inc.; Epicor Software Corporation; Aptean Inc.; Deskera Holdings Ltd.; and Rootstock Software.
- SAP SE
- Oracle Corporation
- Microsoft Corporation
- Infor Inc.
- IFS AB
- QAD Inc.
- Epicor Software Corporation
- Aptean Inc.
- Deskera Holdings Ltd.
- Rootstock Software
Bibliography
- U.S. Food and Drug Administration. (2026, February 2). Quality Management System Regulation (QMSR).
- U.S. Food and Drug Administration. (2026, February). Computer Software Assurance for Production and Quality Management System Software: Guidance for Industry and Food and Drug Administration Staff.
- European Commission, Directorate-General for Health and Food Safety. (n.d.). EUDAMED: Overview.
- Medicines and Healthcare products Regulatory Agency. (2026, July 20). Register medical devices to place on the market.
- Health Canada. (n.d.). Medical Device Single Audit Program (MDSAP).
- Therapeutic Goods Administration. (2025, June 17). Manufacturer Evidence for medical devices.
- Pharmaceuticals and Medical Devices Agency. (n.d.). GMP, QMS and GCTP Inspections.
- Ministry of Food and Drug Safety. (2026, February 11). Medical Device Good Manufacturing Practice (GMP) Regulations.
- Federal Institute for Drugs and Medical Devices. (n.d.). German Medical Devices Information and Database System (DMIDS).
- SAP SE. (n.d.). SAP Cloud ERP: Manufacturing.
- Oracle Corporation. (n.d.). Life Sciences ERP and Supply Chain Management.
- Microsoft Corporation. (2025, August 13). Quality and nonconformance management overview in Dynamics 365 Supply Chain Management.
- Infor. (n.d.). Industrial Manufacturing Industry Software.
- IFS AB. (n.d.). Enterprise Resource Planning Software Solutions.
- QAD Inc. (n.d.). Advanced Solutions for Medical Devices, Diagnostics and Equipment.
- Epicor Software Corporation. (n.d.). Kinetic ERP.
- Rootstock Software. (n.d.). Medical Device ERP Software.
This Report Answers
- The report provides strategic intelligence on Component, Deployment, Application, Enterprise Size and End User choices that shape ERP purchasing in medical-device and medtech operations.
- Segment analysis covers Software, Cloud-Based, Manufacturing & Production Management, Large Enterprises and Medical Device Manufacturers as the 2026 share leaders.
- Country outlook evaluates South Korea and the USA alongside Canada, the UK, Australia, Germany and Japan.
- Competitive analysis profiles SAP SE alongside Oracle Corporation, Microsoft Corporation, Infor Inc., IFS AB, QAD Inc., Epicor Software Corporation, Aptean Inc., Deskera Holdings Ltd. and Rootstock Software.
- Implementation assessment covers manufacturing control, supply-chain visibility, quality and regulatory integration, cloud validation, data migration and system interfaces.
What does the Medical Device and Medtech Enterprise Resource Planning Market cover?
The market covers enterprise software and related services used to coordinate regulated medical-device and medtech business operations.
Coverage includes ERP Platforms and Regulatory Compliance Modules, together with implementation, consulting and support services. It includes cloud and on-premise deployment across production, supply chain, inventory, quality, regulatory, finance, customer and product-lifecycle workflows when these functions are part of the defined ERP environment. End users include device manufacturers, medical technology companies, CMOs, equipment suppliers and biotechnology companies within the stated segmentation.
The market is distinct from general healthcare-provider ERP because the commercial need originates in product manufacturing, supplier control, device traceability and regulatory evidence. It is also distinct from stand-alone quality or manufacturing software unless those products are sold within the ERP platform or module scope.
What is included in the scope?
Commercial ERP licenses, subscriptions and defined implementation, consulting and support services are included when they serve medical-device and medtech enterprise operations.
The scope includes software for global and regional manufacturers, medtech startups and related end users. It includes Public Cloud, Hybrid Cloud, Private Data Centers and Local Enterprise Servers within the defined deployment structure. It covers production planning, manufacturing execution, inventory optimization, procurement management, QMS integration, FDA and ISO compliance, financial management, CRM and product lifecycle management where these capabilities form part of the assessed ERP system.
What is excluded from the scope?
Medical-device product revenue, hospital-provider ERP and stand-alone applications outside the defined ERP boundary are excluded.
The scope excludes sales of medical devices, diagnostic equipment, implants and healthcare services. It excludes custom software development that is not sold as an ERP product or implementation service. Stand-alone QMS, MES, PLM, CRM, warehouse, cybersecurity and regulatory-submission tools are excluded unless sold as part of the stated ERP platform or module scope. Hardware, data-center construction and general management consulting are also outside the market boundary.
How Was the Analysis Built?
The analysis draws on 120+ sources, 35+ company portfolios, 25+ countries, and more than 20 industry interviews.
- Primary Research: Primary research includes discussions with ERP vendors, implementation partners, medical-device manufacturers, medtech companies, CMOs, quality and regulatory teams, plant leaders, supply-chain managers, IT decision-makers and procurement teams. Interviews examine buying triggers, validation expectations, migration risk, deployment choice, integration scope and vendor selection.
- Desk Research: Desk research covers medical-device regulations, regulator guidance, official databases, standards, company product literature, public filings and authoritative technical material. The bibliography documents the sources used for external factual claims.
- Market Sizing and Forecasting: Market estimates combine software and service revenue with deployment mix, manufacturing footprint, enterprise size, end-user adoption, regulatory complexity, country-level growth and company participation. Segment shares and country conditions are tested against the defined market boundary before the forecast is finalized.
- Data Validation and Update Cycle: The analysis combines primary interviews with structured review of public company disclosures, official statistics, regulatory material, and sector publications. Forecast interpretation considers market conditions, adoption requirements, competitive positioning, and regional operating context.
Segmentation
What is the report’s scope and coverage?
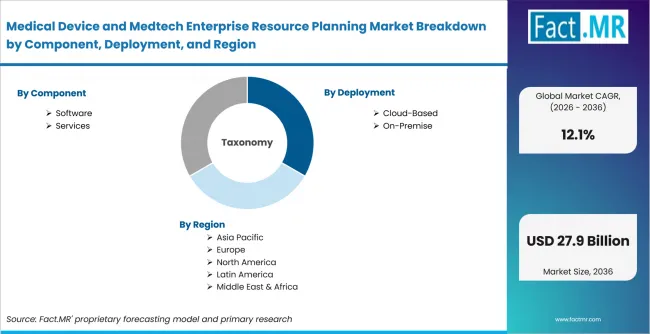
Medical Device And Medtech Enterprise Resource Planning Market Breakdown By Component, Deployment, And Region | Source: Fact.MR
| Attribute | Details |
|---|---|
| Quantitative Units | USD Billion |
| Market Definition | Revenue from ERP software and implementation, consulting and support services purchased for medical-device and medtech enterprise operations within the stated segmentation universe. |
| Component | Software; Services |
| Deployment | Cloud-Based; On-Premise |
| Application | Manufacturing & Production Management; Supply Chain & Inventory Management; Quality & Regulatory Compliance; Others |
| Enterprise Size | Large Enterprises; Small & Medium Enterprises |
| End User | Medical Device Manufacturers; Medical Technology Companies; Others |
| Regions Covered | North America; Latin America; Europe; East Asia; South Asia and Pacific; Middle East and Africa |
| Countries Covered | USA; Japan; Germany; UK; Canada; Australia; South Korea |
| Key Companies Profiled | SAP SE; Oracle Corporation; Microsoft Corporation; Infor Inc.; IFS AB; QAD Inc.; Epicor Software Corporation; Aptean Inc.; Deskera Holdings Ltd.; Rootstock Software |
| Forecast Period | 2026 to 2036 |
| Approach | Hybrid top-down and bottom-up approach using software and service revenue, deployment mix, manufacturing footprint, regulatory complexity, enterprise size, end-user adoption, country-level conditions and company portfolio review |
Source: Fact.MR analysis. Updated Aug 5, 2026
How is the market segmented?
-
By Component:
- Software
- ERP Platforms
- Regulatory Compliance Modules
- Services
- Implementation
- Consulting & Support
- Software
-
By Deployment:
- Cloud-Based
- Public Cloud
- Hybrid Cloud
- On-Premise
- Private Data Centers
- Local Enterprise Servers
- Cloud-Based
-
By Application:
- Manufacturing & Production Management
- Production Planning
- Manufacturing Execution
- Supply Chain & Inventory Management
- Inventory Optimization
- Procurement Management
- Quality & Regulatory Compliance
- QMS Integration
- FDA & ISO Compliance
- Others
- Financial Management
- Customer Relationship Management
- Product Lifecycle Management
- Manufacturing & Production Management
-
By Enterprise Size:
- Large Enterprises
- Global Medical Device Manufacturers
- Multinational MedTech Companies
- Small & Medium Enterprises
- Regional Manufacturers
- MedTech Startups
- Large Enterprises
-
By End User:
- Medical Device Manufacturers
- Diagnostic Device Manufacturers
- Surgical Device Manufacturers
- Medical Technology Companies
- Digital Health Companies
- Implant Manufacturers
- Others
- Contract Manufacturing Organizations (CMOs)
- Healthcare Equipment Suppliers
- Biotechnology Companies
- Medical Device Manufacturers
-
By Region:
- North America
- USA
- Canada
- Latin America
- Europe
- Germany
- UK
- East Asia
- Japan
- South Korea
- South Asia and Pacific
- Australia
- Middle East and Africa
- North America
Frequently Asked Questions
Which Component leads the market?
Which Deployment leads the market?
Which Application leads the market?
Which Enterprise Size leads the market?
Which End User leads the market?
Which country records the highest listed CAGR?
Which companies are active in the market?
What drives and restrains adoption?
Who worked on this report


Preview the report firsthand - request a free sample
Free SampleGet the brochure for pricing and purchase details
Download PDF