- Market Value (2025): USD 69,679.8 Bn
- Estimated Value (2026): USD 74,000.0 Bn
- Forecast Value (2036): 135,044.5 Bn
- CAGR (2026-2036): 6.2%
What is the Mutual Fund Assets Market forecast to be worth by 2036?
USD 74,000.0 billion in 2026 to USD 135,044.5 billion by 2036 at 6.2% CAGR.
- The mutual fund assets market reached USD 69,679.8 billion in 2025 as investors kept using pooled funds for portfolio exposure.
- Demand is projected to increase from USD 74,000.0 billion in 2026 to USD 135,044.5 billion by 2036.
- The market is forecast to record 6.2% CAGR from 2026 to 2036 owing to equity allocation and adviser-led selection.
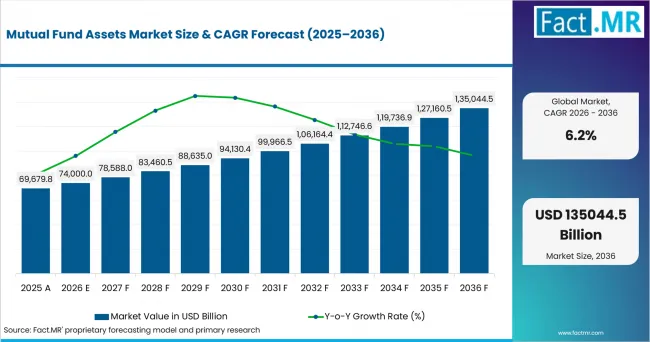
Mutual Fund Assets Market Value Analysis | Source: Fact.MR
What are the defining numbers behind Mutual Fund Assets Market growth?
USD 61,044.5 billion absolute opportunity by 2036.
- Demand Drivers in the Market
- Equity mutual funds are expected to remain the main asset-type driver because investors use them for long holding periods.
- Wealth creation applications are anticipated to support repeat allocation when advisers explain fund cost and risk in plain terms.
- Retail investors are projected to widen the addressable base through adviser channels and online accounts.
- Bank distribution is estimated to stay relevant where existing relationships make fund comparison easier for first-time customers.
- Key Segments Analyzed
- By Asset Type: Equity Mutual Funds are projected to hold 36.7% share in 2026 because investors use stock funds as a core allocation choice.
- By Application: Wealth Creation is estimated to account for 30.9% share in 2026 as advisers connect fund selection with long-term planning goals.
- By End User: Retail Investors are forecast to capture 30.6% share in 2026 through household savings, workplace access and adviser support.
- By Distribution Channel: Banks are expected to hold 32.4% share in 2026 because branch and wealth teams help clients compare fund options.
- By Fund Category: Open-End Mutual Funds are projected to represent 35.4% share in 2026 due to daily liquidity and familiar operating rules.
- Analyst Opinion at Fact.MR
- Shambhu Nath Jha, Principal Consultant at Fact.MR, states, “Mutual fund asset growth depends on whether providers make fund selection easier to evaluate. Clients are expected to place more weight on cost transparency and risk disclosure than on product counts alone.”
- Strategic Implications
- Asset managers should explain how equity mutual funds fit different holding periods. Better financial analytics helps advisers compare risk and fees.
- Banks and advisers are expected to improve conversion by matching fund categories with client goals. Investment banking and brokerage relationships matter when clients shift between advisory accounts.
- Institutions should separate retirement demand from taxable wealth creation. Pension funds create different service needs because reporting discipline shapes holding behavior.
Germany is expected to record a 8.1% CAGR from 2026 to 2036. Brazil is projected to record 7.4%. Australia is anticipated to grow at 4.3%. The USA is estimated at 6.8%. Canada is forecast at 5.0%. The UK is projected to reach 6.2%. Japan is expected to record 5.6%.
How does the Mutual Fund Assets Market break down by segment?
Equity Mutual Funds are expected to lead Asset Type at 30.9% share in 2026. Wealth Creation is projected to lead Application at 38.0% share in 2026.
Which asset type dominates?
Equity Mutual Funds are projected to account for 36.7% share in 2026.
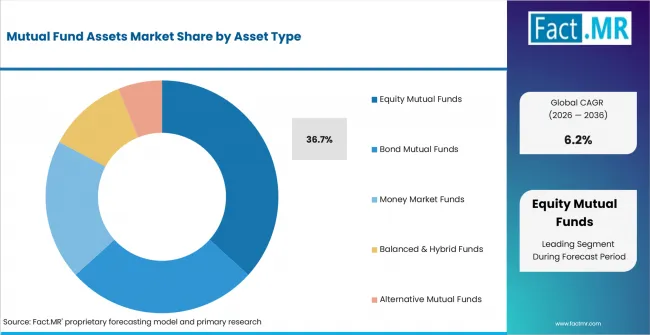
Mutual Fund Assets Market Analysis By Asset Type | Source: Fact.MR
Equity funds lead because they give investors diversified stock exposure without direct security selection. Large-Cap funds suit clients who prefer familiar issuers. Mid & Small-Cap funds serve higher-volatility portfolios. Bond and money market funds support balance.
What leads the Application segment?
Wealth Creation is expected to hold 30.9% share in 2026.
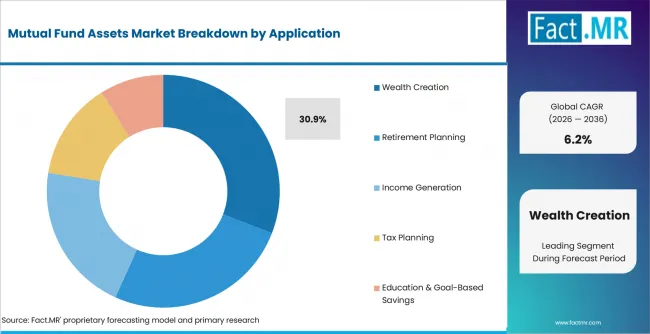
Mutual Fund Assets Market Analysis By Application | Source: Fact.MR
Wealth Creation leads when fund selection is treated as a planning decision. Long-Term Capital Appreciation and Growth Investing remain close uses because both depend on equity exposure. Retirement Planning adds demand when funds match income needs.
How does End User demand form?
Retail Investors are forecast to hold 30.6% share in 2026.
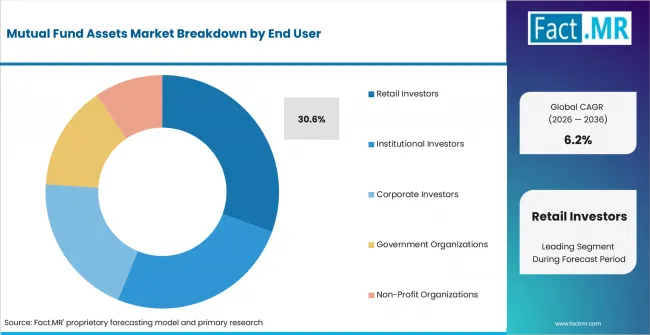
Mutual Fund Assets Market Analysis By End User | Source: Fact.MR
Retail Investors lead because household allocation creates the broadest repeat-use base. Individual Investors need simple comparison of fees and risk. High-Net-Worth Individuals often require adviser review. Institutions keep demand active where mandates require pooled exposure.
Which Distribution Channel leads?
Banks are expected to account for 32.4% share in 2026.
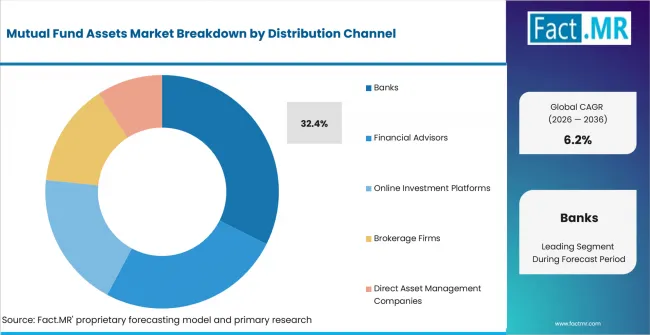
Mutual Fund Assets Market Analysis By Distribution Channel | Source: Fact.MR
Banks lead distribution when clients prefer familiar commercial banking relationships. Private Banking adds advice depth for larger portfolios. Financial Advisors compete where clients want independent review. Online platforms gain when onboarding lowers comparison effort.
What supports Open-End Mutual Funds?
Open-End Mutual Funds are projected to represent 35.4% share in 2026.
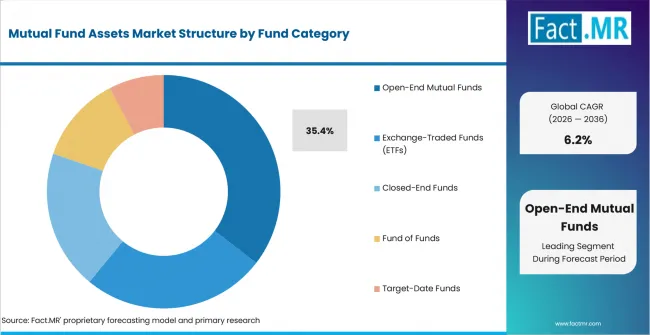
Mutual Fund Assets Market Analysis By Fund Category | Source: Fact.MR
Open-End Mutual Funds lead because daily purchase and redemption features fit routine portfolio management. Actively Managed Funds serve clients who accept higher fees for manager judgment. Index Funds and ETFs serve cost-sensitive investors. Target-Date Funds support retirement planning.
What is accelerating Mutual Fund Assets Market adoption, and what is holding it back?
Demand is expected to rise through greater equity fund investment and adviser support. Market volatility, high fees and suitability checks may slow adoption.
Drivers Impact Analysis
| DRIVER | (~) % IMPACT ON CAGR | GEOGRAPHIC RELEVANCE | IMPACT TIMELINE |
|---|---|---|---|
| Equity mutual fund allocation | +7.4% | Germany and Brazil | Short term (<= 2 years) |
| Wealth creation planning | +6.8% | Brazil and USA | Short term (<= 2 years) |
| Retail investor onboarding | +5.0% | USA and Canada | Medium term (2-4 years) |
| Bank and adviser distribution | +6.2% | Germany and UK | Medium term (2-4 years) |
| Open-end fund liquidity | +4.3% | Australia and Japan | Long term (>= 4 years) |
Source: Fact.MR analysis. Updated Jul 31, 2026
- Equity mutual fund allocation: Diversified stock exposure is expected to raise demand where investors compare risk and fees before moving assets.
- Wealth creation planning: Goal-based advice is anticipated to move fund selection from product browsing to planned allocation.
- Retail investor onboarding: Neobanking access and adviser tools are expected to reduce entry friction for first-time and repeat investors.
Opportunity Impact Analysis
| OPPORTUNITY | (~) % IMPACT ON CAGR | GEOGRAPHIC RELEVANCE | IMPACT TIMELINE |
|---|---|---|---|
| Adviser model portfolio design | +6.8% | Germany and USA | Medium term (2-4 years) |
| Platform education and disclosures | +5.0% | Brazil and Canada | Medium term (2-4 years) |
| Retirement fund packaging | +4.3% | Australia and UK | Long term (>= 4 years) |
| Cross-border allocation support | +5.6% | Japan and international channels | Long term (>= 4 years) |
Source: Fact.MR analysis. Updated Jul 31, 2026
- Adviser model portfolio design: Risk-based fund ranges are expected to make portfolio review easier for advisers and clients.
- Platform education and disclosures: Fund companies and family business advisory teams are projected to improve conversion when explanations stay adviser-reviewed.
- Retirement fund packaging: Target-date and lifecycle funds are anticipated to benefit where households want simple allocation paths.
Restraints Impact Analysis
| RESTRAINT | (~) % IMPACT ON CAGR | GEOGRAPHIC RELEVANCE | IMPACT TIMELINE |
|---|---|---|---|
| Market volatility and redemption anxiety | -0.8% | Global | Short term (<= 2 years) |
| Fee pressure across active funds | -5.0% | USA, Canada and UK | Short term (<= 2 years) |
| Disclosure and suitability review | -4.3% | Germany, Australia and UK | Medium term (2-4 years) |
| Platform overload and fund overlap | -0.3% | Online advisory channels | Medium term (2-4 years) |
Source: Fact.MR analysis. Updated Jul 31, 2026
- Market volatility and redemption anxiety: Fund flows are expected to weaken when investors cannot separate short-term losses from long-term goals.
- Fee pressure across active funds: Active strategies are projected to face closer review when clients compare lower-cost index options.
- Disclosure and suitability review: Advisers are expected to spend more time proving fit. Insurance consulting services show similar documentation pressure.
Which countries are scaling Mutual Fund Assets Market fastest?
- Germany leads through strong adviser relationships and bank distribution. Brazil follows as wealth creation supports managed fund demand. Australia remains high because retirement accounts encourage long-term equity allocation.
- The USA and Canada record steady growth through large investment bases and adviser-led access. The UK advances more carefully as platform comparison and suitability checks shape decisions.
- Japan trails because conservative investment habits limit movement into equity mutual funds.
- Comparable CAGRs are expected to create different entry conditions. Adoption timing depends on adviser education, distribution depth and confidence in fund transparency.
The full report provides country-level CAGR analysis across North America; Latin America; Europe; East Asia; South Asia and Pacific; and the Middle East and Africa.
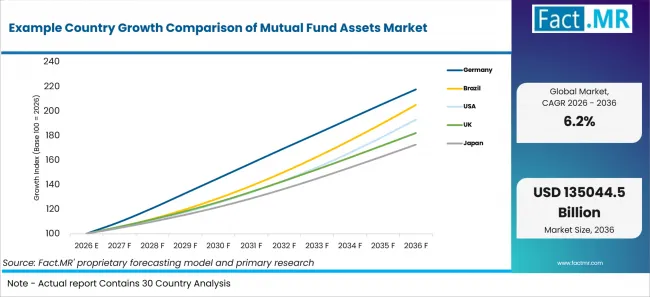
Example Country Growth Comparison Of Mutual Fund Assets Market | Source: Fact.MR
| Country | CAGR (2026-2036) |
|---|---|
| Germany | 8.1% |
| Brazil | 7.4% |
| Australia | 4.3% |
| USA | 6.8% |
| Canada | 5.0% |
| UK | 6.2% |
| Japan | 5.6% |
Source: Fact.MR analysis. Updated Jul 31, 2026
What supports Germany adoption?
7.1% CAGR, supported by adviser-led allocation and bank distribution.
Germany’s fund market is expected to scale through advice-led relationships where clients review risk and cost. Equity Mutual Funds benefit when banks explain portfolio fit in a steady way.
How is Brazil scaling demand?
6.5% CAGR, driven by wealth creation demand and distributor reach.
Brazil’s growth is expected to come from structured wealth creation. Distribution reach matters because many clients need help comparing fund categories. Simple education turns savings intent into repeat allocation.
What shapes Australia’s growth?
6.4% CAGR, backed by retirement allocation and adviser platforms.
Australia’s outlook is supported by savings behavior tied to retirement planning. Adviser platforms are expected to keep comparison active across balanced and lifecycle products.
How does USA demand develop?
5.9% CAGR, supported by a large investor base and advisory platforms.
The USA is expected to grow from a large base where mutual funds compete with ETFs. Retail analytics helps providers separate direct and adviser users.
What supports Canada’s outlook?
5.7% CAGR, led by bank wealth channels and adviser guidance.
Canada’s outlook is shaped by bank distribution and balanced portfolio use. Adviser guidance remains important because many households prefer managed choices. Fee sensitivity slows faster active-fund gains.
How does the UK perform?
5.3% CAGR, influenced by suitability review and platform competition.
The UK is expected to remain measured because investors watch charges and adviser value closely. Platforms make comparison easier and expose overlapping products faster.
What shapes Japan’s outlook?
4.7% CAGR, shaped by conservative allocation habits and aging households.
Japan’s outlook reflects cautious portfolio behavior and slower movement into equity-heavy products. Equity Mutual Funds are expected to gain when providers connect long-term investing with income planning.
Who leads the Mutual Fund Assets Market?
BlackRock and Vanguard show clear scale relevance across retail and adviser channels.
Fidelity Investments and Capital Group compete through retirement relationships. J.P. Morgan Asset Management, Amundi and State Street Investment Management extend the provider base.
Which companies are the key providers?
Key companies include BlackRock; Vanguard; Fidelity Investments; Capital Group; J.P. Morgan Asset Management; Amundi; and State Street Investment Management.
- BlackRock
- Vanguard
- Fidelity Investments
- Capital Group
- J.P. Morgan Asset Management
- Amundi
- State Street Investment Management
Bibliography
- European Commission. (2024, May 22). Commission launches consultation on macroprudential policies for non-bank financial intermediation.
- Australian Prudential Regulation Authority. (2025, February 27). APRA releases superannuation statistics for December 2024.
- European Commission. (2025, September 30). Factsheet: Savings and investment accounts.
- Capital Group. (2024, September 9). Capital Group launches Target Date Retirement Blend Series.
This Report Answers
- The report provides intelligence on the Mutual Fund Assets Market across Asset Type and Application choices.
- Segment analysis covers Equity Mutual Funds and Wealth Creation as 2026 share leaders.
- Country outlook evaluates Germany and Brazil alongside Australia. USA; Canada; UK; and Japan complete the view.
- Competitive analysis profiles BlackRock and Vanguard. Fidelity Investments and Capital Group follow. J.P. Morgan Asset Management, Amundi and State Street Investment Management complete the provider set.
- Channel assessment covers Banks and Financial Advisors. Reconciliation software gives a useful comparison for approval records.
What does the Mutual Fund Assets Market cover?
Mutual Fund Assets cover pooled investment vehicles where professional managers allocate client money across securities or fund strategies. Retail investors and institutions use these products for portfolio allocation and planning.
The market covers equity and bond funds. Money market and hybrid funds are included. Alternative and target-date structures are included when assets are held through mutual fund vehicles. Direct stock trading remains outside the boundary.
What is included in the scope?
Mutual fund assets are used across retail and institutional portfolios. High-net-worth clients and pension funds are included when allocation uses mutual fund vehicles.
The scope includes Asset Type and Application alongside End User, Distribution Channel and Fund Category. Coverage spans equity and bond funds. Money market, balanced and alternative funds complete the asset view. Regional coverage follows the Fact.MR regional frame.
What is excluded from the scope?
Direct stock trading remains outside the scope of this market.
The scope excludes corporate treasury software and general brokerage activity when mutual fund assets are not the core subject. Private equity funds, hedge funds and direct real estate holdings are excluded unless packaged within a mutual fund structure.
How Was the Analysis Built?
The analysis draws on 120+ sources. It reviews 35+ company portfolios and 25+ countries. More than 20 interviews support the assessment.
- Primary Research: Primary research includes discussions with manufacturers and service providers. It covers technology developers, distributors and end users. These conversations examine purchasing priorities.
- Desk Research: Desk research covers government statistics and regulatory publications. It reviews company filings, trade data and industry associations. Retained sources are documented in the bibliography.
- Market Sizing and Forecasting: Market estimates combine historical performance and demand indicators. They review pricing trends, segment shares and country-level growth. Barriers are checked before forecast completion.
- Data Validation and Update Cycle: Findings are validated by comparing interviews with public records. Company activity and regulatory changes are reviewed during updates. Procurement trends are checked before release.
Segmentation
What is the report's scope and coverage?
| Attribute | Details |
|---|---|
| Quantitative Units | USD billion in 2026 to USD billion by 2036 at CAGR |
| Market Definition | Professionally managed mutual fund assets used for pooled investment exposure |
| Asset Type | Equity Mutual Funds; Large-Cap Equity Funds; Mid & Small-Cap Equity Funds; Bond Mutual Funds; Money Market Funds; Balanced & Hybrid Funds |
| Application | Wealth Creation; Long-Term Capital Appreciation; Growth Investing; Retirement Planning; Income Generation; Tax Planning |
| End User | Retail Investors; Individual Investors; High-Net-Worth Individuals; Institutional Investors; Pension Funds; Corporate Investors; Government Organizations |
| Distribution Channel | Banks; Financial Advisors; Online Investment Platforms; Brokerage Firms |
| Fund Category | Open-End Mutual Funds; Actively Managed Funds; Index Funds; Exchange-Traded Funds (ETFs); Closed-End Funds; Fund of Funds |
| Regions Covered | North America; Latin America; Europe; East Asia; South Asia and Pacific; Middle East and Africa |
| Countries Covered | Germany; Brazil; Australia; USA; Canada; UK; Japan |
| Key Companies Profiled | BlackRock; Vanguard; Fidelity Investments; Capital Group; J.P. Morgan Asset Management; Amundi; State Street Investment Management |
| Forecast Period | 2026 to 2036 |
| Approach | Hybrid top-down and bottom-up approach using fund asset demand; segment mix; country adoption patterns; company portfolio review and forecast validation |
Source: Fact.MR analysis. Updated Jul 31, 2026
How is the market segmented?
-
By Asset Type
- Equity Mutual Funds
- Large-Cap Equity Funds
- Mid & Small-Cap Equity Funds
- Bond Mutual Funds
- Government Bond Funds
- Corporate Bond Funds
- Money Market Funds
- Prime Money Market Funds
- Treasury Money Market Funds
- Balanced & Hybrid Funds
- Aggressive Hybrid Funds
- Conservative Hybrid Funds
- Alternative Mutual Funds
- Real Estate Funds
- Commodity Funds
- Equity Mutual Funds
-
By Application
- Wealth Creation
- Long-Term Capital Appreciation
- Growth Investing
- Retirement Planning
- Pension Savings
- 401(k) & Retirement Accounts
- Income Generation
- Dividend Income
- Fixed Income Investments
- Tax Planning
- Tax-Saving Funds
- Municipal Bond Funds
- Education & Goal-Based Savings
- Child Education Planning
- Goal-Oriented Investments
- Wealth Creation
-
By End User
- Retail Investors
- Individual Investors
- High-Net-Worth Individuals
- Institutional Investors
- Pension Funds
- Insurance Companies
- Corporate Investors
- Treasury Investment Units
- Corporate Reserve Funds
- Government Organizations
- Sovereign Institutions
- Public Sector Funds
- Non-Profit Organizations
- Charitable Foundations
- Endowment Funds
- Retail Investors
-
By Distribution Channel
- Banks
- Retail Banking Channels
- Private Banking
- Financial Advisors
- Independent Financial Advisors
- Registered Investment Advisors
- Online Investment Platforms
- Robo-Advisors
- Brokerage Apps
- Brokerage Firms
- Full-Service Brokers
- Discount Brokers
- Direct Asset Management Companies
- AMC Websites
- Direct Investment Portals
- Banks
-
By Fund Category
- Open-End Mutual Funds
- Actively Managed Funds
- Index Funds
- Exchange-Traded Funds (ETFs)
- Equity ETFs
- Bond ETFs
- Closed-End Funds
- Listed Closed-End Funds
- Interval Funds
- Fund of Funds
- Domestic Fund of Funds
- Global Fund of Funds
- Target-Date Funds
- Lifecycle Funds
- Retirement Target Funds
- Open-End Mutual Funds
-
By Region
- North America
- Latin America
- Europe
- East Asia
- South Asia and Pacific
- Middle East and Africa
Frequently Asked Questions
Which Asset Type leads the market?
Which Application leads the market?
Which End User category leads the market?
Which Distribution Channel leads the market?
Which Fund Category leads the market?
Which country records the highest listed CAGR?
What is the primary driver in this market?
What is the main restraint?
Why do retail investors lead demand?
Who worked on this report


Preview the report firsthand - request a free sample
Free SampleGet the brochure for pricing and purchase details
Download PDF