Niobium Hydride Market
Niobium Hydride Market Analysis, By Product Form, By End User Industry, and By Region - Market Insights 2025 to 2035
The Powder segment is projected to grow at a CAGR of 6.4%, whereas another segment Granule is likely to grow at 4%. In terms of countries US is projected to grow at 5.2%, followed by China at 6.1% and Brazil to grow at 6.4%.
Niobium Hydride Market Outlook (2025 to 2035)
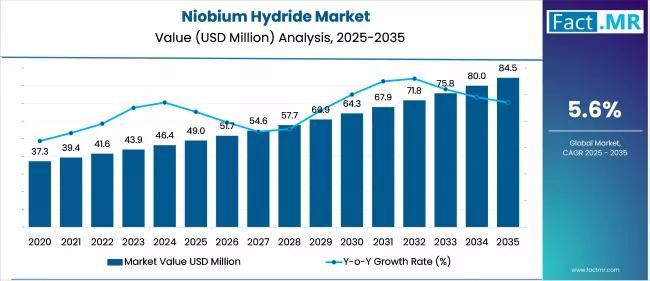
The global niobium hydride market is expected to reach USD 84.5 million by 2035, up from USD 46.4 million in 2024. During the forecast period 2025 to 2035, the industry is projected to expand at a CAGR of 5.6%, driven by its role in clean energy, advanced manufacturing, and next-generation electronics.
Niobium has a high capacity for absorbing and releasing hydrogen, making it a component in hydrogen storage systems and applicable to the broader pursuit of renewable energy sources and green fuel technologies worldwide.
Its strength-to-weight ratio and thermal stability, along with a low mass-to-performance ratio, make it increasingly prevalent in the aerospace and automotive industries, where it has supported improvements in performance and fuel consumption.
In addition, the expanding use of superconducting materials in electronics, quantum computing, and medical imaging will increase the demand for niobium hydride, positioning it as one of the key contributors to technological developments in high-growth industries.
What are the drivers of the Niobium Hydride Market?
Niobium hydride is a material that has also been recognized as a hydrogen absorber, as it has been found to absorb hydrogen reversibly under moderate conditions. It is critical within hydrogen fuel cell systems and is contributing to a global transition to renewable energy.
There is an increasing demand for niobium hydride and other efficient hydrogen storage materials as investment in sustainable infrastructure grows in Asia, Europe, and North America. Its thermal properties and controlled handling characteristics make it suitable for next-generation energy storage and transportation processes, supporting broader decarbonization policies of various economies.
Niobium hydride is used in the aerospace and automotive industries as a solution for producing high-performance lightweight, high-heat, and high-stress alloys. The material finds application in turbine blades, engine parts, and electric vehicle components, contributing to fuel efficiency and reduced emissions.
The continued innovation in electric mobility and aerospace design, which incorporates high standards of efficiency, is fueling the need for advanced niobium-based materials. Its ability to improve mechanical performance while maintaining a substantial weight reduction is a strategic advantage as the industry seeks to comply with regulatory and environmental requirements.
Niobium hydride plays a crucial role in the manufacturing of superconductors used in high-tech applications, such as MRI machines, particle accelerators, and quantum computer hardware. It promotes the synthesis of ultra-clean niobium compounds, which are required in cryogenic and high-frequency conditions.
As industries are investing in quantum technologies and precision imaging, the demand for superconducting elements is increasing. The structural stability of niobium hydride, along with its capability to maintain consistent conductivity, has positioned it as a key material in the advancement of electronic and scientific instrumentation.
What are the regional trends of the Niobium Hydride Market?
The niobium hydride market in North America is growing steadily, driven by increased investment in hydrogen fuel cell infrastructure and the aerospace sector. The U.S. is leading innovative research in superconducting technology, an area facilitated by government financing and inventions from business entities.
Europe is leading the use of niobium hydride, as it is based on its green hydrogen strategy and is pursuing decarbonization. In Germany and France, nations are investing in hydrogen storage and fuel cells.
The Asia Pacific region is the global leader in the niobium hydride market, with China, Japan, and India as key market leaders investing in hydrogen energy systems and electric cars. The increased electronics manufacturing base in the region, along with the growing aerospace market, further contributes to the demand.
The Latin America region is gradually expanding its position in the niobium hydride market, with Brazil leading in niobium mining and export. Although the use of niobium remains limited, the intention to incorporate the niobium compounds into the local clean energy and mobility initiatives is growing.
Niobium hydride is a topic of growing interest in the Middle East & Africa region as these countries diversify their economies, including the sphere of fossil fuels, in the UAE and Saudi Arabia. Although the market is still developing, investments in the production of hydrogen and the research of advanced materials are shaping the long-term adoption of these methods.
What are the challenges and restraining factors of the Niobium Hydride Market?
The niobium hydride market faces challenges due to the lengthy and expensive process of mining and refining. This is due to the need to produce a high-purity form of niobium capable of forming a hydride, which requires sophisticated technological infrastructure that is not readily accessible in most locations. This constrains the scale of production and raises the total cost of the material, resulting in limited availability for broader commercial use.
Another obstacle includes a lack of technical expertise and awareness among end-users regarding the use and combination of niobium hydride in newer applications. Several industries continue to rely on conventional materials due to familiarity and lower costs, meaning that niobium hydride has not yet been implemented into these parameters due to its advanced properties. Such a knowledge gap is particularly notable in developing economies, where high-tech materials are still not considered mainstream.
One of the limitations that companies face in the market is over-reliance on the single-country supply chain, with Brazil leading global niobium production. This concentration increases the exposure to geopolitical instabilities, trade limits and changes in export policies. A disruption in supply from Brazil may cause significant fluctuations in global supply and pricing, thereby discouraging long-term investment and eroding the trust of manufacturers and end-users in other regions.
Country-Wise Insights
China’s clean energy transformation and high-tech materials research fuel niobium hydride demand
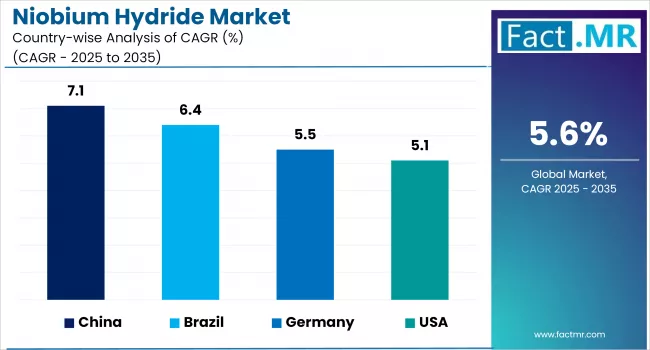
The strategic positioning of China within the niobium hydride industry is shaped by the national policies to accelerate the transition of the energy system towards using hydrogen as its energy source and to increase the independence of high-tech industries in aerospace, defense, and quantum technology.
Beijing, Shenzhen and Suzhou are government sponsored R&D zones and have witnessed innovation in hydrogen storage materials (including stable metal hydrides and superconducting compounds), with leaders being the Materials Department at Tsinghua University and the Chinese Academy of Sciences/Institute of Metal Research.
Niobium hydride is gaining prominence in China's next-generation mobility infrastructure, particularly in hydrogen fuel cell apparatus and energy storage modules of all-electric vehicles (EVs) and unmanned aerial vehicles (UAVs).
Niobium hydride is also being incorporated into fuel systems as a backup power source and as emergency energy reserves in smart cities, as China aims to develop fully integrated clean energy networks. Subsidies on procurement and material innovations have also encouraged the local fabricators to replace the expensive importation of high-end niobium alloys with near-sourcing, through local processing, and assembly with the support of the state.
U.S. strategic materials policy and defense-grade innovation drive niobium hydride utilization
The hydride niobium market is expanding in the context of U.S. interest in a broader strategic materials program that includes strengthening domestic supply chains for strategic technologies in defense, aerospace, and quantum computing.
R&D in superconducting materials, high-strength alloys, and hydrogen storage systems is funded through national laboratories such as Oak Ridge and Sandia, as well as federal programs under the Department of Energy (DOE) and the Department of Defense (DoD).
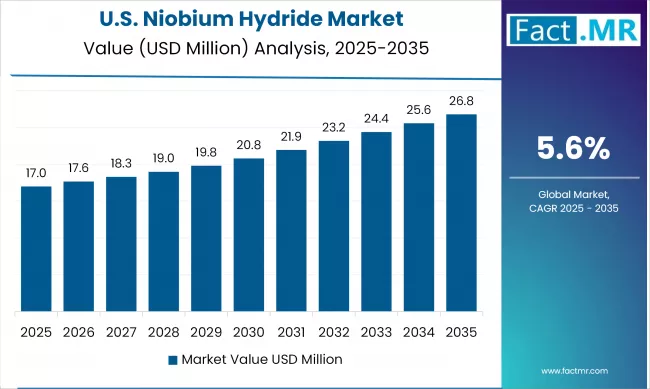
Prototype niobium hydride applications in cryogenic systems, quantum processors, and next-generation fuel cells are being developed in public-private state consortia in California, Colorado, and Massachusetts. NASA, and the U.S. Air Force are advancing their reusable launch vehicle and hypersonic programs, with the niobium-based hydrides under consideration in terms of high-temperature structural stability and magnetic shielding.
The Defense Production Act and the Inflation Reduction Act also introduced policy changes that prioritize rare metal acquisition and refining capacity and encourage investment in domestic or allied sources of supply to reduce reliance on imports.
Brazil’s mineral dominance and vertical integration strategies reinforce niobium hydride market foundation
The prospect of Brazil is anchoring the global niobium hydride market due to its dominance in primary niobium resources, accounting for well over 90 percent of world production, which is largely concentrated within the Arax complex of CBMM. These national strategies have supported the domestic refining capacity, with Brazil going beyond raw niobium exports to high-value compounds such as niobium hydride.
The joint R&D between CBMM, Federal University Minas Gerais (UFMG) and EMBRAPII (Brazilian Industrial Research and Innovation Company) has enabled the production of hydrogen-compatible niobium alloys suitable for used in fuel cells, aviation components and cryogenic infrastructure.
Application of niobium hydride in mobile South American hydrogen storage and power systems is being tested through pilot studies conducted in the cities of Sao Paulo and Minas Gerais. Niobium-based superconductors are also being used in local healthcare and particle physics programs in Brazil through MCTI, the Ministry of Science, Technology, and Innovation.
Category-Wise Analysis
Precision-grade Niobium Hydride Powder Enabling Next-gen Material Engineering
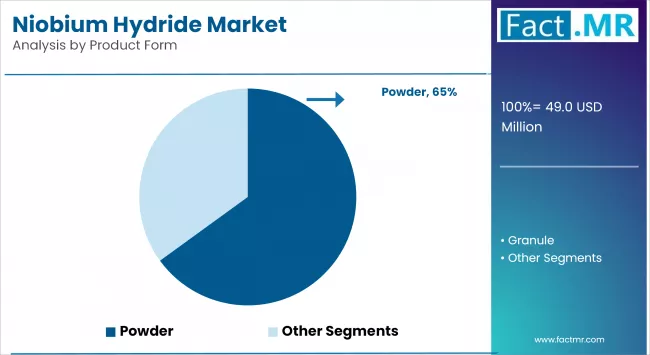
Powder materials are enablers of high-performance material engineering, with advanced routes being explored using niobium hydride and other powder materials due to their capabilities in creating micrometric-scale structures and homogeneous compositions. Since its particle size may commonly be optimized on a sub-100 m basis, the powder form is used to facilitate controlled blending conditions in high-purity alloy manufacturing and reactive brazing chemicals.
It has controllable properties of thermal decomposition and hydrogen release, making it suitable for use in compact hydrogen charging systems, vacuum sintering, and cold isostatic pressing. In South Korea and the Netherlands, two active innovation hubs, nanostructured niobium hydride powders are increasingly being deployed into superconducting cable designs and thin-film deposition processes.
With precision coating and 3D metal printing progressing into the commercial realms, demand is growing for fine control of porosity, thermal stability, and phase transitions in powder-grade materials. Niobium hydride powder aligns with these requirements and presents a multifunctional platform that is scalable, reproducible and a high-purity component fabrication.
Hydrogen-driven Innovation Reshapes Niobium Hydride Use in Manufacturing
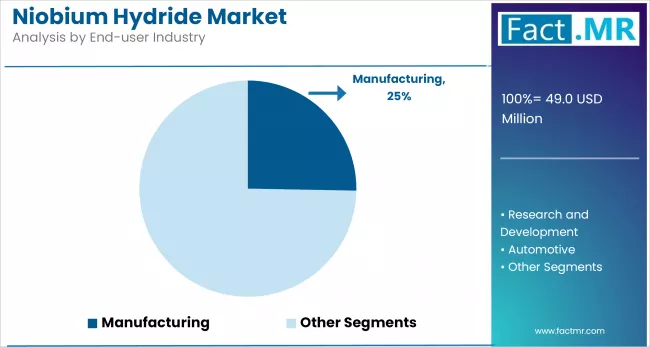
Niobium hydride is gaining ground as a material of choice within manufacturing sectors focused on high-precision bonding, hydrogen compatibility, and ensuring stability in metallurgy. Its regulated release of hydrogen allows its use in processes such as vacuum metallurgy, high-technology welding, and component sintering, particularly for electronic assemblies, aerospace brackets, and cryogenic fixtures.
U.S., Japanese, and German leading manufacturers are incorporating niobium hydride into their proprietary alloying systems, as it aids in thermal cycling resistance and microstructural uniformity. As the requirement for hydrogen-compatible facilities and lightweight composite structures increases, manufacturers are utilizing niobium hydride to develop thin-layer deposition materials, structural foams, and bonding agents, thereby enhancing strength and thickness without increasing weight.
Moreover, the stability of niobium hydride in powder metallurgy and additive manufacturing processes enables faster prototyping and improves batch repeatability. This is particularly relevant in the production of smart sensors, thermal-controlled enclosures, and miniaturized components, where performance and process scalability must be maintained.
Competitive Analysis
The competitive landscape of the niobium hydride market is stratified and inclusive, featuring global giants of the material production, as well as regional quality professionals and application-oriented innovators thriving and competing based on the degree of performance stability, the level of safety conformance and the breakthroughs of synthesis technology.
Vertical integration and in-house powder metallurgy offer strategic advantages to certain players, particularly in the supply of high-purity niobium hydride used in hydrogen storage, superconducting assemblies, and aerospace-grade alloy systems. The distinct capability of companies that can achieve tight tolerances in hydrogen release kinetics, thermal stability, and phase purity is applicable in defense, energy, and coolant systems where performance is essential and failure cannot be tolerated.
Companies with local manufacturing sources in Brazil, the U.S., or China can benefit from proximity to raw niobium resources or specific trade frameworks that help reduce pricing and maintain supply continuity. Technologically advanced players focusing on R&D in particle morphology, alloy reaction behavior, and safety under ambient conditions hold stronger positions in the technical decision-making processes of high-risk infrastructure and next-generation mobility platforms.
The presence of government-supported research initiatives, including hydrogen economy programs, superconducting research, and strategic metal alliances, has encouraged collaboration between niobium processors and high-tech end-users, thereby contributing to the evolution of regional competitiveness.
Key players in the niobium hydride industry include American Elements, NEO, Apollo Scientific, Atlantic Equipment Engineers, Noah Chemicals, and NanoChemaZone.
Recent Developments
- In December 2024, American Elements announced the expansion of its Gallium, Germanium and Antimony production facilities due to increased demand for its inventories. The increased capacity will also expand American Elements' production of all related products, including alloys, oxides, and related compounds.
Fact.MR has provided detailed information about the price points of key manufacturers of the Niobium Hydride Market positioned across regions, sales growth, production capacity, and speculative technological expansion, in the recently published report.
Methodology and Industry Tracking Approach
The global niobium hydride market 2025 report is based on insights from 13,000 industry professionals across 35 countries and 310 regions, including materials scientists, hydrogen storage experts, and aerospace engineers. Conducted from July 2024 to June 2025, the study focuses on end-use behavior, structural performance, regulatory compliance, and sustainability limitations of niobium hydride.
Using a weights-based statistical model and a regional technology readiness index, the report provides precise market trend analysis and segmentation. Drawing on over 300 expert sources, including scientific publications, patents, material compliance frameworks, and ESG reports, it presents strategies for developers and manufacturers in the energy, defense, and superconductivity sectors.
Application-driven modeling guides innovations in high-purity, scalable niobium hydride for hydrogen storage, superconductor infrastructure, and energy-efficient manufacturing. Emphasis is placed on material lifecycle, durability, and global certification standards. Supported by Fact.MR’s market tracking since 2018, this report serves as a reliable reference for stakeholders in advanced materials and clean energy industries.
Segmentation of Niobium Hydride Market
-
By Product Form :
- Powder
- Granule
-
By End-User Industry :
- Manufacturing
- Research and Development
- Automotive
- Energy
- Healthcare
-
By Region :
- North America
- Latin America
- Western Europe
- Eastern Europe
- East Asia
- South Asia & Pacific
- Middle East & Africa
Table of Content
- Executive Summary
- Global Market Outlook
- Demand-side Trends
- Supply-side Trends
- Technology Roadmap Analysis
- Analysis and Recommendations
- Market Overview
- Market Coverage / Taxonomy
- Market Definition / Scope / Limitations
- Market Background
- Market Dynamics
- Drivers
- Restraints
- Opportunity
- Trends
- Scenario Forecast
- Demand in Optimistic Scenario
- Demand in Likely Scenario
- Demand in Conservative Scenario
- Opportunity Map Analysis
- Product Life Cycle Analysis
- Supply Chain Analysis
- Supply Side Participants and their Roles
- Producers
- Mid-Level Participants (Traders/ Agents/ Brokers)
- Wholesalers and Distributors
- Value Added and Value Created at Node in the Supply Chain
- List of Component Suppliers
- List of Existing and Potential Buyers
- Supply Side Participants and their Roles
- Investment Feasibility Matrix
- Value Chain Analysis
- Profit Margin Analysis
- Wholesalers and Distributors
- Retailers
- PESTLE and Porter’s Analysis
- Regulatory Landscape
- By Key Regions
- By Key Countries
- Production and Consumption Statistics
- Import and Export Statistics
- Market Dynamics
- Global Market Analysis 2020 to 2024 and Forecast, 2025 to 2035
- Historical Market Size Value (USD Mn) & Volume (Tons) Analysis, 2020 to 2024
- Current and Future Market Size Value (USD Mn) & Volume (Tons) Projections, 2025 to 2035
- Y-o-Y Growth Trend Analysis
- Absolute $ Opportunity Analysis
- Global Market Pricing Analysis 2020 to 2024 and Forecast 2025 to 2035
- Global Market Analysis 2020 to 2024 and Forecast 2025 to 2035, By Product Form
- Introduction / Key Findings
- Historical Market Size Value (USD Mn) & Volume (Tons) Analysis By Product Form, 2020 to 2024
- Current and Future Market Size Value (USD Mn) & Volume (Tons) Analysis and Forecast By Product Form, 2025 to 2035
- Powder
- Granule
- Y-o-Y Growth Trend Analysis By Product Form, 2020 to 2024
- Absolute $ Opportunity Analysis By Product Form, 2025 to 2035
- Global Market Analysis 2020 to 2024 and Forecast 2025 to 2035, By End-User Industry
- Introduction / Key Findings
- Historical Market Size Value (USD Mn) & Volume (Tons) Analysis By End-User Industry, 2020 to 2024
- Current and Future Market Size Value (USD Mn) & Volume (Tons) Analysis and Forecast By End-User Industry, 2025 to 2035
- Manufacturing
- Research and Development
- Automotive
- Energy
- Healthcare
- Y-o-Y Growth Trend Analysis By End-User Industry, 2020 to 2024
- Absolute $ Opportunity Analysis By End-User Industry, 2025 to 2035
- Global Market Analysis 2020 to 2024 and Forecast 2025 to 2035, By Region
- Introduction
- Historical Market Size Value (USD Mn) & Volume (Tons) Analysis By Region, 2020 to 2024
- Current Market Size Value (USD Mn) & Volume (Tons) Analysis and Forecast By Region, 2025 to 2035
- North America
- Latin America
- Western Europe
- East Asia
- South Asia Pacific
- Eastern Europe
- Middle East & Africa
- Market Attractiveness Analysis By Region
- North America Market Analysis 2020 to 2024 and Forecast 2025 to 2035, By Country
- Historical Market Size Value (USD Mn) & Volume (Tons) Trend Analysis By Market Taxonomy, 2020 to 2024
- Market Size Value (USD Mn) & Volume (Tons) Forecast By Market Taxonomy, 2025 to 2035
- By Country
- U.S.
- Canada
- Mexico
- By Product Form
- By End-User Industry
- By Country
- Market Attractiveness Analysis
- By Country
- By Product Form
- By End-User Industry
- Key Takeaways
- Latin America Market Analysis 2020 to 2024 and Forecast 2025 to 2035, By Country
- Historical Market Size Value (USD Mn) & Volume (Tons) Trend Analysis By Market Taxonomy, 2020 to 2024
- Market Size Value (USD Mn) & Volume (Tons) Forecast By Market Taxonomy, 2025 to 2035
- By Country
- Brazil
- Chile
- Rest of Latin America
- By Product Form
- By End-User Industry
- By Country
- Market Attractiveness Analysis
- By Country
- By Product Form
- By End-User Industry
- Key Takeaways
- Western Europe Market Analysis 2020 to 2024 and Forecast 2025 to 2035, By Country
- Historical Market Size Value (USD Mn) & Volume (Tons) Trend Analysis By Market Taxonomy, 2020 to 2024
- Market Size Value (USD Mn) & Volume (Tons) Forecast By Market Taxonomy, 2025 to 2035
- By Country
- Germany
- Italy
- France
- U.K.
- Spain
- Russia
- BENELUX
- Rest of Europe
- By Product Form
- By End-User Industry
- By Country
- Market Attractiveness Analysis
- By Country
- By Product Form
- By End-User Industry
- Key Takeaways
- East Asia Market Analysis 2020 to 2024 and Forecast 2025 to 2035, By Country
- Historical Market Size Value (USD Mn) & Volume (Tons) Trend Analysis By Market Taxonomy, 2020 to 2024
- Market Size Value (USD Mn) & Volume (Tons) Forecast By Market Taxonomy, 2025 to 2035
- By Country
- China
- Japan
- South Korea
- By Product Form
- By End-User Industry
- By Country
- Market Attractiveness Analysis
- By Country
- By Product Form
- By End-User Industry
- Key Takeaways
- South Asia Pacific Market Analysis 2020 to 2024 and Forecast 2025 to 2035, By Country
- Historical Market Size Value (USD Mn) & Volume (Tons) Trend Analysis By Market Taxonomy, 2020 to 2024
- Market Size Value (USD Mn) & Volume (Tons) Forecast By Market Taxonomy, 2025 to 2035
- By Country
- India
- ASEAN Countries
- Australia & New Zealand
- Rest of South Asia Pacific
- By Product Form
- By End-User Industry
- By Country
- Market Attractiveness Analysis
- By Country
- By Product Form
- By End-User Industry
- Key Takeaways
- Eastern Europe Market Analysis 2020 to 2024 and Forecast 2025 to 2035, By Country
- Historical Market Size Value (USD Mn) & Volume (Tons) Trend Analysis By Market Taxonomy, 2020 to 2024
- Market Size Value (USD Mn) & Volume (Tons) Forecast By Market Taxonomy, 2025 to 2035
- By Country
- Russia
- Poland
- Hungary
- Balkan & Baltics
- Rest of Eastern Europe
- By Product Form
- By End-User Industry
- By Country
- Market Attractiveness Analysis
- By Country
- By Product Form
- By End-User Industry
- Key Takeaways
- Middle East & Africa Market Analysis 2020 to 2024 and Forecast 2025 to 2035, By Country
- Historical Market Size Value (USD Mn) & Volume (Tons) Trend Analysis By Market Taxonomy, 2020 to 2024
- Market Size Value (USD Mn) & Volume (Tons) Forecast By Market Taxonomy, 2025 to 2035
- By Country
- KSA
- Other GCC Countries
- Turkiye
- South Africa
- Rest of MEA
- By Product Form
- By End-User Industry
- By Country
- Market Attractiveness Analysis
- By Country
- By Product Form
- By End-User Industry
- Key Takeaways
- Key Countries Market Analysis
- China
- Pricing Analysis
- Market Share Analysis, 2024
- By Product Form
- By End-User Industry
- USA
- Pricing Analysis
- Market Share Analysis, 2024
- By Product Form
- By End-User Industry
- Brazil
- Pricing Analysis
- Market Share Analysis, 2024
- By Product Form
- By End-User Industry
- Germany
- Pricing Analysis
- Market Share Analysis, 2024
- By Product Form
- By End-User Industry
- Japan
- Pricing Analysis
- Market Share Analysis, 2024
- By Product Form
- By End-User Industry
- China
- Market Structure Analysis
- Competition Dashboard
- Competition Benchmarking
- Market Share Analysis of Top Players
- By Regional
- By Product Form
- By End-User Industry
- Competition Analysis
- Competition Deep Dive
- American Elements
- Overview
- Product Portfolio
- Profitability by Market Segments (Product/Age /Sales Channel/Region)
- Sales Footprint
- Strategy Overview
- Marketing Strategy
- Product Strategy
- Channel Strategy
- NEO
- Overview
- Product Portfolio
- Profitability by Market Segments (Product/Age /Sales Channel/Region)
- Sales Footprint
- Strategy Overview
- Marketing Strategy
- Product Strategy
- Channel Strategy
- Apollo Scientific
- Overview
- Product Portfolio
- Profitability by Market Segments (Product/Age /Sales Channel/Region)
- Sales Footprint
- Strategy Overview
- Marketing Strategy
- Product Strategy
- Channel Strategy
- Atlantic Equipment Engineers
- Overview
- Product Portfolio
- Profitability by Market Segments (Product/Age /Sales Channel/Region)
- Sales Footprint
- Strategy Overview
- Marketing Strategy
- Product Strategy
- Channel Strategy
- Noah Chemicals
- Overview
- Product Portfolio
- Profitability by Market Segments (Product/Age /Sales Channel/Region)
- Sales Footprint
- Strategy Overview
- Marketing Strategy
- Product Strategy
- Channel Strategy
- NanoChemaZone
- Overview
- Product Portfolio
- Profitability by Market Segments (Product/Age /Sales Channel/Region)
- Sales Footprint
- Strategy Overview
- Marketing Strategy
- Product Strategy
- Channel Strategy
- American Elements
- Competition Deep Dive
- Assumptions & Acronyms Used
- Research Methodology
List Of Table
- Table 1: Global Market Value (USD Mn) Forecast by Region, 2020 to 2035
- Table 2: Global Market Volume (Tons) Forecast by Region, 2020 to 2035
- Table 3: Global Market Value (USD Mn) Forecast by Product Form, 2020 to 2035
- Table 4: Global Market Volume (Tons) Forecast by Product Form, 2020 to 2035
- Table 5: Global Market Value (USD Mn) Forecast by End-User Industry, 2020 to 2035
- Table 6: Global Market Volume (Tons) Forecast by End-User Industry, 2020 to 2035
- Table 7: North America Market Value (USD Mn) Forecast by Country, 2020 to 2035
- Table 8: North America Market Volume (Tons) Forecast by Country, 2020 to 2035
- Table 9: North America Market Value (USD Mn) Forecast by Product Form, 2020 to 2035
- Table 10: North America Market Volume (Tons) Forecast by Product Form, 2020 to 2035
- Table 11: North America Market Value (USD Mn) Forecast by End-User Industry, 2020 to 2035
- Table 12: North America Market Volume (Tons) Forecast by End-User Industry, 2020 to 2035
- Table 13: Latin America Market Value (USD Mn) Forecast by Country, 2020 to 2035
- Table 14: Latin America Market Volume (Tons) Forecast by Country, 2020 to 2035
- Table 15: Latin America Market Value (USD Mn) Forecast by Product Form, 2020 to 2035
- Table 16: Latin America Market Volume (Tons) Forecast by Product Form, 2020 to 2035
- Table 17: Latin America Market Value (USD Mn) Forecast by End-User Industry, 2020 to 2035
- Table 18: Latin America Market Volume (Tons) Forecast by End-User Industry, 2020 to 2035
- Table 19: Western Europe Market Value (USD Mn) Forecast by Country, 2020 to 2035
- Table 20: Western Europe Market Volume (Tons) Forecast by Country, 2020 to 2035
- Table 21: Western Europe Market Value (USD Mn) Forecast by Product Form, 2020 to 2035
- Table 22: Western Europe Market Volume (Tons) Forecast by Product Form, 2020 to 2035
- Table 23: Western Europe Market Value (USD Mn) Forecast by End-User Industry, 2020 to 2035
- Table 24: Western Europe Market Volume (Tons) Forecast by End-User Industry, 2020 to 2035
- Table 25: East Asia Market Value (USD Mn) Forecast by Country, 2020 to 2035
- Table 26: East Asia Market Volume (Tons) Forecast by Country, 2020 to 2035
- Table 27: East Asia Market Value (USD Mn) Forecast by Product Form, 2020 to 2035
- Table 28: East Asia Market Volume (Tons) Forecast by Product Form, 2020 to 2035
- Table 29: East Asia Market Value (USD Mn) Forecast by End-User Industry, 2020 to 2035
- Table 30: East Asia Market Volume (Tons) Forecast by End-User Industry, 2020 to 2035
- Table 31: South Asia Pacific Market Value (USD Mn) Forecast by Country, 2020 to 2035
- Table 32: South Asia Pacific Market Volume (Tons) Forecast by Country, 2020 to 2035
- Table 33: South Asia Pacific Market Value (USD Mn) Forecast by Product Form, 2020 to 2035
- Table 34: South Asia Pacific Market Volume (Tons) Forecast by Product Form, 2020 to 2035
- Table 35: South Asia Pacific Market Value (USD Mn) Forecast by End-User Industry, 2020 to 2035
- Table 36: South Asia Pacific Market Volume (Tons) Forecast by End-User Industry, 2020 to 2035
- Table 37: Eastern Europe Market Value (USD Mn) Forecast by Country, 2020 to 2035
- Table 38: Eastern Europe Market Volume (Tons) Forecast by Country, 2020 to 2035
- Table 39: Eastern Europe Market Value (USD Mn) Forecast by Product Form, 2020 to 2035
- Table 40: Eastern Europe Market Volume (Tons) Forecast by Product Form, 2020 to 2035
- Table 41: Eastern Europe Market Value (USD Mn) Forecast by End-User Industry, 2020 to 2035
- Table 42: Eastern Europe Market Volume (Tons) Forecast by End-User Industry, 2020 to 2035
- Table 43: Middle East & Africa Market Value (USD Mn) Forecast by Country, 2020 to 2035
- Table 44: Middle East & Africa Market Volume (Tons) Forecast by Country, 2020 to 2035
- Table 45: Middle East & Africa Market Value (USD Mn) Forecast by Product Form, 2020 to 2035
- Table 46: Middle East & Africa Market Volume (Tons) Forecast by Product Form, 2020 to 2035
- Table 47: Middle East & Africa Market Value (USD Mn) Forecast by End-User Industry, 2020 to 2035
- Table 48: Middle East & Africa Market Volume (Tons) Forecast by End-User Industry, 2020 to 2035
List Of Figures
- Figure 1: Global Market Volume (Tons) Forecast 2020 to 2035
- Figure 2: Global Market Pricing Analysis
- Figure 3: Global Market Value (USD Mn) Forecast 2020 to 2035
- Figure 4: Global Market Value Share and BPS Analysis by Product Form, 2025 and 2035
- Figure 5: Global Market Y-o-Y Growth Comparison by Product Form, 2025 to 2035
- Figure 6: Global Market Attractiveness Analysis by Product Form
- Figure 7: Global Market Value Share and BPS Analysis by End-User Industry, 2025 and 2035
- Figure 8: Global Market Y-o-Y Growth Comparison by End-User Industry, 2025 to 2035
- Figure 9: Global Market Attractiveness Analysis by End-User Industry
- Figure 10: Global Market Value (USD Mn) Share and BPS Analysis by Region, 2025 and 2035
- Figure 11: Global Market Y-o-Y Growth Comparison by Region, 2025 to 2035
- Figure 12: Global Market Attractiveness Analysis by Region
- Figure 13: North America Market Incremental $ Opportunity, 2025 to 2035
- Figure 14: Latin America Market Incremental $ Opportunity, 2025 to 2035
- Figure 15: Western Europe Market Incremental $ Opportunity, 2025 to 2035
- Figure 16: East Asia Market Incremental $ Opportunity, 2025 to 2035
- Figure 17: South Asia Pacific Market Incremental $ Opportunity, 2025 to 2035
- Figure 18: Eastern Europe Market Incremental $ Opportunity, 2025 to 2035
- Figure 19: Middle East & Africa Market Incremental $ Opportunity, 2025 to 2035
- Figure 20: North America Market Value Share and BPS Analysis by Country, 2025 and 2035
- Figure 21: North America Market Value Share and BPS Analysis by Product Form, 2025 and 2035
- Figure 22: North America Market Y-o-Y Growth Comparison by Product Form, 2025 to 2035
- Figure 23: North America Market Attractiveness Analysis by Product Form
- Figure 24: North America Market Value Share and BPS Analysis by End-User Industry, 2025 and 2035
- Figure 25: North America Market Y-o-Y Growth Comparison by End-User Industry, 2025 to 2035
- Figure 26: North America Market Attractiveness Analysis by End-User Industry
- Figure 27: Latin America Market Value Share and BPS Analysis by Country, 2025 and 2035
- Figure 28: Latin America Market Value Share and BPS Analysis by Product Form, 2025 and 2035
- Figure 29: Latin America Market Y-o-Y Growth Comparison by Product Form, 2025 to 2035
- Figure 30: Latin America Market Attractiveness Analysis by Product Form
- Figure 31: Latin America Market Value Share and BPS Analysis by End-User Industry, 2025 and 2035
- Figure 32: Latin America Market Y-o-Y Growth Comparison by End-User Industry, 2025 to 2035
- Figure 33: Latin America Market Attractiveness Analysis by End-User Industry
- Figure 34: Western Europe Market Value Share and BPS Analysis by Country, 2025 and 2035
- Figure 35: Western Europe Market Value Share and BPS Analysis by Product Form, 2025 and 2035
- Figure 36: Western Europe Market Y-o-Y Growth Comparison by Product Form, 2025 to 2035
- Figure 37: Western Europe Market Attractiveness Analysis by Product Form
- Figure 38: Western Europe Market Value Share and BPS Analysis by End-User Industry, 2025 and 2035
- Figure 39: Western Europe Market Y-o-Y Growth Comparison by End-User Industry, 2025 to 2035
- Figure 40: Western Europe Market Attractiveness Analysis by End-User Industry
- Figure 41: East Asia Market Value Share and BPS Analysis by Country, 2025 and 2035
- Figure 42: East Asia Market Value Share and BPS Analysis by Product Form, 2025 and 2035
- Figure 43: East Asia Market Y-o-Y Growth Comparison by Product Form, 2025 to 2035
- Figure 44: East Asia Market Attractiveness Analysis by Product Form
- Figure 45: East Asia Market Value Share and BPS Analysis by End-User Industry, 2025 and 2035
- Figure 46: East Asia Market Y-o-Y Growth Comparison by End-User Industry, 2025 to 2035
- Figure 47: East Asia Market Attractiveness Analysis by End-User Industry
- Figure 48: South Asia Pacific Market Value Share and BPS Analysis by Country, 2025 and 2035
- Figure 49: South Asia Pacific Market Value Share and BPS Analysis by Product Form, 2025 and 2035
- Figure 50: South Asia Pacific Market Y-o-Y Growth Comparison by Product Form, 2025 to 2035
- Figure 51: South Asia Pacific Market Attractiveness Analysis by Product Form
- Figure 52: South Asia Pacific Market Value Share and BPS Analysis by End-User Industry, 2025 and 2035
- Figure 53: South Asia Pacific Market Y-o-Y Growth Comparison by End-User Industry, 2025 to 2035
- Figure 54: South Asia Pacific Market Attractiveness Analysis by End-User Industry
- Figure 55: Eastern Europe Market Value Share and BPS Analysis by Country, 2025 and 2035
- Figure 56: Eastern Europe Market Value Share and BPS Analysis by Product Form, 2025 and 2035
- Figure 57: Eastern Europe Market Y-o-Y Growth Comparison by Product Form, 2025 to 2035
- Figure 58: Eastern Europe Market Attractiveness Analysis by Product Form
- Figure 59: Eastern Europe Market Value Share and BPS Analysis by End-User Industry, 2025 and 2035
- Figure 60: Eastern Europe Market Y-o-Y Growth Comparison by End-User Industry, 2025 to 2035
- Figure 61: Eastern Europe Market Attractiveness Analysis by End-User Industry
- Figure 62: Middle East & Africa Market Value Share and BPS Analysis by Country, 2025 and 2035
- Figure 63: Middle East & Africa Market Value Share and BPS Analysis by Product Form, 2025 and 2035
- Figure 64: Middle East & Africa Market Y-o-Y Growth Comparison by Product Form, 2025 to 2035
- Figure 65: Middle East & Africa Market Attractiveness Analysis by Product Form
- Figure 66: Middle East & Africa Market Value Share and BPS Analysis by End-User Industry, 2025 and 2035
- Figure 67: Middle East & Africa Market Y-o-Y Growth Comparison by End-User Industry, 2025 to 2035
- Figure 68: Middle East & Africa Market Attractiveness Analysis by End-User Industry
- Figure 69: Global Market - Tier Structure Analysis
- Figure 70: Global Market - Company Share Analysis
- FAQs -
What was the global niobium hydride market size reported by Fact.MR for 2025?
The global niobium hydride market was valued at USD 49 million in 2025.
Who are the major players operating in the niobium hydride market?
Prominent players in the market are American Elements, NEO, Apollo Scientific, Atlantic Equipment Engineers, and others.
What is the estimated valuation of the niobium hydride market in 2035?
The market is expected to reach a valuation of USD 84.5 million in 2035.
What value CAGR did the niobium hydride market exhibit over the last five years?
The historic growth rate of the niobium hydride market was 5.2% from 2020 to 2024.