- Market Value (2025): USD 1.5 Bn
- Estimated Value (2026): USD 1.7 Bn
- Forecast Value (2036): USD 5.6 Bn
- CAGR (2026-2036): 12.4%
What is the PCR Reusable Concession Cups Market forecast to be worth by 2036?
USD 1.7 billion in 2026 to USD 5.6 billion by 2036 at a 12.4% CAGR.
- The PCR Reusable Concession Cups Market crossed a valuation of USD 1.5 billion in 2025.
- Demand is projected to increase from USD 1.7 billion in 2026 to USD 5.6 billion by 2036.
- The market is forecast to record a 12.4% CAGR from 2026 to 2036, shaped by stadium reuse programs and event deposit systems.
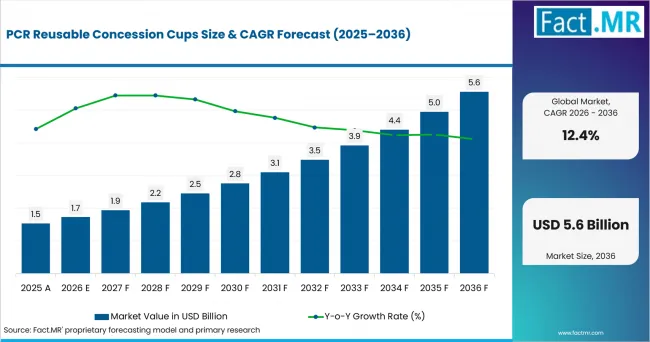
Pcr Reusable Concession Cups Value Analysis | Source: Fact.MR
What are the defining numbers behind PCR Reusable Concession Cups Market growth?
USD 3.8 billion absolute opportunity by 2036, led by PCR polypropylene, venue deposit-return and stadiums.
- Demand Drivers in the Market
- Stadium operators need cups that survive quick service, repeated washing and fast return windows after events.
- Festival organizers need deposit-based cup pools that reduce litter and keep collection simple across temporary sites.
- Campus foodservice teams need standard cup formats that fit dishwashing, storage and beverage-counter routines.
- Brand sponsors need decorated reusable cups that carry event identity during service and after the drink is finished.
- Key Segments Analyzed
- By Cup Material: PCR polypropylene is projected to hold 31.0% share in 2026, driven by lightweight durability and familiar PP handling.
- By Use Model: Venue deposit-return is expected to account for 29.0% share in 2026, supported by direct return incentives at fixed exits.
- By Capacity: <300 mL is anticipated to capture 36.0% share in 2026, owing to compact servings used in hot drinks and children-focused concessions.
- By End-use: Stadiums are estimated to represent 34.0% share in 2026, reinforced by repeat events and controlled access points.
- Analyst Opinion at Fact.MR
- Shambhu Nath Jha, Principal Consultant at Fact.MR, states, “Reusable concession cups are no longer only a cup purchase. Venues are buying a return behavior, a washing route and a claims file. Suppliers that combine durable PCR materials with clear deposit operations are expected to win repeat programs.”
- Strategic Implications
- Cup converters should offer PP and PET formats with wash guidance, print limits and recovery routes.
- Venue operators should test return-point placement before scaling deposit systems across full-capacity events.
- Rental providers should track loss rates by gate and beverage area before expanding cup inventories.
- Material teams should document recycled-content claims and food-contact compliance before approaching national chains.
China is projected to post 13.7% CAGR through 2036, supported by catering scale and scenic-area traffic. The USA is forecast to record 13.2% CAGR through controlled leisure venues. Germany is anticipated to advance at 13.0% CAGR as event catering aligns with EU reuse rules. France is expected to post 12.5% CAGR through tourism flows. Japan is estimated to record 11.3% CAGR, shaped by travel spending.
How does the PCR Reusable Concession Cups Market break down by segment?
PCR polypropylene leads at 31.0%; stadiums lead end-use at 34.0%.
Which Cup Material dominates?
PCR polypropylene holds 31.0% share in 2026.
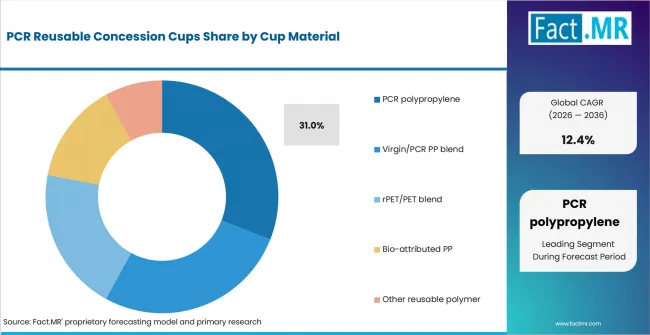
Pcr Reusable Concession Cups Analysis By Cup Material | Source: Fact.MR
PCR polypropylene is projected to hold the material share because it fits concession weight and repeated handling needs. Virgin/PCR PP blend supports stable color and molded stiffness for decorated event cups. Berry’s reusable PP cup range includes washable formats for hot and cold drinks.
What leads the Use Model segment?
Venue deposit-return accounts for 29.0% share in 2026.
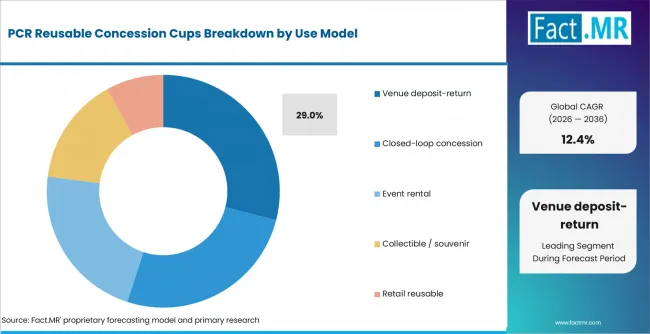
Pcr Reusable Concession Cups Analysis By Use Model | Source: Fact.MR
Venue deposit-return is expected to account for the use-model share because the cup stays inside a controlled site. Event rental suits temporary sites where the cup owner manages washing. Berry reported in March 2025 that Glasgow’s Borrow Cup project included over 40 businesses and a GBP 1 deposit.
How does Capacity shape demand?
<300 mL captures 36.0% share in 2026.
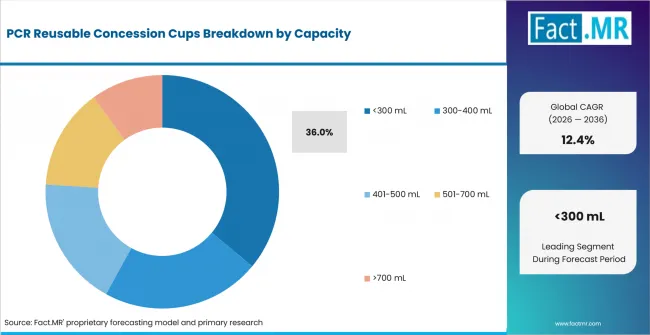
Pcr Reusable Concession Cups Analysis By Capacity | Source: Fact.MR
<300 mL is anticipated to capture the capacity share because smaller servings move quickly through hot-drink counters and children-focused concessions. Larger cups fit beer and souvenir use where the cup carries more branding space. Greiner Packaging’s reusable drinking cup range includes 250 mL, 300 mL, 400 mL and 500 mL PP formats for event operators.
What supports Stadiums within End-use?
Stadiums represent 34.0% share in 2026.
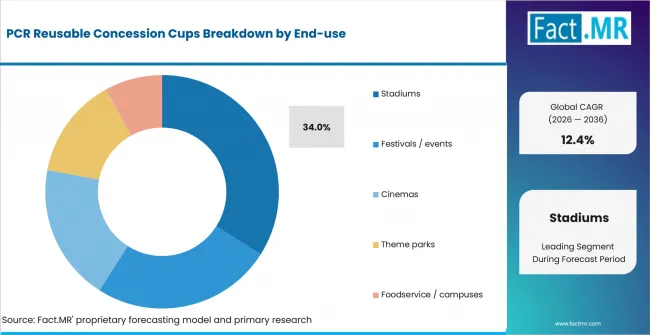
Pcr Reusable Concession Cups Analysis By End Use | Source: Fact.MR
Stadiums are estimated to represent the end-use share because access control helps operators collect cups after events. Repeat fixtures support washing routes and return-point learning. Greiner Packaging reported in June 2025 that around 52,000 fans attended the DTM race weekend at DEKRA Lausitzring where its reusable drinking cups replaced single-use plastic cups.
What is accelerating PCR Reusable Concession Cups Market adoption, and what is holding it back?
Deposit-return operations drive it; loss, washing cost and food-contact proof restrain it.
Drivers Impact Analysis
| DRIVER | (~) % IMPACT ON CAGR | GEOGRAPHIC RELEVANCE | IMPACT TIMELINE |
|---|---|---|---|
| Venue deposit-return systems | +1.8% | North America, Europe, East Asia | Short term (<= 2 years) |
| Reusable foodservice policy pressure | +1.5% | Europe, China, Japan | Medium term (2-4 years) |
| PCR material availability and sorting fit | +1.2% | Global | Medium term (2-4 years) |
| Event branding and souvenir cup use | +0.8% | USA, France, Japan | Long term (>= 4 years) |
Opportunity Impact Analysis
| OPPORTUNITY | (~) % IMPACT ON CAGR | GEOGRAPHIC RELEVANCE | IMPACT TIMELINE |
|---|---|---|---|
| RFID and QR enabled cup pools | +1.1% | Europe, North America | Medium term (2-4 years) |
| Campus and corporate foodservice reuse | +0.9% | USA, Germany, Japan | Medium term (2-4 years) |
| Food-grade recycled PET cup loops | +0.8% | Europe | Long term (>= 4 years) |
| Small-format hot drink programs | +0.6% | Global | Short term (<= 2 years) |
Restraints Impact Analysis
| RESTRAINT | (~) % IMPACT ON CAGR | GEOGRAPHIC RELEVANCE | IMPACT TIMELINE |
|---|---|---|---|
| Cup loss outside controlled venues | -0.8% | Global | Short term (<= 2 years) |
| Washing and reverse handling cost | -0.6% | North America, Europe | Medium term (2-4 years) |
| Food-contact proof for PCR materials | -0.5% | USA, EU, Japan | Medium term (2-4 years) |
| Mixed consumer return behavior | -0.4% | Festivals and campuses | Long term (>= 4 years) |
Which countries are scaling the PCR Reusable Concession Cups Market through 2036?
- The country comparison spans 2.4 percentage points and forms two practical growth bands across the forecast period.
- China remains 0.5 percentage point above the USA through catering scale and scenic-area beverage service.
- The USA remains 0.2 percentage point above Germany through repeat events and managed leisure venues.
- Germany remains 0.5 percentage point above France as EU packaging rules sharpen reuse planning.
- France remains 1.2 percentage points above Japan through tourism footfall and festival beverage programs.
- Japan closes the displayed range through disciplined venue operations and compact beverage formats.
Comparable CAGRs create different entry conditions due to venue control, deposit value, washing access and national packaging rules. Full report coverage includes North America, Latin America, Western Europe, Eastern Europe, East Asia, South Asia & Pacific, and Middle East & Africa.
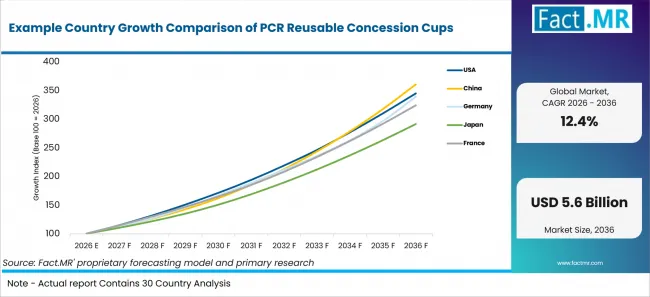
Example Country Growth Comparison Of Pcr Reusable Concession Cups | Source: Fact.MR
| Country | CAGR |
|---|---|
| China | 13.7% |
| USA | 13.2% |
| Germany | 13.0% |
| France | 12.5% |
| Japan | 11.3% |
How is China scaling demand?
13.7% CAGR through 2036, supported by catering revenue scale and scenic-area traffic.
China’s venue operators are expected to scale reusable cups around catering and tourism flows. The National Bureau of Statistics reported in February 2026 that catering industry income reached 5,798.2 billion yuan in 2025. China is projected to post 13.7% CAGR through 2036.
What supports USA adoption?
13.2% CAGR through 2036, driven by managed leisure venues and repeat-event beverage service.
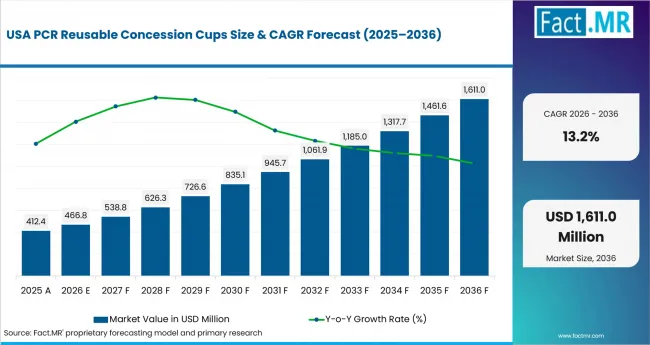
Pcr Reusable Concession Cups Country Value Analysis | Source: Fact.MR
U.S. adoption is expected to build around stadiums and venue groups that control guest exits. The National Park Service reported in March 2026 that 323,014,305 recreation visits were recorded in 2025 across 406 reporting parks. The USA is forecast to record 13.2% CAGR through 2036.
What underpins Germany’s growth?
13.0% CAGR through 2036, supported by packaging rules and organized event catering.
Germany’s event and foodservice operators are expected to evaluate reusable cups alongside recycling performance and packaging law. Umweltbundesamt reported in March 2026 that 69.4% of Germany’s packaging waste was recycled in 2023. Germany is anticipated to advance at 13.0% CAGR through 2036.
How is France developing demand?
12.5% CAGR through 2036, shaped by tourism flows and festival beverage programs.
France is expected to build demand around tourism, festivals and managed leisure sites. The Ministry of Economy reported in February 2026 that France welcomed 102 million international visitors in 2025. France is expected to post 12.5% CAGR through 2036.
How does Japan perform?
11.3% CAGR through 2036, led by travel spending and compact concession formats.
Japan’s concession operators are expected to favor compact reusable cups where space and service speed are tight. The Japan Tourism Agency reported in April 2026 that domestic travel expenditure reached 26.7845 trillion yen in 2025. Japan is estimated to record 11.3% CAGR through 2036.
Who leads the PCR Reusable Concession Cups Market?
Amcor, through the former Berry Global reusable-cup portfolio, and Greiner Packaging provide direct reusable-cup coverage, while Faerch provides adjacent evidence through circular PET cup collection and cup-to-cup recycling.
Amcor’s current packaging portfolio includes the former Berry Global reusable-cup range, with PP cups and lids designed for hot and cold beverages. In March 2025, before completion of the combination with Amcor, Berry Global reported that its reusable cups had been selected for Glasgow’s Borrow Cup returnable-cup initiative. Greiner Packaging offers PP reusable drinking cups for events and deployed a customized 0.4-liter reusable cup at the DEKRA Lausitzring in Germany during a major DTM event in 2025.
Faerch documents a circular PET cup system at Smukfest, where festival cups are collected and recycled into material for new cups rather than washed for direct reuse. Amcor completed its combination with Berry Global on April 30, 2025, and current Amcor product pages incorporate the former Berry reusable-cup portfolio and Superfos packaging brand.
Which companies are the key providers?
Key companies include Amcor (former Berry Global reusable-cup portfolio); Greiner Packaging; and Faerch.
- Amcor
- Greiner Packaging
- Faerch
Bibliography
- Amcor. (2025, April 30). Amcor completes combination with Berry Global; positioned to significantly enhance value for customers and shareholders.
- Berry Global. (2025a, January 22). New sip lids for Berry reusable cup range.
- Berry Global. (2025b, March 6). Berry’s reusable cups support returnable cup initiative.
- Directorate-General for Environment. (2026, August 11). New EU packaging rules start to apply, including restrictions on PFAS in food-contact packaging. European Commission.
- Greiner Packaging. (2025, June 17). Greiner’s reusable drinking cup drives change at major Motorsport Event in Germany.
- Ministère des Finances. (2026, February 19). Bilan touristique de l’année 2025 : Avec 102 millions de visiteurs, la France, pays le plus visité du monde, enregistre une nouvelle hausse massive de ses recettes touristiques (+9 %).
- National Bureau of Statistics of China. (2026, February 28). Statistical communiqué of the People’s Republic of China on the 2025 national economic and social development.
- National Park Service. (2026, March 13). Public interest in national parks remains strong as visits top 323 million in 2025. U.S. Department of the Interior.
- Umweltbundesamt. (2026, March 5). Verpackungsabfälle.
This Report Answers
- The report explains reusable concession cup demand across cup material and use model. It also covers capacity and end-use patterns.
- Segment analysis identifies PCR polypropylene, venue deposit-return, <300 mL cups and stadiums as the displayed 2026 share leaders.
- Country analysis examines China, the USA, Germany, France and Japan with venue-specific adoption mechanisms.
- Competitive analysis reviews Amcor’s former Berry reusable-cup portfolio and Greiner Packaging as directly evidenced reusable-cup providers, with Faerch treated as adjacent coverage.
- Application analysis assesses how deposit return, washing access, food-contact proof and cup tracking influence adoption.
What does the PCR Reusable Concession Cups Market cover?
PCR polypropylene, PCR blends, rPET/PET blends and reusable polymer cups used for concession beverage service.
The PCR Reusable Concession Cups Market covers reusable cups used in stadiums, festivals, cinemas, theme parks and controlled foodservice sites. It includes deposit-return, closed-loop concession, rental, souvenir and retail reusable models.
The market differs from general foodservice packaging because the cup must return, be washed or enter a controlled recycling loop. Disposable beverage cups belong to adjacent packaging coverage outside this article’s repeat-use boundary.
What is included in the scope?
Reusable concession cup systems used in managed beverage-service environments.
The scope includes PCR polypropylene cups, virgin/PCR PP blends, rPET/PET blends, bio-attributed PP and other reusable polymer cups used in stadiums, festivals, cinemas, theme parks and campus foodservice. It also includes deposit-return operations, event rental, closed-loop concession use and collectible cup programs.
What is excluded from the scope?
Disposable cups, household drinkware and non-concession tableware are outside the scope.
Disposable paper, foam and plastic cups sold as single-use items are outside the scope. Plates, bowls, trays and cutlery are covered only when tied to a cup return program. General retail drinkware also falls outside the scope when sold for household use. Adjacent circular packaging systems are used only for boundary context.
How Was the Analysis Built?
The analysis draws on 120+ sources, 35+ company portfolios, 25+ countries, and more than 20 industry interviews.
- Primary Research: Primary research includes discussions with packaging converters, foodservice distributors, venue managers, event caterers and circular-system specialists. These conversations examine cup loss, washing access, deposit values and supplier qualification needs.
- Desk Research: Desk research covers government statistics, regulatory publications, company releases, product portfolios, recycling data and foodservice evidence. The bibliography lists the principal public sources cited in this report.
- Market Sizing and Forecasting: Market estimates combine known values, venue beverage demand, material mix, cup capacity, deposit-return adoption and country drivers.
- Data Validation and Update Cycle: Findings are validated by comparing operator interviews with public data, company activity and portfolio mapping. Updates review product launches, reuse programs and venue adoption.
What is the report’s scope and coverage?
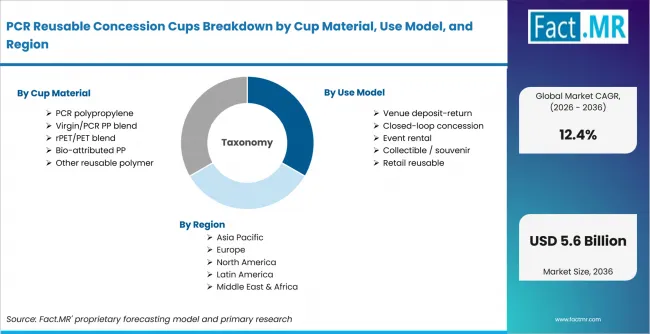
Pcr Reusable Concession Cups Breakdown By Cup Material, Use Model, And Region | Source: Fact.MR
| Attribute | Details |
|---|---|
| Quantitative Units | USD billion |
| Market Definition | Reusable concession cups made with PCR polypropylene, PCR blends, rPET/PET blends, bio-attributed PP and other reusable polymers for managed beverage service. |
| Cup Material | PCR polypropylene; Virgin/PCR PP blend; rPET/PET blend; Bio-attributed PP; Other reusable polymer |
| Use Model | Venue deposit-return; Closed-loop concession; Event rental; Collectible / souvenir; Retail reusable |
| Capacity | <300 mL; 300-400 mL; 401-500 mL; 501-700 mL; >700 mL |
| End-use | Stadiums; Festivals / events; Cinemas; Theme parks; Foodservice / campuses |
| Regions Covered | North America; Latin America; Western Europe; Eastern Europe; East Asia; South Asia & Pacific; Middle East & Africa |
| Countries Covered | China; USA; Germany; France; Japan |
| Key Companies Profiled | Amcor (former Berry Global reusable-cup portfolio); Greiner Packaging; Faerch |
| Forecast Period | 2026 to 2036 |
| Approach | Hybrid top-down and bottom-up approach using venue beverage service, cup material mix, use-model adoption, capacity split, country evidence and provider portfolio review. |
How is the market segmented?
-
By Cup Material
- PCR polypropylene
- Virgin/PCR PP blend
- rPET/PET blend
- Bio-attributed PP
- Other reusable polymer
-
By Use Model
- Venue deposit-return
- Closed-loop concession
- Event rental
- Collectible / souvenir
- Retail reusable
-
By Capacity
- <300 mL
- 300-400 mL
- 401-500 mL
- 501-700 mL
- >700 mL
-
By End-use
- Stadiums
- Festivals / events
- Cinemas
- Theme parks
- Foodservice / campuses
-
By Region
- North America
- Latin America
- Western Europe
- Eastern Europe
- East Asia
- South Asia & Pacific
- Middle East & Africa