- Market Value (2025): USD 770.5 Mn
- Estimated Value (2026): USD 940.0 Mn
- Forecast Value (2036): USD 6866.0 Mn
- CAGR (2026-2036): 22.0%
What is the Perishable Demand Tools Market forecast to be worth by 2036?
USD 940.0 million in 2026 to USD 6,866.0 million by 2036, at 22.0% CAGR.
- The perishable demand tools market crossed a valuation of USD 770.5 million in 2025.
- Demand is projected to increase from USD 940.0 million in 2026 to USD 6,866.0 million by 2036.
- The market is forecast to record a 22.0% CAGR from 2026 to 2036 as grocers, fresh processors and distributors use forecasting tools to protect short-shelf-life assortments.
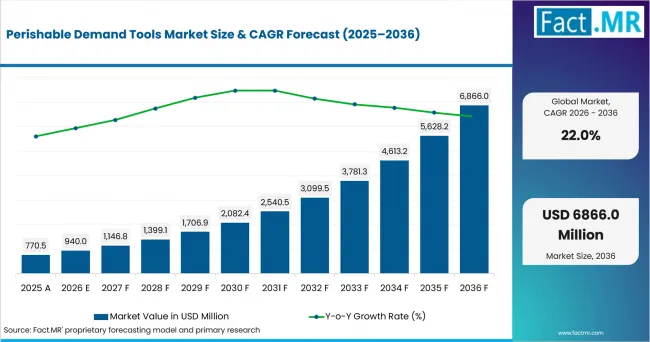
Perishable Demand Tools Market Value Analysis | Source: Fact.MR
What are the defining numbers behind Perishable Demand Tools Market growth?
USD 5,926.0 million absolute opportunity by 2036, led by software platforms, cloud deployment and forecasting capability.
- Demand Drivers in the Market
- Grocery replenishment teams need day-level forecasts because fresh items have narrow sales windows and small errors become shrink quickly.
- Fresh operations leaders need order recommendations that fit store labor routines, supplier cutoffs and short shelf-life handling rules.
- Category managers need promotion-aware planning so price moves and displays stay aligned with sell-through after the event.
- Distribution planners need store and DC visibility due to cold-chain calendars, delivery windows and daily freshness targets.
- Key Segments Analyzed
- By Offering: Software platform is projected to hold 44.0% share in 2026 owing to its role as the control layer for forecasts, orders and inventory actions.
- By Deployment: Cloud is anticipated to account for 49.0% share in 2026 because retailers need frequent model updates across store networks.
- By Capability: Forecasting is estimated to capture 46.0% share in 2026, supported by daily demand variance in produce, meat and prepared foods.
- By Customer: Large enterprise is forecast to represent 39.0% share in 2026 as chain retailers and food groups operate broader SKU and store estates.
- Analyst Opinion at Fact.MR
- Shambhu Nath Jha, Principal Consultant at Fact.MR, states, "Perishable planning is becoming a store-level operating discipline. Buyers are expected to favor tools that connect demand signals with ordering, production and waste controls. Stronger vendors should combine clean data, clear recommendations and fast workflow adoption."
- Strategic Implications
- Platform vendors should link sales history with store inventory and waste signals so operators see the reason behind each order recommendation.
- Grocery chains should include fresh managers in workflow design because adoption depends on trust at the department level.
- Foodservice distributors should pair forecasting with cutoff-driven route and pallet logic to protect service during daily replenishment cycles.
- Investors should test supplier claims against shrink reduction, availability, override rates and implementation speed in real store conditions.
The USA is projected to post 25.6% CAGR through 2036, led by food retail scale. The UK is anticipated to record 22.8% CAGR, supported by food spending and affordability pressure. Germany is forecast to advance at 19.1% CAGR due to fresh-produce scale. South Korea is expected to register 18.7% CAGR as K-food exports raise planning complexity. Japan is estimated to reach 18.3% CAGR, shaped by food-loss pressure.
How does the Perishable Demand Tools Market break down by segment?
Software platform leads Offering at 44.0%; Cloud leads Deployment at 49.0%.
Which Offering dominates?
Software platform holds 44.0% share in 2026.
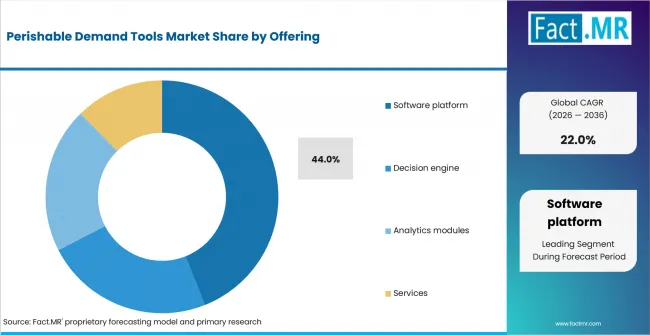
Perishable Demand Tools Market Analysis By Offering | Source: Fact.MR
Software platforms lead because perishable planning needs one operating layer for forecasts, orders and exception handling. USDA ERS reported inflation-adjusted food-at-home outlet sales of approximately USD 1.1 trillion in 2025, expressed in constant 2025 dollars.
What leads the Deployment segment?
Cloud accounts for 49.0% share in 2026.
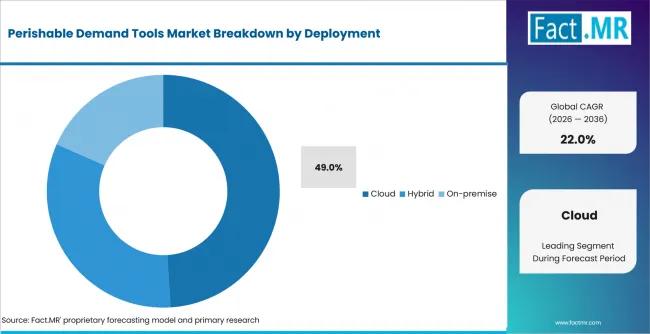
Perishable Demand Tools Market Analysis By Deployment | Source: Fact.MR
Cloud deployment leads as multi-store retailers need frequent model updates and consistent workflows across banners. It also reduces local infrastructure work when replenishment rules change by category or promotion cycle.
How does Capability shape demand?
Forecasting captures 46.0% share in 2026.
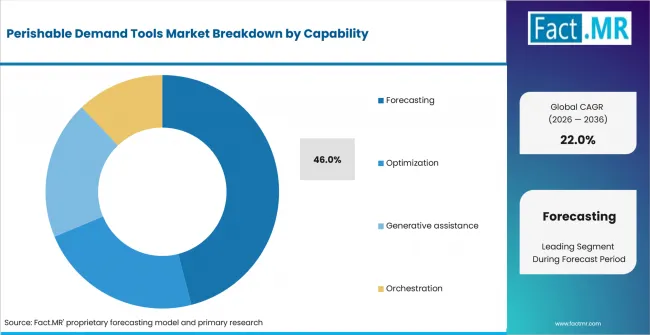
Perishable Demand Tools Market Analysis By Capability | Source: Fact.MR
Forecasting leads because each perishable order starts with a demand view affected by season, traffic and price action. o9 reported in March 2026 that its Hormel Foods program covered more than 70 dry and refrigerated sites.
What supports Large enterprise within Customer?
Large enterprise represents 39.0% share in 2026.
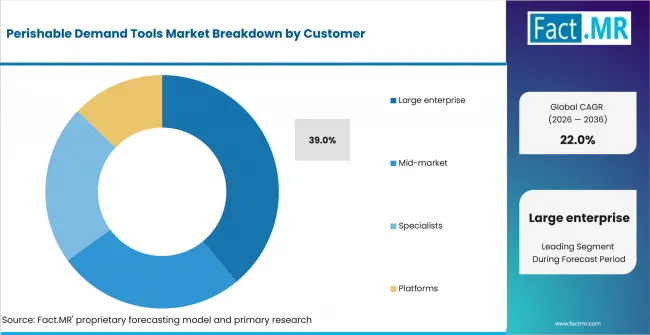
Perishable Demand Tools Market Analysis By Customer | Source: Fact.MR
Large enterprises lead because chain grocers and food manufacturers have enough stores and categories to justify dedicated tools. SAP SE reported in August 2025 that BRF runs 44 production units and 103 distribution centers.
What is accelerating Perishable Demand Tools Market adoption, and what is holding it back?
Demand is expected to rise as fresh retailers connect forecasting with replenishment and waste control. Growth is constrained by poor store data, integration work and daily habit change.
Drivers Impact Analysis
| DRIVER | (~) % IMPACT ON CAGR | GEOGRAPHIC RELEVANCE | IMPACT TIMELINE |
|---|---|---|---|
| Fresh shrink and shelf-availability economics | +2.4% | Global | Short term (<= 2 years) |
| Store-level order automation for fresh departments | +1.8% | North America, Western Europe | Short term (<= 2 years) |
| Cloud planning rollouts across grocery networks | +1.5% | Global | Medium term (2-4 years) |
| AI-assisted forecasting and replenishment workflows | +1.2% | North America, East Asia | Long term (>= 4 years) |
Source: Fact.MR analysis. Updated Aug 26, 2026
- Fresh shrink and shelf-availability economics: Perishable assortments lose value quickly when orders exceed likely sales. Forecast-linked ordering helps stores reduce waste without empty shelves.
- Store-level order automation: Fresh departments need recommendations that respect local inventory and labor. Afresh Technologies expanded its grocery AI platform in March 2026 to support ordering across every store department.
- Cloud planning rollouts: Cloud tools support frequent model changes across stores and warehouses. Retailers use them for central rules with local adjustment paths.
Opportunity Impact Analysis
| OPPORTUNITY | (~) % IMPACT ON CAGR | GEOGRAPHIC RELEVANCE | IMPACT TIMELINE |
|---|---|---|---|
| Ultra-fresh ordering for meat, seafood, bakery and prepared foods | +1.3% | North America, Europe | Medium term (2-4 years) |
| Managed deployments for mid-market grocers | +1.1% | Global | Medium term (2-4 years) |
| Generative assistance for planners and store teams | +0.9% | North America, East Asia | Long term (>= 4 years) |
Source: Fact.MR analysis. Updated Aug 26, 2026
- Ultra-fresh ordering: Meat, bakery and prepared foods require tighter production timing. Tools that combine demand forecasts with production guidance have a clearer budget path.
- Managed deployments for mid-market grocers: Smaller chains can adopt perishable planning when vendors simplify integrations and setup. Cloud delivery reduces internal data science needs.
- Generative assistance: Planner assistants explain forecast changes and order logic in plain language. Adoption depends on auditable actions aligned with store policy.
Restraints Impact Analysis
| RESTRAINT | (~) % IMPACT ON CAGR | GEOGRAPHIC RELEVANCE | IMPACT TIMELINE |
|---|---|---|---|
| Incomplete data for loose and variable-weight items | -0.8% | Global | Short term (<= 2 years) |
| Food-price sensitivity and margin pressure | -0.6% | North America, Europe | Medium term (2-4 years) |
| Change management for store associates | -0.5% | Global | Long term (>= 4 years) |
Source: Fact.MR analysis. Updated Aug 26, 2026
- Incomplete data for loose and variable-weight items: Produce and service-counter categories often lack clean item-level inventory. That raises implementation work.
- Food-price sensitivity and margin pressure: Operators facing meal-cost pressure need fast proof of savings. U.S. BLS reported food-away-from-home inflation of 3.4% for the year ending July 2026.
- Change management for store associates: Store teams may reject recommendations that ignore local judgment. Rollouts need training, feedback and visible results.
Which countries are scaling the Perishable Demand Tools Market through 2036?
- The country comparison spans 7.3 percentage points between the USA and Japan across the forecast period.
- The USA remains 2.8 percentage points above the UK as grocery scale and inflation-sensitive ordering raise the value of shrink control.
- The UK remains 3.7 percentage points above Germany through high household food spending and grocery affordability pressure.
- Germany remains 0.4 percentage point above South Korea as fresh produce volumes support store and processor planning use cases.
- South Korea remains 0.4 percentage point above Japan because export-facing food brands need better planning across short shelf-life categories.
Comparable CAGRs create different entry conditions due to food retail scale, fresh-category mix, export exposure, waste pressure and data readiness. Coverage includes North America, Latin America, Western Europe, Eastern Europe, East Asia, South Asia & Pacific, Middle East & Africa.
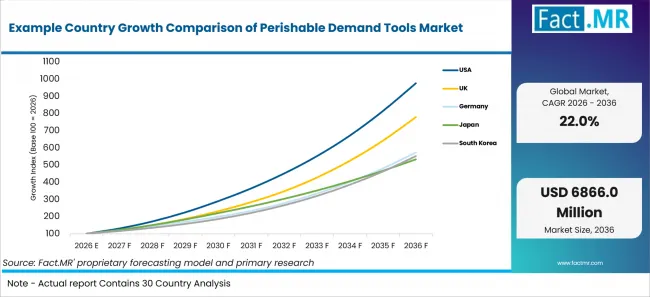
Example Country Growth Comparison Of Perishable Demand Tools Market | Source: Fact.MR
| Country | CAGR (2026-2036) |
|---|---|
| USA | 25.6% |
| UK | 22.8% |
| Germany | 19.1% |
| South Korea | 18.7% |
| Japan | 18.3% |
Source: Fact.MR analysis. Updated Aug 26, 2026
What supports USA adoption?
25.6% CAGR, led by food retail scale and shrink-control demand.
U.S. grocery operators evaluate perishable demand tools by how quickly they improve order accuracy and reduce waste in fresh departments. USDA ERS updated the Food Expenditure Series in June 2026 and placed inflation-adjusted total U.S. food spending at USD 2.51 trillion in 2025, expressed in constant 2025 dollars. The U.S. Census Bureau reported seasonally adjusted July 2026 retail and food services sales of USD 763.6 billion; the estimate is adjusted for holiday and trading-day differences but not for price changes. The U.S. Bureau of Labor Statistics reported 2.7% food-at-home inflation for the 12 months ending July 2026.
What supports the United Kingdom’s growth?
22.8% CAGR, supported by food spending and fresh availability pressure.
UK retailers are expected to use perishable demand tools where store ordering, online picking and chilled assortments compete for the same inventory. Defra reported in July 2026 that UK consumer expenditure on food and alcoholic drinks was GBP 303.3 billion in 2025 in real terms, measured at constant 2023 prices. ONS reported average weekly household expenditure of GBP 676.60 in the financial year ending 2025. The UK Food Security Digest 2025 reported that 91% of FSA Consumer Insights Tracker respondents in England, Wales and Northern Ireland were concerned about food prices in September 2025.
What supports Germany adoption?
19.1% CAGR, backed by produce scale and retail operating discipline.
Germany’s demand base is anchored in structured grocery formats and sizeable fresh-produce flows. Destatis reported on February 26, 2026 that Germany harvested 4.5 million tonnes of vegetables in 2025, up 8.1% from 2024. BMEL-Statistik, citing a first estimate by the Federal Information Centre for Agriculture, placed the 2025 production value of fruit, vegetables, flowers and ornamental plants, and nursery products at EUR 8.2 billion. Destatis reported on February 17, 2026 that German food prices were 2.1% higher year over year in January 2026.
How is South Korea scaling demand?
18.7% CAGR, driven by food output and export-facing planning complexity.
South Korea’s food brands and retailers are expected to use perishable demand tools to manage short-cycle production and fast merchandising changes. MFDS reported in May 2026 that Korea’s food-industry production reached about KRW 119 trillion in 2025, up 4.3% from the previous year, indicating a substantial domestic food-manufacturing base. MAFRA reported in January 2026 that K-Food+ exports reached USD 13.62 billion in 2025, up 5.1% year over year, highlighting the scale of Korea’s overseas agri-food and agro-industry markets. Korea’s official statistics also placed the 2025 Consumer Price Index at 116.61, up 2.1% from 2024, providing an important cost environment for food-industry planning.
How does Japan perform?
18.3% CAGR, shaped by food-loss pressure and household spending discipline.
Japan’s adoption path is tied to household grocery routines and strict waste-reduction expectations. The Statistics Bureau of Japan reported on February 6, 2026 that average monthly consumption expenditure for two-or-more-person households was JPY 314,001 in 2025. METI’s April 2026 commerce review placed 2025 retail sales at JPY 157.5 trillion, while MAFF reported in June 2026 that Japan’s food loss reached 4.61 million tonnes in fiscal 2024.
Who leads the Perishable Demand Tools Market?
RELEX Solutions is active through retail and supply chain planning tools that cover demand forecasting, replenishment and fresh store ordering. Its grocery planning work spans shelf availability, fresh execution and daily replenishment workflows.
Afresh Technologies competes through grocery-specific AI for store ordering, production planning, DC buying and supply-chain optimization. In April 2026, Afresh Technologies reported that its platform was live in more than 12,500 departments across 40 U.S. states.
Blue Yonder Group, Inc., o9 Solutions, Inc., ToolsGroup and SAP SE offer broader enterprise planning capabilities spanning demand planning, supply planning, inventory optimization and connected supply-chain workflows, providing alternatives where perishable-goods planning is integrated with wider enterprise operations.
Which companies are the key providers?
Key companies include RELEX Solutions, Afresh Technologies, Blue Yonder Group, Inc., o9 Solutions, Inc., ToolsGroup and SAP SE.
- RELEX Solutions
- Afresh Technologies
- Blue Yonder Group, Inc.
- o9 Solutions, Inc.
- ToolsGroup
- SAP SE
Bibliography
- Afresh. (2026, April 21). Afresh raises $34M to scale AI across the grocery industry — driving fresher food, stronger margins, and less waste.
- Afresh. (2026, March 17). Afresh expands AI platform to cover every item in stores.
- U.S. Bureau of Labor Statistics. (2026, August 12). Consumer Price Index—July 2026 [News release].
- Department for Environment, Food & Rural Affairs. (2026, July 29). Chapter 14: The food chain. In Agriculture in the United Kingdom 2025. GOV.UK.
- Department for Environment, Food & Rural Affairs. (2025, December 11). United Kingdom Food Security Digest 2025. GOV.UK.
- Statistisches Bundesamt. (2026, February 26). Gemüseernte erreicht 2025 neuen Höchststand [Vegetable harvest reaches a new high in 2025].
- Federal Statistical Office. (2026, February 17). Inflation rate at +2.1% in January 2026.
- Ministry of Agriculture, Food and Rural Affairs. (2026, January 20). Exports of K-Food Plus reached USD 13.6 billion in 2025, up 5.1% year-over-year.
- Ministry of Economy, Trade and Industry. (2026, May 29). Preliminary report on the Current Survey of Commerce: April 2026.
- Office for National Statistics. (2026, June 11). Family spending in the UK: April 2024 to March 2025.
- o9 Solutions. (2026, March 25). o9 goes live at Hormel Foods to modernize planning across the company’s global supply chain network.
- RELEX Solutions. (2025, December 18). RELEX Solutions acquires Ida to strengthen unified fresh store ordering capabilities.
- Statistics Bureau of Japan. (2026, February 6). 2025 yearly average. Family Income and Expenditure Survey.
- Ministry of Data and Statistics. (2025, December 31). Consumer Price Index in December 2025.
- ToolsGroup. (2025, December 2). ToolsGroup to debut the first inventory-aware demand shaping solution.
- U.S. Census Bureau. (2026, August 14). Advance monthly sales for retail and food services, July 2026.
- U.S. Department of Agriculture, Economic Research Service. (2026, August 17). Retailing & Wholesaling - Retail Trends.
This Report Addresses
- The report explains tool use across offering, deployment, capability and customer groups.
- Segment analysis identifies leading subsegments and retailer priorities.
- Country analysis examines listed markets and food-retail adoption mechanisms.
- Competitive analysis reviews providers across grocery AI and retail planning.
- Application analysis assesses shrink, availability, shelf life and ordering discipline.
What does the Perishable Demand Tools Market cover?
The Perishable Demand Tools Market covers software that improves forecasting, ordering, replenishment and inventory actions for short-shelf-life products. It includes grocery fresh departments, prepared foods, chilled products, foodservice distribution and food manufacturing.
The assessment covers cloud, hybrid and on-premise deployment across forecasting, optimization, generative assistance and orchestration. Demand is assessed across listed customer groups.
What is included in the scope?
The scope includes subscription software, fresh-ordering platforms, AI-enabled decision engines, analytics modules and services used to improve perishable demand decisions. Production planning tools are included when tied directly to store orders or short-cycle replenishment.
It includes tools used by grocery retailers, foodservice distributors, fresh-food producers, chilled-food manufacturers and retail technology teams. The focus stays on demand decisions for short-shelf-life categories and daily replenishment routines.
What is excluded from the scope?
Outside the scope are generic ERP modules sold apart from perishable forecasting, warehouse hardware, POS terminals, cold-chain equipment and general food retailing. Broad BI tools fall outside the scope when they sit apart from short-shelf-life ordering or replenishment.
Food waste services are excluded when they operate after disposal or donation decisions. General promotion planning is excluded unless it changes forecasts or orders for perishables.
How Was the Analysis Built?
The analysis draws on 120+ evidence inputs, 35+ company portfolios, 25+ countries and more than 20 industry interviews.
- Primary Research: Primary research includes discussions with grocery operators, food manufacturers, distributors, technology developers and fresh-category managers. These conversations examine buying priorities, adoption hurdles and performance measures.
- Desk Research: Desk research covers government statistics, company announcements, regulatory publications, trade data, technical material and public policy. The bibliography records the evidence base used in the analysis.
- Market Sizing and Forecasting: Estimates combine historical performance, demand indicators, segment shares, country growth, provider portfolios and barriers.
- Data Validation and Update Cycle: Findings are validated against public data, company activity, regulatory changes and industry developments. Updates review launches, partnerships, adoption shifts and planning performance evidence.
Segmentation
What is the report’s scope and coverage?
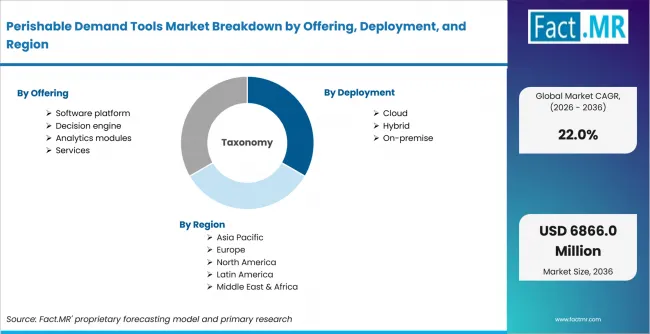
Perishable Demand Tools Market Breakdown By Offering, Deployment, And Region | Source: Fact.MR
| Attribute | Details |
|---|---|
| Quantitative Units | USD million |
| Market Definition | Software and decision tools used to forecast, order, replenish, produce and optimize inventory for short-shelf-life food and grocery categories. |
| Offering | Software platform; Decision engine; Analytics modules; Services |
| Deployment | Cloud; Hybrid; On-premise |
| Capability | Forecasting; Optimization; Generative assistance; Orchestration |
| Customer | Large enterprise; Mid-market; Specialists; Platforms |
| Regions Covered | North America; Latin America; Western Europe; Eastern Europe; East Asia; South Asia & Pacific; Middle East & Africa |
| Countries Covered | USA; UK; Germany; Japan; South Korea |
| Key Companies Profiled | RELEX Solutions; Afresh Technologies; Blue Yonder Group, Inc.; o9 Solutions, Inc.; ToolsGroup; SAP SE |
| Forecast Period | 2026 to 2036 |
| Approach | Hybrid top-down and bottom-up approach using retail food spending, fresh-category complexity, deployment mix, customer adoption, country demand indicators and provider portfolio review. |
Source: Fact.MR analysis. Updated Aug 26, 2026
How is the market segmented?
-
By Offering:
- Software platform
- Decision engine
- Analytics modules
- Services
-
By Deployment:
- Cloud
- Hybrid
- On-premise
-
By Capability:
- Forecasting
- Optimization
- Generative assistance
- Orchestration
-
By Customer:
- Large enterprise
- Mid-market
- Specialists
- Platforms
-
By Region:
- North America
- Latin America
- Western Europe
- Eastern Europe
- East Asia
- South Asia & Pacific
- Middle East & Africa
Frequently Asked Questions
How big is the perishable demand tools market in 2026?
What is the CAGR of the perishable demand tools market from 2026 to 2036?
Which offering leads the perishable demand tools market?
Which deployment leads the perishable demand tools market?
Who are the leading companies in the perishable demand tools market?
Who worked on this report


Preview the report firsthand - request a free sample
Free SampleGet the brochure for pricing and purchase details
Download PDF