- Market Value (2025): USD 856.6 Mn
- Estimated Value (2026): USD 980.0 Mn
- Forecast Value (2036): USD 3762.6 Mn
- CAGR (2026-2036): 14.4%
What is the Premix Traceability Services Market forecast to be worth by 2036?
USD 980.0 million in 2026 to USD 3762.6 million by 2036 at a 14.4% CAGR.
- The Premix Traceability Services Market crossed a valuation of USD 856.6 million in 2025.
- Demand is projected to increase from USD 980.0 million in 2026 to USD 3762.6 million by 2036.
- The market is forecast to record a 14.4% CAGR from 2026 to 2036 as premix manufacturers prioritize lot genealogy and compliance records.
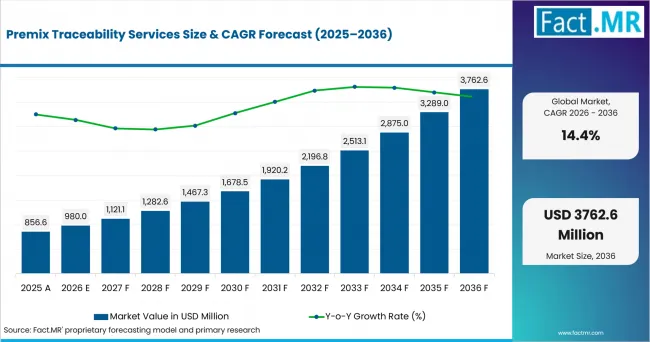
Premix Traceability Services Value Analysis | Source: Fact.MR
What are the defining numbers behind Premix Traceability Services Market growth?
USD 2,782.6 million absolute opportunity by 2036, led by batch genealogy software, feed premixes and SaaS delivery.
- Demand Drivers in the Market
- Premix manufacturers need lot-level genealogy so ingredient records can be traced from supplier intake to finished batch release.
- Quality teams need certificate and compliance management because premix recipes depend on supplier documents that vary by input.
- Feed producers need reliable batch history as animal nutrition blends move through mills, distributors and farms with tight recall windows.
- Testing providers need direct links between analytical results and batch records so quality teams can close release evidence before shipment.
- Food fortification brands need supplier traceability to match vitamin and mineral inputs with finished-product specifications and customer files.
- Key Segments Analyzed
- By Service Layer: Batch genealogy software is expected to hold 31.0% share in 2026 because it connects lot codes with formula and shipment records.
- By Premix Segment: Feed premixes are projected to account for 43.0% share in 2026 as feed mills manage ingredient variation and customer documentation needs.
- By Traceability Scope: Ingredient-to-batch is anticipated to capture 34.0% share in 2026 owing to its fit with intake and release workflows.
- By Delivery Model: SaaS is estimated to represent 39.0% share in 2026 since multi-site premix operations need shared supplier and customer records.
- Analyst Opinion at Fact.MR
- Shambhu Nath Jha, Principal Consultant at Fact.MR, states, “Premix traceability is becoming a documentation discipline that extends beyond a software purchase. The next phase is expected to reward providers that connect supplier files, batch records and verification data without slowing plant teams. Suppliers should combine lot genealogy, certificate controls and recall exports in one workflow.”
- Strategic Implications
- Service providers should make batch genealogy easy to connect with ERP and laboratory files.
- Premix manufacturers should standardize supplier document intake before adding customer-facing traceability portals.
- SaaS vendors should use tiered onboarding and implementation packages to address cost sensitivity among smaller blenders.
- Testing providers should connect analytical results with batch records so audit teams can close evidence gaps quickly.
The UK is expected to post 16.7% CAGR through 2036 as food manufacturing scale and import exposure raise the value of shared traceability records. France is projected to record 14.3% CAGR through food output and compliance discipline. The Netherlands is anticipated to advance at 13.4% CAGR owing to agricultural export flows. The USA is estimated to hold 13.0% CAGR as FSMA lot-level records shape food programs. Germany is forecast to reach 11.3% CAGR through EU rapid-alert discipline and food-chain record exchange.
How does the Premix Traceability Services Market break down by segment?
Batch genealogy software leads Service Layer at 31.0%; feed premixes lead Premix Segment at 43.0%.
Which Service Layer dominates?
Batch genealogy software is expected to hold 31.0% share in 2026.
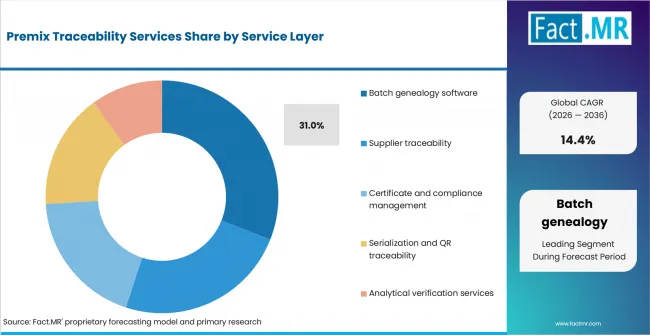
Premix Traceability Services Analysis By Service Layer | Source: Fact.MR
Batch genealogy software leads because premix producers need one record that links supplier lots, formula versions and finished batches. The value is clearest during recall scoping, where teams need to identify affected batches without searching separate spreadsheets and certificate folders.
FDA’s Food Traceability Rule requires covered entities to provide requested records within 24 hours, or within a reasonable time agreed to by FDA. FDA also states that Congress directed the agency not to enforce the rule before July 20, 2028. The requirement therefore supports longer-term traceability readiness and record-sharing planning.
What leads the Premix Segment?
Feed premixes are projected to account for 43.0% share in 2026.
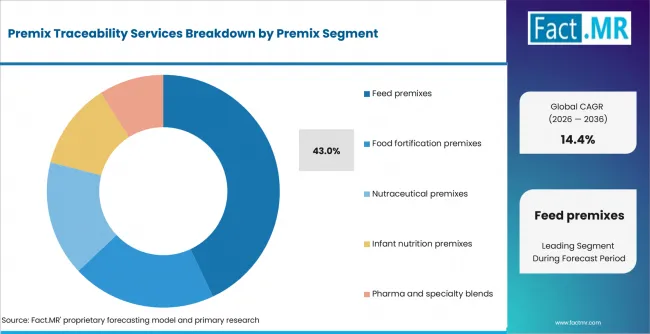
Premix Traceability Services Analysis By Premix Segment | Source: Fact.MR
Feed premixes lead because mills and nutrition blenders handle vitamins, minerals and additives that move into animal diets across many farms. Ingredient variation makes batch history useful for release checks, customer assurance and supplier reviews.
The segment fits digital traceability because feed customers often need proof of origin and formulation consistency. Food and supplement premixes use similar records, but feed operations usually carry higher batch volume and repeat shipments.
How does Traceability Scope shape demand?
Ingredient-to-batch is anticipated to capture 34.0% share in 2026.
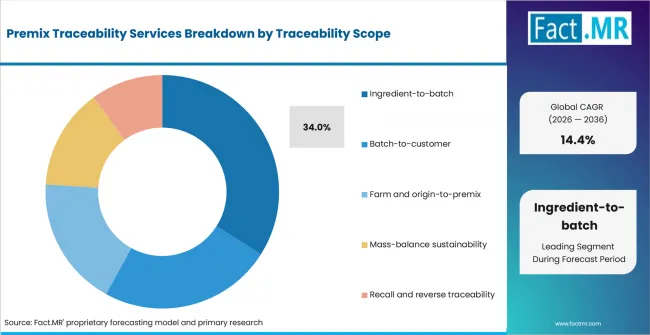
Premix Traceability Services Analysis By Traceability Scope | Source: Fact.MR
Ingredient-to-batch traceability is central because the service starts where risk usually enters the plant. Incoming materials need supplier identity, lot code, COA status and receiving record before production release.
After intake is clean, the service connects blending, release and customer shipment events. Teams can trace a vitamin, mineral or specialty input forward without treating every shipment as a separate investigation.
What supports SaaS within Delivery Model?
SaaS is estimated to represent 39.0% share in 2026.
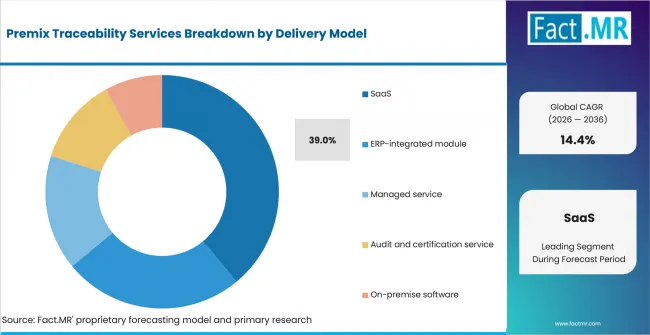
Premix Traceability Services Analysis By Delivery Model | Source: Fact.MR
SaaS leads the delivery model because premix traceability often involves suppliers, co-manufacturers, brand customers and testing partners. A shared platform lets users upload documents, review gaps and export records without relying on site-specific files.
Trustwell strengthened its FoodLogiQ platform in December 2025 with updates that improve the management of product, supplier and traceability data across Trustwell Connect. The release added richer product records, enhanced traceability event data and tighter integration with Genesis Foods, supporting demand for connected SaaS workflows that keep supplier, product and compliance information aligned.
What is accelerating Premix Traceability Services Market adoption, and what is holding it back?
Demand is expected to rise through lot-level compliance needs and customer audit pressure. Adoption is constrained by supplier data quality and integration cost.
Drivers Impact Analysis
| DRIVER | (~) % IMPACT ON CAGR | GEOGRAPHIC RELEVANCE | IMPACT TIMELINE |
|---|---|---|---|
| Lot-level genealogy for ingredient and batch records | +1.8% | Global | Short term (<= 2 years) |
| Supplier certificate and compliance workflows | +1.5% | North America, Europe | Medium term (2-4 years) |
| Customer audit files for feed and food fortification | +1.2% | Global | Medium term (2-4 years) |
| Recall readiness and reverse traceability exports | +0.9% | North America, Europe | Long term (>= 4 years) |
Source: Fact.MR analysis. Updated Sep 5, 2026
- Lot-level genealogy for ingredient and batch records: Premix plants need one history that links receiving, blending and shipment records. Genealogy tools reduce recall scoping time during customer or regulator requests.
- Supplier certificate and compliance workflows: COA files and origin records often arrive in varied formats. Services that normalize document intake help quality teams close gaps before release.
- Customer audit files for feed and food fortification: Brands and feed customers request proof of ingredient control. Premix suppliers can answer audits without rebuilding files each time.
Opportunity Impact Analysis
| OPPORTUNITY | (~) % IMPACT ON CAGR | GEOGRAPHIC RELEVANCE | IMPACT TIMELINE |
|---|---|---|---|
| SaaS traceability for mid-sized premix blenders | +1.3% | Global | Medium term (2-4 years) |
| Analytical verification linked to batch release | +1.0% | Europe, North America | Short term (<= 2 years) |
| Mass-balance and origin-to-premix records | +0.8% | Europe, Netherlands | Long term (>= 4 years) |
Source: Fact.MR analysis. Updated Sep 5, 2026
- SaaS traceability for mid-sized premix blenders: Cloud delivery reduces internal system maintenance and lets suppliers and customers work on the same record set.
- Analytical verification linked to batch release: Testing providers can connect lab results with traceability records so teams prove a supplier certificate matches a released batch.
- Mass-balance and origin-to-premix records: Sustainability claims require material-flow evidence across inputs and outputs. Traceability providers can extend beyond food-safety records into balance controls.
Restraints Impact Analysis
| RESTRAINT | (~) % IMPACT ON CAGR | GEOGRAPHIC RELEVANCE | IMPACT TIMELINE |
|---|---|---|---|
| Uneven supplier data formats | -0.7% | Global | Short term (<= 2 years) |
| ERP integration effort at older plants | -0.5% | Europe, North America | Medium term (2-4 years) |
| Cost sensitivity among smaller blenders | -0.4% | Global | Long term (>= 4 years) |
Source: Fact.MR analysis. Updated Sep 5, 2026
- Uneven supplier data formats: Inputs arrive with different certificate layouts and naming conventions. Projects slow when users must clean supplier data before batch mapping.
- ERP integration effort at older plants: Some sites run earlier systems built before event-level data exchange became standard. Integration work can delay rollout.
- Cost sensitivity among smaller blenders: Smaller operators balance traceability upgrades against testing, labor and ingredient costs. Practical tiers and simple onboarding widen adoption.
Which countries are scaling the Premix Traceability Services Market through 2036?
- The country comparison spans 5.36 percentage points and creates a clear growth band across Western Europe and North America.
- The UK stays 2.39 percentage points above France through food manufacturing scale and ingredient import exposure.
- France remains 0.83 percentage point above the Netherlands as food output and compliance oversight support traceability needs.
- The Netherlands stays 0.40 percentage point above the USA owing to cross-border agricultural trade and re-export flows.
- The USA remains 1.74 percentage points above Germany as FSMA traceability expectations increase attention to lot-level records.
- Germany closes the displayed range through EU food-safety alerts and food-chain record exchange.
Comparable country rates create different entry conditions due to food manufacturing scale, feed blending, import exposure and regulatory expectations. Coverage includes North America, Latin America, Western Europe, Eastern Europe, East Asia, South Asia & Pacific, Middle East & Africa.
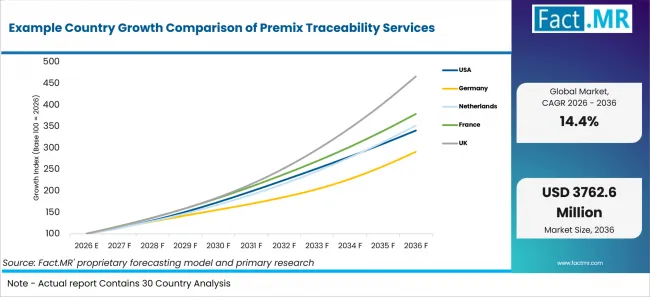
Example Country Growth Comparison Of Premix Traceability Services | Source: Fact.MR
| Country | CAGR (2026-2036) |
|---|---|
| United Kingdom | 16.7% |
| France | 14.3% |
| Netherlands | 13.4% |
| United States | 13.0% |
| Germany | 11.3% |
Source: Fact.MR analysis. Updated Sep 5, 2026
What supports the United Kingdom's adoption?
16.7% CAGR, supported by food manufacturing scale and cross-border ingredient flow.
The United Kingdom has a deep food manufacturing base for premix traceability services. ONS reported in July 2026 that food manufacturing represented 22.9% of total UK manufacturers' sales in 2025. That scale gives nutrition and fortification producers a practical reason to connect supplier files with batch release records. SaaS delivery is expected to fit sites that share evidence with retailers, testing partners and overseas ingredient providers.
How is France building demand?
14.3% CAGR, led by food manufacturing depth and official product oversight.
France is expected to build demand through food output and quality-document discipline. INSEE reported in July 2026 that food, beverage and tobacco manufacturing produced EUR 207 billion in value during 2025. That base creates a broad recordkeeping need for fortification, nutraceutical and specialty blend producers. Managed service models are expected to help companies that need traceability support without adding a full internal compliance team.
How is the Netherlands scaling demand?
13.4% CAGR, shaped by agricultural exports and cross-border traceability needs.
The Netherlands is anticipated to scale demand through its export and re-export role in food ingredients. Premix distributors and ingredient handlers therefore need records that connect supplier intake with customer shipment evidence. Mass-balance and origin-to-premix records suit trading flows where cocoa, dairy and cereal preparations move through several tiers.
What supports USA adoption?
13.0% CAGR, supported by FSMA traceability requirements and food-spending scale.
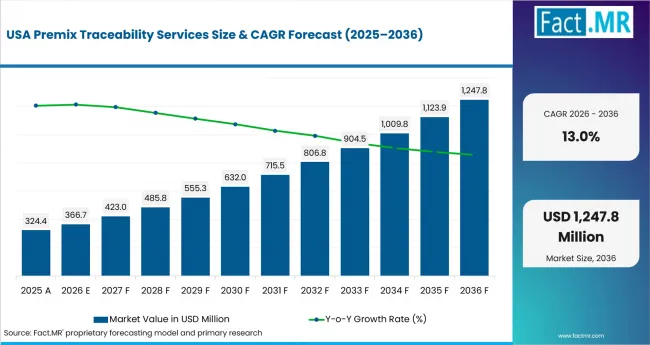
Premix Traceability Services Country Value Analysis | Source: Fact.MR
The USA is expected to sustain adoption through food-spending scale and traceability readiness. USDA ERS reported in June 2026 that total U.S. food spending reached USD 2.51 trillion in 2025. That downstream base raises expectations for traceable supplier files, COA records and lot histories. Multi-site manufacturers are expected to favor SaaS platforms that export consistent records across plants and customer programs.
How does Germany develop adoption?
11.3% CAGR, supported by EU rapid-alert discipline and food-chain record exchange.
Germany is forecast to develop adoption through food-safety alert workflows and strict quality expectations. Germany’s Federal Office of Consumer Protection and Food Safety (BVL) states that it serves as the national RASFF contact point and coordinates cross-border information exchange among competent authorities. Multi-ingredient production gives premix users a clear need for batch genealogy. ERP-integrated modules are expected to suit plants that prefer controlled links between production, quality and customer documents.
Who leads the Premix Traceability Services Market?
TraceGains is active through supplier compliance, document management and ingredient-network capabilities for food and beverage users. Its platform supports automated Certificate of Analysis processing and lot-level ingredient quality control, making the company relevant to premix workflows that require extensive supplier documentation and specification checks.
Trustwell operates FoodLogiQ within its broader food safety, supply-chain, traceability and product-data software suite. FoodLogiQ supports product, supplier and traceability data management across Trustwell Connect, aligning with premix operations that require consistent supplier and product records.
SGS participates through compliance services and digital traceability partnerships. SGS announced its partnership with ENSESO4Food in December 2024 and highlighted the collaboration again in April 2025. The partnership integrates ENSESO4Food’s TRAKKEY digital traceability platform into SGS compliance services supporting the U.S. FDA FSMA 204 traceability rule.
Mérieux NutriSciences provides food testing and analytical services relevant to raw-material and ingredient-quality verification. In September 2025, the company completed its global acquisition of Bureau Veritas’ food testing activities, expanding its network of specialized laboratories and technical expertise across 15 countries.
OPTEL Group is relevant through Optchain and its Intelligent Supply Chain traceability capabilities for food and beverage supply chains. The platform supports raw-material traceability, supply-chain and product-quality visibility, and more precise recall processes, aligning with end-to-end batch and ingredient traceability requirements.
Which companies are the key providers?
Key companies include .
- TraceGains
- Trustwell, including FoodLogiQ
- OPTEL Group
- Mérieux NutriSciences
- SGS
Bibliography
- Centraal Bureau voor de Statistiek. (2026, January 16). Value of agricultural exports up by over 8 percent in 2025.
- Institut national de la statistique et des études économiques. (2026, July 21). Indicateurs macroéconomiques de l’industrie manufacturière.
- Mérieux NutriSciences. (2025, September 3). Mérieux NutriSciences completes global acquisition of Bureau Veritas’ food testing business.
- Office for National Statistics. (2026, July 24). UK manufacturers’ sales by product: 2025.
- SGS. (2025, April 18). Enhancing food traceability through state-of-the-art digitalization.
- TraceGains. (2025, March 26). TraceGains introduces AI-powered solution to streamline COA processing.
- Trustwell. (2025, December 17). FoodLogiQ Q4 2025 release: Stronger foundations for product data, specifications, and traceability.
- Zeballos, E., & Sinclair, W. (2026, June 11). Total U.S. food spending reached $2.51 trillion in 2025. U.S. Department of Agriculture, Economic Research Service.
This Report Answers
- The report explains where premix traceability services are used across service layer and delivery model. It also covers premix segment and traceability scope.
- Segment analysis identifies the listed subsegments and the operational reasons premix manufacturers prioritize them.
- Country analysis examines the listed markets and the official food, feed and documentation forces supporting adoption.
- Competitive analysis reviews current providers across traceability software, compliance workflows, analytical verification and audit support.
- Application analysis assesses how lot genealogy, supplier certificates and recall records influence service selection.
What does the Premix Traceability Services Market cover?
The Premix Traceability Services Market covers workflows used to document ingredient origin, batch movement and finished-batch shipment. It includes lot genealogy, supplier traceability, certificate controls, QR or serialization records and analytical verification support.
Traceability service demand overlaps with feed premix demand when mills need repeatable ingredient records. Rapid food safety testing is adjacent because testing evidence often feeds batch-release files.
What is included in the scope?
The scope includes subscription traceability software, ERP-integrated modules, managed traceability services, audit support and analytical verification. It also includes tools that connect supplier intake records, COA files, lot codes, formula versions and shipment records.
Infant nutrition products are included where premix records support ingredient control and customer evidence. Dietary supplement formulations are included where brands need traceable vitamin and mineral inputs.
What is excluded from the scope?
The scope excludes general ERP software sold without traceability-specific functionality. It also excludes basic label printing, standalone testing and ingredient trading services outside batch or supplier evidence management.
Premix ingredients remain outside the market scope. Standalone barcode hardware is excluded unless bundled with workflows that document product movement, ingredient origin or shipment history.
How Was the Analysis Built?
The analysis draws on 120+ sources, 35+ company portfolios, 25+ countries, and more than 20 industry interviews.
- Primary Research: Primary research includes discussions with manufacturers, service providers, technology developers, distributors, end users, and subject-matter experts. These conversations examine purchasing priorities, product adoption, operational challenges, approval requirements, competitive positioning, and the factors that influence wider market acceptance.
- Desk Research: Desk research covers government statistics, regulatory publications, company filings, trade data, technical studies, industry associations, standards, public policy, and other authoritative sources. Every source used in the analysis is documented in the bibliography.
- Market Sizing and Forecasting: Market estimates combine historical performance, demand indicators, pricing and volume trends, segment shares, company participation, country-level growth, adoption patterns, investment activity, and barriers to market expansion.
- Data Validation and Update Cycle: Findings are validated by comparing primary interviews with public data, company activity, regulatory changes, trade patterns, and industry developments. Regular updates review new product launches, capacity changes, partnerships, approvals, and shifts in commercial adoption.
Segmentation
What is the report’s scope and coverage?
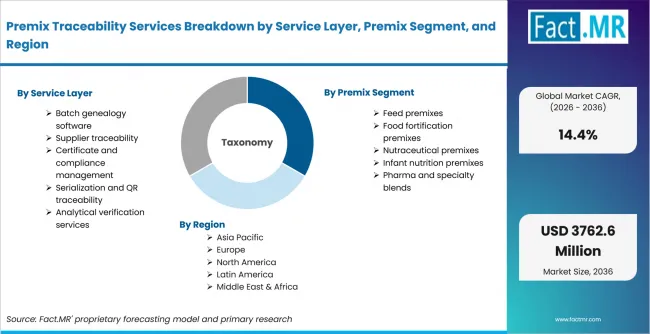
Premix Traceability Services Breakdown By Service Layer, Premix Segment, And Region | Source: Fact.MR
| Attribute | Details |
|---|---|
| Quantitative Units | USD million |
| Market Definition | Services and software that document premix ingredient origin, supplier certificates, lot genealogy, batch release evidence, customer shipment records and recall-ready traceability files. |
| Service Layer | Batch genealogy software; Supplier traceability; Certificate and compliance management; Serialization and QR traceability; Analytical verification services |
| Premix Segment | Feed premixes; Food fortification premixes; Nutraceutical premixes; Infant nutrition premixes; Pharma and specialty blends |
| Traceability Scope | Ingredient-to-batch; Batch-to-customer; Farm and origin-to-premix; Mass-balance sustainability; Recall and reverse traceability |
| Delivery Model | SaaS; ERP-integrated module; Managed service; Audit and certification service; On-premise software |
| Regions Covered | North America; Latin America; Western Europe; Eastern Europe; East Asia; South Asia & Pacific; Middle East & Africa |
| Countries Covered | United States; Germany; Netherlands; France; United Kingdom |
| Key Companies Profiled | TraceGains; Trustwell; FoodLogiQ; OPTEL Group; Mérieux NutriSciences; SGS |
| Forecast Period | 2026 to 2036 |
| Approach | Hybrid top-down and bottom-up approach using premix production workflows, service-layer adoption, traceability scope, delivery model, country evidence and provider portfolio review. |
Source: Fact.MR analysis. Updated Sep 5, 2026
How is the market segmented?
-
By Service Layer
- Batch genealogy software
- Supplier traceability
- Certificate and compliance management
- Serialization and QR traceability
- Analytical verification services
-
By Premix Segment
- Feed premixes
- Food fortification premixes
- Nutraceutical premixes
- Infant nutrition premixes
- Pharma and specialty blends
-
By Traceability Scope
- Ingredient-to-batch
- Batch-to-customer
- Farm and origin-to-premix
- Mass-balance sustainability
- Recall and reverse traceability
-
By Delivery Model
- SaaS
- ERP-integrated module
- Managed service
- Audit and certification service
- On-premise software
-
By Region
- North America
- Latin America
- Western Europe
- Eastern Europe
- East Asia
- South Asia & Pacific
- Middle East & Africa
Frequently Asked Questions
How big is the Premix Traceability Services Market in 2026?
What is the CAGR of the Premix Traceability Services Market from 2026 to 2036?
Which service layer leads the Premix Traceability Services Market?
Which premix segment leads the Premix Traceability Services Market?
Which companies are active in the Premix Traceability Services Market?
Who worked on this report


Preview the report firsthand - request a free sample
Free SampleGet the brochure for pricing and purchase details
Download PDF