- Market Value (2025): USD 253.9 Mn
- Estimated Value (2026): USD 325.0 Mn
- Forecast Value (2036): USD 3837.0 Mn
- CAGR (2026-2036): 28.0%
What is the Quantum Dot Resists Market forecast to be worth by 2036?
USD 325.0 million in 2026 to USD 3837.0 million by 2036 at a 28.0% CAGR.
- The quantum dot resists market reached USD 253.9 million in 2025.
- Demand is projected to increase from USD 325.0 million in 2026 to USD 3837.0 million by 2036.
- The market is forecast to record 28.0% CAGR from 2026 to 2036 as device makers test patternable quantum structures for sensing and imaging layers.
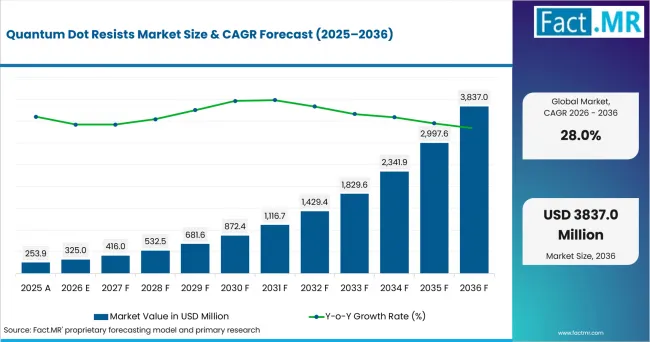
Quantum Dot Resists Market Value Analysis | Source: Fact.MR
What are the defining numbers behind Quantum Dot Resists Market growth?
An absolute opportunity of USD 3512.0 million is expected between 2026 and 2036.
- Demand Drivers in the Market
- Display and photonics engineers need coating chemistries that place quantum dots with controlled film thickness and stable emission across patterned layers.
- Semiconductor process teams need low-contamination resists as device designs combine optical sensing, imaging and packaging functions on smaller surfaces.
- Automotive sensor developers need stable quantum-dot layers for imaging modules that face heat, vibration and long qualification windows.
- Materials suppliers need binders and solvent systems that fit customer lines while reducing reliance on high-concern fluorinated chemistries.
- Key Segments Analyzed
- By Material System: Quantum dots are expected to hold 41.0% share in 2026 because their tunable optical and electronic properties support advanced resist formulations.
- By Process: Coating is projected to account for 44.0% share in 2026, owing to its fit with spin, slot and film-forming routes used by electronics materials teams.
- By Function: Sensing is anticipated to capture 38.0% share in 2026, supported by quantum-dot layers that convert optical signals into device-readable outputs.
- By Application: Automotive is estimated to represent 41.0% share in 2026, led by demand for compact imaging and sensor modules.
- Analyst Opinion at Fact.MR
- Shambhu Nath Jha, Principal Consultant at Fact.MR, states, “Quantum dot resists must behave like precision coatings and functional nanomaterials. Demand is expected to move first where teams prove clean pattern transfer and stable optical response on customer tools. Suppliers should combine particle chemistry, process support and contamination documentation.”
- Strategic Implications
- Formulation teams should document particle size control, solvent compatibility and residue behavior before customer sampling begins.
- Lithography chemical suppliers should build process notes that compare coating, deposition and patterning routes across customer tool sets.
- Device developers should define optical response, adhesion and reliability thresholds before moving quantum-dot resist trials into larger lots.
- Procurement teams should evaluate supplier continuity since specialty quantum-dot inputs can face narrow-source risks during scale-up.
Japan is forecast to record 35.1% CAGR through 2036, supported by semiconductor localization. South Korea is projected to post 32.4% CAGR as ICT exports reinforce materials qualification. Germany is anticipated to advance at 31.0% CAGR owing to electronics orders. The USA is estimated to hold 24.4% CAGR as chip investment increases lithography demand. The UK is forecast to reach 22.9% CAGR through semiconductor clusters.
How does the Quantum Dot Resists Market break down by segment?
Quantum dots lead Material System at 41.0%; coating leads Process at 44.0%.
How is the Material System defined?
Quantum dots are expected to hold 41.0% share in 2026.
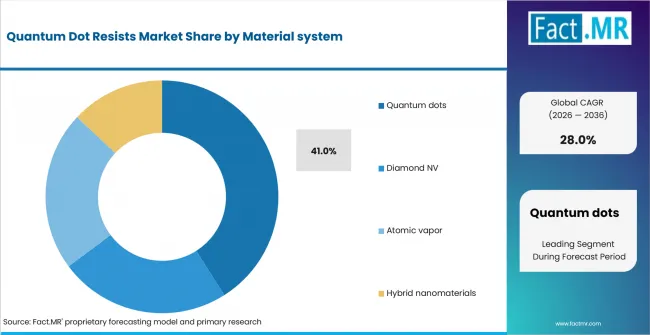
Quantum Dot Resists Market Analysis By Material System | Source: Fact.MR
Quantum dots lead the Material System category because their tunable optical properties, particle-scale control and compatibility with advanced formulations support resist-layer development. Formulators evaluate emission stability, dispersion quality and surface chemistry before qualification. Hybrid nanomaterials, diamond NV and atomic vapor systems address more specialized material requirements.
What leads the Process segment?
Coating is projected to account for 44.0% share in 2026.
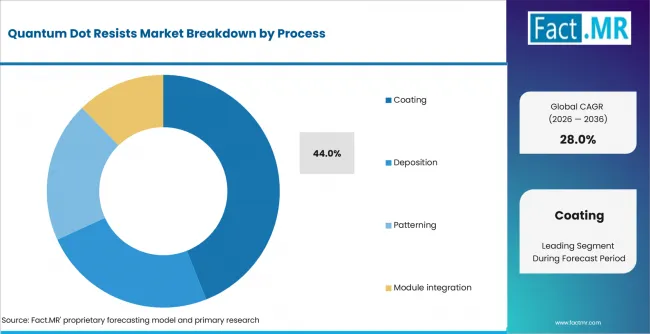
Quantum Dot Resists Market Analysis By Process | Source: Fact.MR
Coating leads because manufacturers typically evaluate quantum-dot resist performance in film form before full module integration. This process allows teams to assess layer uniformity, adhesion, optical response and compatibility with subsequent fabrication steps before moving formulations into larger-scale qualification and production workflows.
How does Function shape demand?
Sensing is anticipated to capture 38.0% share in 2026.
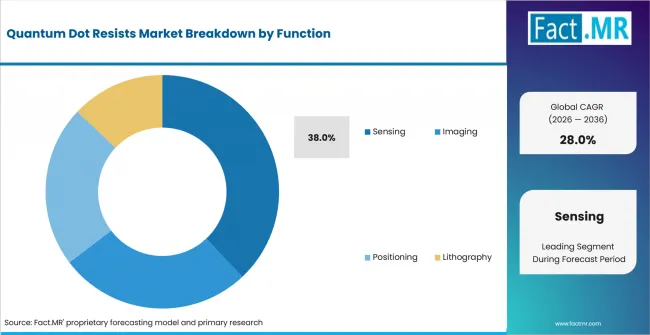
Quantum Dot Resists Market Analysis By Function | Source: Fact.MR
Sensing leads because quantum dots can convert optical changes into measurable signals within compact device structures. Automotive and industrial developers focus on maintaining stable response after coating, baking and environmental exposure, while also checking signal consistency, material compatibility and repeatability across production conditions.
What supports Automotive within Application?
Automotive is estimated to represent 41.0% share in 2026.
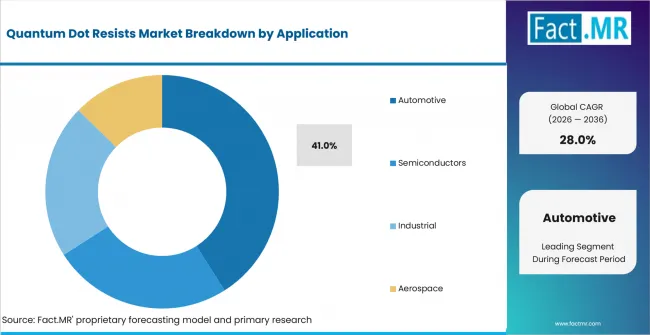
Quantum Dot Resists Market Analysis By Application | Source: Fact.MR
Automotive leads as cameras, cabin sensors and other optical systems require functional layers within tightly constrained package sizes. Suppliers must demonstrate reliable adhesion, temperature tolerance, optical stability and consistent coating performance before automotive engineering teams approve quantum-dot resist materials for production programs.
What is accelerating Quantum Dot Resists Market adoption, and what is holding it back?
Demand is expected to rise through coating control, automotive sensing qualification and semiconductor patterning needs. Adoption is constrained by formulation stability, long validation cycles and chemical review requirements.
Drivers Impact Analysis
| DRIVER | (~) % IMPACT ON CAGR | GEOGRAPHIC RELEVANCE | IMPACT TIMELINE |
|---|---|---|---|
| Micro-patterned quantum-dot coating demand | +3.2% | Global | Short term (<= 2 years) |
| Semiconductor patterning and advanced packaging needs | +2.5% | USA, Japan, South Korea | Medium term (2-4 years) |
| Automotive sensing and imaging qualification | +1.8% | Germany, Japan, South Korea | Medium term (2-4 years) |
| Lower-fluorine and fluorine-free formulation work | +1.1% | USA, UK, Germany | Long term (>= 4 years) |
- Micro-patterned quantum-dot coating demand: Device teams need films that keep emission behavior consistent after coating and pattern transfer.
- Automotive sensing and imaging qualification: Vehicle platforms require compact sensing layers that can withstand heat, vibration and repeated operating stress.
- Lower-fluorine and fluorine-free formulation work: Material developers are advancing photoresist systems designed to reduce fluorinated content while maintaining process compatibility and patterning performance.
Opportunity Impact Analysis
| OPPORTUNITY | (~) % IMPACT ON CAGR | GEOGRAPHIC RELEVANCE | IMPACT TIMELINE |
|---|---|---|---|
| PFAS-free or lower-risk resist systems | +1.4% | North America, Europe | Medium term (2-4 years) |
| Hybrid nanomaterials for integrated sensing | +1.2% | East Asia, North America | Long term (>= 4 years) |
| Localized support near fabs and module plants | +1.0% | Japan, South Korea, USA | Short term (<= 2 years) |
- PFAS-free or lower-risk resist systems: Material developers are exploring photoresist formulations that reduce reliance on PFAS while maintaining processing stability and patterning performance.
- Hybrid nanomaterials for integrated sensing: Device makers are expected to test quantum dots with other nanomaterial systems when a single layer must support both patterning and optical conversion.
- Localized support near fabs and module plants: Field support helps customers adjust bake, exposure and development conditions faster during qualification and production transfer.
Restraints Impact Analysis
| RESTRAINT | (~) % IMPACT ON CAGR | GEOGRAPHIC RELEVANCE | IMPACT TIMELINE |
|---|---|---|---|
| Long device qualification cycles | -0.9% | Global | Medium term (2-4 years) |
| Limited drop-in replacements for specialty surfactants | -0.7% | North America, Europe | Short term (<= 2 years) |
| Scale-up risk in quantum-dot dispersion and purity | -0.5% | East Asia, North America | Long term (>= 4 years) |
- Long device qualification cycles: Automotive and semiconductor customers require extensive reliability evidence before a new resist can enter production.
- Specialty surfactant qualification: Changing chemical requirements are encouraging formulators to evaluate lower-risk surfactants while maintaining resist stability and process performance.
- Scale-up risk in quantum-dot dispersion and purity: Nanoscale particles can agglomerate or leave residues when formulation conditions change, creating challenges for consistent large-scale production.
Which countries are scaling the Quantum Dot Resists Market through 2036?
- The country comparison spans 12.2 percentage points between Japan and the United Kingdom across the forecast period.
- Japan remains 2.7 percentage points above South Korea through domestic semiconductor programs and quantum-device qualification.
- South Korea remains 1.4 percentage points above Germany as ICT exports and equipment investment keep materials trials active.
- Germany remains 6.6 percentage points above the USA through electronics orders and semiconductor aid programs.
- The USA remains 1.5 percentage points above the UK as CHIPS-funded fabs widen customer access for lithography inputs.
- The UK closes the displayed range through semiconductor clusters and compound-electronics pilot activity.
Comparable CAGRs can create different entry conditions due to fab access, supplier depth, chemical regulation and automotive qualification. Full coverage includes North America, Latin America, Western Europe, Eastern Europe, East Asia, South Asia & Pacific, Middle East & Africa.
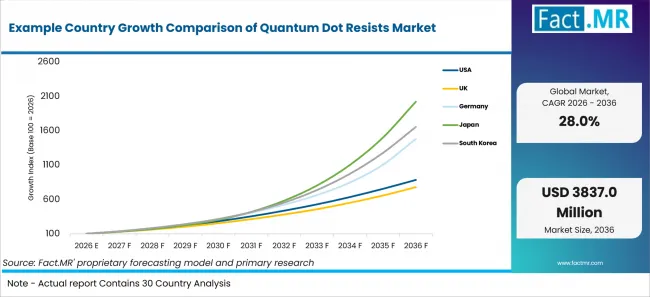
Example Country Growth Comparison Of Quantum Dot Resists Market | Source: Fact.MR
| Country | CAGR (2026-2036) |
|---|---|
| Japan | 35.1% |
| South Korea | 32.4% |
| Germany | 31.0% |
| USA | 24.4% |
| UK | 22.9% |
What supports Japan adoption?
35.1% CAGR, led by semiconductor materials localization and quantum-device qualification.
Japan combines domestic materials capability with policy-backed fab activity. The Cabinet Office reported in August 2026 that total machinery orders received by 280 manufacturers rose 11.3% in April-June 2026 from the previous quarter. Rapidus reported in February 2026 that IPA invested JPY 100.0 billion under METI jurisdiction.
How is South Korea scaling demand?
32.4% CAGR, supported by ICT exports and equipment investment.
South Korea links resist qualification to high-volume electronics and display production. MOTIR and MSIT reported in August 2026 that Korea’s ICT exports reached USD 53.36 billion in July 2026. Statistics Korea reported that equipment investment rose 7.9% month on month in July 2025.
What supports Germany’s growth?
31.0% CAGR, backed by electronics orders and semiconductor investment.
Germany’s growth path is tied to industrial electronics and state-backed semiconductor capacity. Destatis reported in August 2026 that real new orders in German manufacturing rose 3.1% month over month in June 2026, with orders for computer, electronic and optical products increasing 22.7%. On July 14, 2026, the European Commission approved EUR 659 million in German State aid for four new facilities in the semiconductor value chain.
How is the USA developing demand?
24.4% CAGR, supported by electronics orders and domestic semiconductor investment.
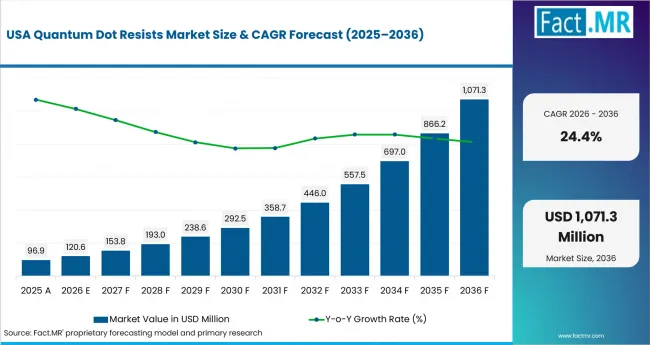
Quantum Dot Resists Market Country Value Analysis | Source: Fact.MR
The USA gives quantum dot resist suppliers access to research fabs, photonics developers and advanced packaging teams. The U.S. Census Bureau reported in July 2026 that computer and electronic product orders rose 3.1% to USD 31.1 billion in June 2026. NIST reported in January 2025 that CHIPS for America had awarded more than USD 33.0 billion, with announcements spanning 22 states.
What is shaping adoption in the United Kingdom?
22.9% CAGR, led by semiconductor clusters and specialty electronics activity.
The United Kingdom is centered on design-led semiconductors, compound electronics and pilot manufacturing. ONS reported in August 2026 that UK manufacturing of computer, electronic and optical products increased 3.0% in Quarter 2 2026. DSIT’s detailed Semiconductor Sector Study 2026 identifies 703 UK semiconductor companies, comprising 295 dedicated and 408 diversified companies.
Who leads the Quantum Dot Resists Market?
NanoPattern Technologies, Merck KGaA, Alfa Chemistry, Samsung SDI, Hansol Chemical are profiled for photoresist, semiconductor-material, quantum-dot or related electronic-material capabilities. The competitive review separates direct quantum-dot evidence from adjacent photoresist and semiconductor-material evidence.
On December 1, 2025, the company inaugurated its Semiconductor Solutions megasite in Kaohsiung, Taiwan, following a total investment of EUR 500 million; the site focuses on thin films, formulation materials and specialty gases for advanced semiconductor production.
Samsung SDI supplies semiconductor patterning and electronic materials, while Hansol Chemical participates through broader semiconductor and electronic-material capabilities.
Which companies are the key providers?
Key companies include Samsung SDI, Merck KGaA, NanoPattern Technologies, Alfa Chemistry, and Hansol Chemical.
- Samsung SDI
- Merck KGaA
- NanoPattern Technologies
- Alfa Chemistry
- Hansol Chemical
Bibliography
- U.S. Census Bureau. (2026, July 27). Monthly advance report on durable goods manufacturers' shipments inventories and orders.
- National Institute of Standards and Technology. (2025, January 17). U.S. Department of Commerce announces CHIPS incentives awards with Corning, Edwards Vacuum, and Infinera to increase domestic production capacity of chips and equipment critical for U.S. technological leadership.
- U.S. Environmental Protection Agency. (2025, January 3). EPA adds nine additional PFAS to the Toxics Release Inventory.
- Office for National Statistics. (2026, August 13). Index of Production, UK: June 2026.
- Department for Science, Innovation and Technology. (2026, June 8). Semiconductor Sector Study 2026. GOV.UK.
- Federal Statistical Office (Destatis). (2026, August 6). New orders in manufacturing in June 2026: +3.1% on the previous month.
- European Commission. (2026, July 14). Commission approves €659 million German State aid for four new semiconductor facilities.
- Economic and Social Research Institute. (2026, August 19). Machinery orders in June, 2026 and forecast for Jul.-Sep. 2026. Cabinet Office, Government of Japan.
- Ministry of Trade, Industry and Resources, & Ministry of Science and ICT. (2026, August 14). Korea’s ICT exports reach record $53.36 billion for July.
- Statistics Korea. (2025, August 29). Monthly industrial statistics, July 2025.
- Merck KGaA, Darmstadt, Germany. (2025, December 1). Merck KGaA, Darmstadt, Germany, inaugurates Semiconductor Solutions site in Taiwan to support AI growth.
This Report Answers
- The report explains where quantum dot resists are used across material system, process, function, application and region.
- Segment analysis identifies the leading subsegments and the operational reasons customers prioritize them.
- Country analysis examines the listed markets and the manufacturing or policy mechanisms supporting materials qualification.
- Competitive analysis reviews current providers across photoresists, lithography materials and quantum-dot inputs.
- Application analysis assesses how sensing, imaging and automotive qualification influence purchase decisions.
What does the Quantum Dot Resists Market cover?
The Quantum Dot Resists Market covers formulations that place quantum dots inside patternable layers for optical conversion, sensing and imaging. Quantum dot photoresists coverage helps frame resist tone, emission behavior and ready-to-coat supply forms.
The assessment reviews adjacent semiconductor process chemicals and photoresist ancillary chemicals where film quality, exposure response and contamination control affect qualification.
What is included in the scope?
The scope includes quantum-dot-based resist systems, quantum-dot-containing hybrid nanomaterial formulations and coating materials used for sensing, imaging and semiconductor-compatible layers. Upstream nano quantum dots and quantum dot materials remain relevant to particle stability and optical-response choices.
It includes coating, deposition, patterning and module integration for automotive, semiconductor, industrial and aerospace use. Quantum dot displays and quantum dot logic are considered when patterned optical layers enter device designs.
What is excluded from the scope?
Display-only components are outside this scope when they are sold as finished panels or films separated from resist chemistry. Electronic chemicals and materials are treated as adjacent only when they affect resist behavior.
Equipment-only categories such as dry resist coaters are outside this market when sold apart from resist chemistry. Quantum imaging devices are treated as end-market signals and device applications.
How Was the Analysis Built?
The analysis draws on 120+ sources, 35+ company portfolios, 25+ countries, and more than 20 industry interviews.
- Primary Research: Primary research includes discussions with manufacturers, service providers, technology developers, distributors, end users, procurement teams, and subject-matter experts. These conversations examine purchasing priorities, product adoption, operational challenges, approval requirements, competitive positioning, and the factors that influence wider market acceptance.
- Desk Research: Desk research covers government statistics, regulatory publications, company filings, trade data, technical studies, industry associations, standards, public policy, and other authoritative sources. Every source used in the analysis is documented in the bibliography.
- Market Sizing and Forecasting: Market estimates combine historical performance, demand indicators, pricing and volume trends, segment shares, company participation, country-level growth, adoption patterns, investment activity, and barriers to market expansion.
- Data Validation and Update Cycle: Findings are validated by comparing primary interviews with public data, company activity, regulatory changes, trade patterns, and industry developments. Regular updates review new product launches, capacity changes, partnerships, approvals, procurement trends, and shifts in commercial adoption.
What is the report’s scope and coverage?
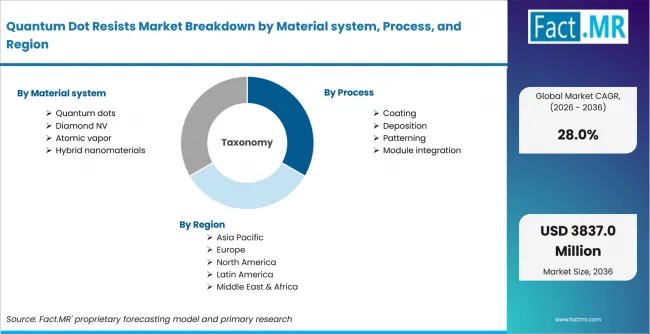
Quantum Dot Resists Market Breakdown By Material System, Process, And Region | Source: Fact.MR
| Attribute | Details |
|---|---|
| Quantitative Units | USD million |
| Market Definition | Formulations that place quantum dots or quantum-dot-containing hybrid nanomaterials in a patternable resist layer for optical conversion, sensing, imaging and semiconductor-compatible device structures. |
| Material System | Quantum-dot-based formulations; Hybrid quantum-dot/nanomaterial formulations |
| Process | Coating; Deposition; Patterning; Module integration |
| Function | Sensing; Imaging; Positioning |
| Application | Automotive; Semiconductors; Industrial; Aerospace |
| Regions Covered | North America; Latin America; Western Europe; Eastern Europe; East Asia; South Asia & Pacific; Middle East & Africa |
| Countries Covered | USA; UK; Germany; Japan; South Korea |
| Key Companies Profiled | Samsung SDI; Merck KGaA; NanoPattern Technologies; Alfa Chemistry; Hansol Chemical |
| Forecast Period | 2026 to 2036 |
| Approach | Hybrid top-down and bottom-up approach using historical values, process and application shares, country CAGRs, customer qualification behavior, official manufacturing indicators, normalized material-system taxonomy and provider portfolio review. |
How is the market segmented?
-
By Material System:
- Quantum dots
- Diamond NV
- Atomic vapor
- Hybrid nanomaterials
- Quantum dots
-
By Process:
- Coating
- Deposition
- Patterning
- Module integration
-
By Function:
- Sensing
- Imaging
- Positioning
- Lithography
- Sensing
-
By Application:
- Automotive
- Semiconductors
- Industrial
- Aerospace
- Automotive
-
By Region:
- North America
- Latin America
- Western Europe
- Eastern Europe
- East Asia
- South Asia and Pacific
- Middle East & Africa

