- Market Value (2025): USD 220.5 Mn
- Estimated Value (2026): USD 280 Mn
- Forecast Value (2036): USD 3056 Mn
- CAGR (2026-2036): 27.0%
What is the Quantum Dot Photoresists Market forecast to be worth by 2036?
USD 280 million in 2026 to USD 3,056 million by 2036 at a 27.0% CAGR.
- The quantum dot photoresists market reached USD 220.5 million in 2025.
- Demand is projected to increase from USD 280 million in 2026 to USD 3,056 million by 2036.
- The market is forecast to record 27.0% CAGR from 2026 to 2036 as display makers and electronic-material suppliers qualify patterned quantum dot conversion layers.
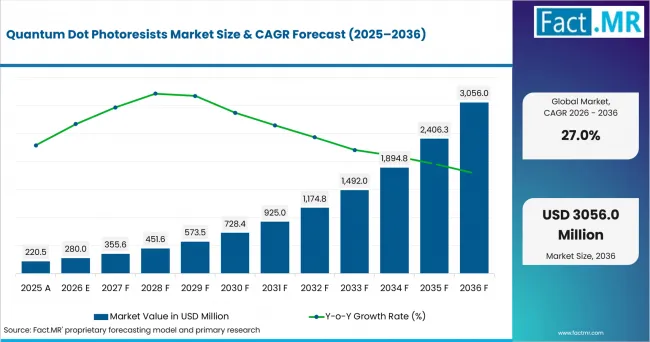
Quantum Dot Photoresists Market Value Analysis | Source: Fact.MR
What are the defining numbers behind Quantum Dot Photoresists Market growth?
An absolute opportunity of USD 2,776 million is expected between 2026 and 2036.
- Demand Drivers in the Market
- Panel process engineers need resists that hold quantum dots in defined pixel areas so color conversion stays stable after coating and development.
- Samsung Display said in May 2025 that its latest EL-QD prototypes included a non-cadmium 400-nit high-brightness version and a separate 264 PPI high-resolution version.
- Materials teams need formulation routes that support advanced packaging research. NIST reported in January 2025 that USD 300 million of CHIPS NAPMP awards covered advanced substrates and material research.
- Photolithography teams need negative-tone options that retain exposed pixel areas while keeping the quantum dot loading high enough for color conversion.
- Research photonics groups need small-batch formulations because prototype devices require tunable red, green and blue emission before panel designs are fixed.
- Key Segments Analyzed
- By Quantum Dot: CdSe-based is expected to hold 44.0% share in 2026 due to established red and green emission performance in display conversion work.
- By Display: QD-OLED conversion is projected to account for 38.0% share in 2026 as blue-emitting panels need patterned color conversion layers.
- By Resist Tone: Negative tone is anticipated to capture 42.0% share in 2026 owing to its fit with retained pixel areas after exposure.
- By Emission: Red is estimated to represent 41.0% share in 2026 because red conversion remains central to high-color-gamut display stacks.
- By Supply Form: Ready-to-coat resist is forecast to hold 40.0% share in 2026 since development teams want fewer mixing steps before coating trials.
- Analyst Opinion at Fact.MR
- Shambhu Nath Jha, Principal Consultant at Fact.MR, states, “Quantum dot photoresists are drawing attention because display makers want color conversion that is patterned at the pixel level. Adoption is expected to move first where brightness, pixel pitch and process repeatability are measured in the same qualification program. Suppliers should combine tuned QD chemistry, resin compatibility and coating support so customers do not solve formulation problems alone.”
- Strategic Implications
- QD material suppliers should publish emission stability and cadmium-control data in formats that display customers can use during qualification.
- Photoresist formulators should test viscosity and film thickness against inkjet and spin-coating methods used in panel prototyping.
- Patterning suppliers should track adjacent lithography developments. JSR/Inpria and Lam Research entered a non-exclusive cross-licensing and collaboration agreement in September 2025 covering leading-edge semiconductor patterning, including dry resist technology for EUV lithography and next-generation materials.
- Distribution partners should support ready-to-coat packaging because smaller photonics labs lack full in-house formulation capability.
South Korea is projected to post 31.9% CAGR through 2036 driven by QD-OLED development. Germany is expected to record 31.5% CAGR due to materials know-how. The USA is anticipated to reach 30.7% CAGR owing to advanced-packaging research and display-material qualification. The UK is estimated to hold 23.6% CAGR as semiconductor design and photonics clusters support small-batch use. Japan is forecast to reach 21.8% CAGR supported by photoresist depth and coater-developer strength.
How does the Quantum Dot Photoresists Market break down by segment?
CdSe-based leads Quantum Dot at 44.0% share; QD-OLED conversion leads Display at 38.0% share.
Which Quantum Dot dominates?
CdSe-based is expected to hold 44.0% share in 2026.
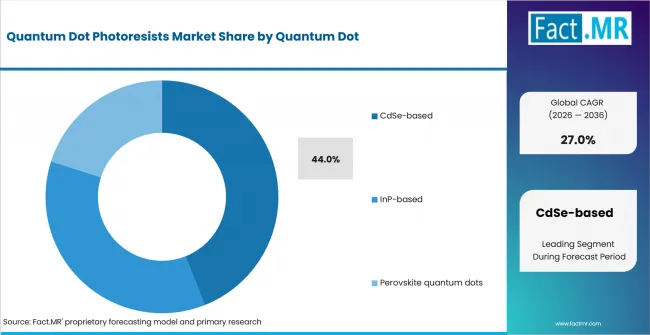
Quantum Dot Photoresists Market Analysis By Quantum Dot | Source: Fact.MR
CdSe-based resists lead because cadmium selenide dots are well understood in high-purity color-conversion work. The material suits red and green emission control when formulators need strong color output from a thin layer. InP-based options remain relevant where cadmium restrictions shape customer policy.
What leads the Display segment?
QD-OLED conversion is projected to account for 38.0% share in 2026.
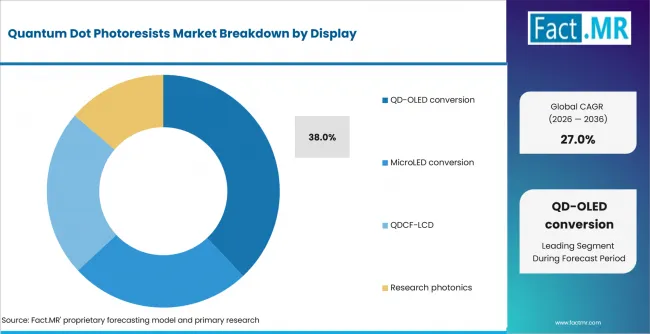
Quantum Dot Photoresists Market Analysis By Display | Source: Fact.MR
QD-OLED conversion leads as blue-emitting OLED panels need patterned red and green conversion layers. Photoresist chemistry helps place quantum dots only where each subpixel requires color conversion. MicroLED conversion creates a related route but demands tighter placement and repair tolerance.
How does Resist Tone shape demand?
Negative tone is anticipated to capture 42.0% share in 2026.
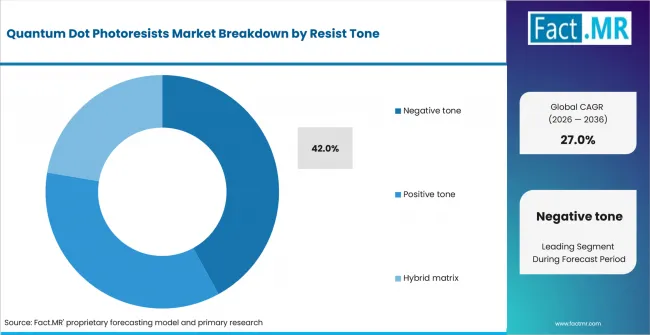
Quantum Dot Photoresists Market Analysis By Resist Tone | Source: Fact.MR
Negative tone leads because exposed areas remain after development, which fits color-conversion pixels that must stay in place. Positive tone resists support workflows where removed areas define openings. Hybrid matrix systems appeal to teams that need a compromise between pattern fidelity and quantum dot loading.
What supports Red within Emission?
Red is estimated to represent 41.0% share in 2026.
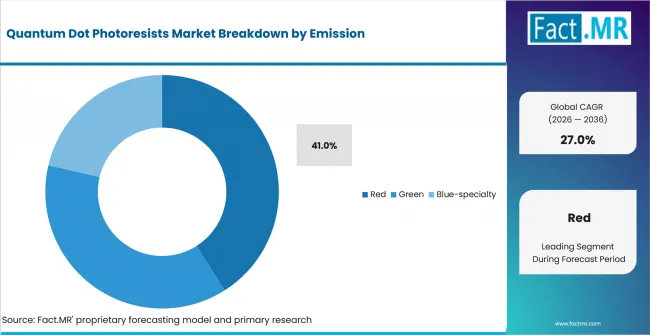
Quantum Dot Photoresists Market Analysis By Emission | Source: Fact.MR
Red emission leads because red subpixels often need strong conversion efficiency to support wide color gamut targets. Green formulations remain close in practical use for QD-OLED and QDCF-LCD stacks. Blue-specialty resists are more selective because blue emission often comes from the device source itself.
What leads the Supply Form segment?
Ready-to-coat resist is forecast to hold 40.0% share in 2026.
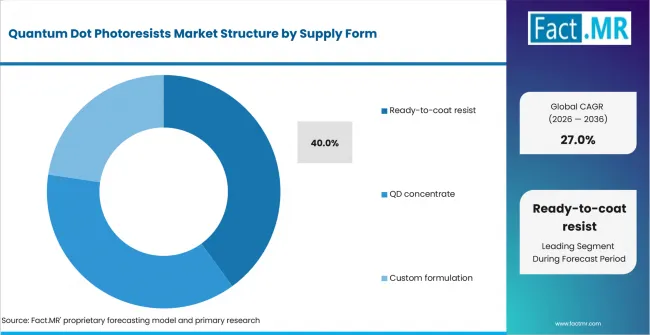
Quantum Dot Photoresists Market Analysis By Supply Form | Source: Fact.MR
Ready-to-coat resist leads as display labs want reproducible coating behavior without rebuilding each formulation. QD concentrate gives experienced formulators more control over solvent and resin balance. Custom formulation remains valuable for panel makers that need a narrow emission target.
What is accelerating Quantum Dot Photoresists Market adoption, and what is holding it back?
Patterned color conversion drives it; toxicity and qualification risk restrain it.
| Driver | (~) % Impact on CAGR | Geographic Relevance | Impact Timeline |
|---|---|---|---|
| QD-OLED color conversion requirements | +2.4% | South Korea, Japan, USA | Short term (<= 2 years) |
| MicroLED pixel-level patterning | +1.8% | USA, Germany, Japan | Medium term (2-4 years) |
| Advanced display research funding | +1.3% | USA, UK, Germany | Medium term (2-4 years) |
| Ready-to-coat material supply | +1.0% | Global | Long term (>= 4 years) |
Source: Fact.MR analysis. Updated Aug 24, 2026
- QD-OLED color conversion requirements: Blue-emitting OLED stacks need patterned red and green conversion layers. Quantum dot photoresists address that need by combining emission material and lithographic placement.
- MicroLED pixel-level patterning: MicroLED conversion needs color material placed on tiny pixel areas. Resists help define those areas without shifting the whole display architecture. Adoption is projected to rise where repair yield and pixel uniformity move into the same development plan.
- Advanced materials research funding: The U.S. Department of Commerce finalized USD 1.4 billion in CHIPS advanced-packaging awards in January 2025, including USD 300 million for advanced substrates and material research and USD 1.1 billion for an advanced-packaging piloting facility.
- Ready-to-coat material supply: Panel developers prefer repeatable materials when the process window is narrow. Ready-to-coat resist helps teams compare exposure, bake and development behavior across trials. The format is expected to gain share where smaller teams lack full formulation capacity.
| Opportunity | (~) % Impact on CAGR | Geographic Relevance | Impact Timeline |
|---|---|---|---|
| Cadmium-free QD resist development | +1.2% | Europe, Japan, South Korea | Medium term (2-4 years) |
| Research photonics prototypes | +0.9% | UK, USA, Germany | Short term (<= 2 years) |
| Panel-material co-development | +0.8% | South Korea, Japan | Long term (>= 4 years) |
| Custom emission tuning | +0.6% | Global | Medium term (2-4 years) |
Source: Fact.MR analysis. Updated Aug 24, 2026
- Cadmium-free QD resist development: InP-based and other cadmium-free chemistries create a route into customers that apply strict hazardous-substance reviews. Performance gaps remain, yet qualification pressure keeps these options active. Suppliers that document safety and emission tradeoffs are expected to improve customer access.
- Research photonics prototypes: University and specialist labs use small volumes of tuned material for detectors, emitters and experimental displays. The UK government’s 2026 semiconductor study identifies 705 UK semiconductor companies.
- Custom emission tuning: Custom formulations remain useful when a device needs a narrow red, green or blue coordinate. The route is slower than ready-to-coat supply but gives technical teams more control. It is anticipated to support premium projects that need documented optical performance.
| Restraint | (~) % Impact on CAGR | Geographic Relevance | Impact Timeline |
|---|---|---|---|
| Cadmium and toxic-material review | -0.8% | Europe, Japan, South Korea | Short term (<= 2 years) |
| Long qualification cycles | -0.6% | Global | Medium term (2-4 years) |
| Stability under processing | -0.5% | South Korea, Japan, USA | Medium term (2-4 years) |
| Limited mass-production display routes | -0.4% | UK, Germany, USA | Long term (>= 4 years) |
Source: Fact.MR analysis. Updated Aug 24, 2026
- Cadmium and toxic-material review: CdSe-based dots carry performance advantages but require careful customer review. European and Japanese customers often compare them with InP-based alternatives during the same project. Adoption slows when the material team must prove both emission performance and compliance fit.
- Stability under processing: Quantum dots can lose performance when solvent, heat or exposure conditions are poorly matched. Formulators therefore need matrix systems that protect emission while allowing clean patterning. The need for stability data raises development cost for smaller suppliers.
- Limited mass-production display routes: Many countries have semiconductor or photonics strength without large QD display capacity. That limits near-term volume even when research demand is active. Material suppliers are expected to prioritize accounts with clear panel roadmaps.
Which countries are scaling Quantum Dot Photoresists Market fastest?
- The country comparison spans 10.1 percentage points across three growth bands.
- South Korea remains 0.4 percentage point above Germany through QD-OLED development and electronics export depth.
- Germany remains 0.8 percentage point above the USA through specialty-material capability and semiconductor investment.
- Japan closes the displayed range through photoresist strength and coater-developer supply depth.
Comparable CAGRs create different entry conditions because QD photoresists depend on panel roadmaps, materials qualification, toxic-material review and local formulation support. Full report coverage includes North America, Latin America, Western Europe, Eastern Europe, East Asia, South Asia & Pacific, and Middle East & Africa.
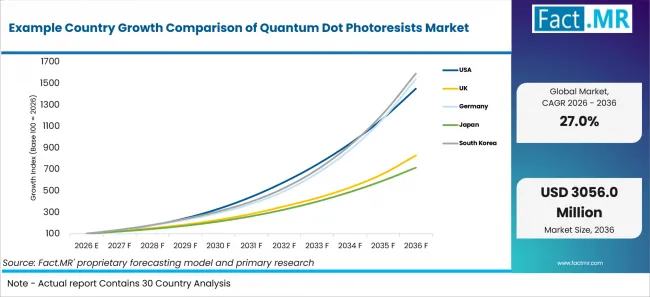
Example Country Growth Comparison Of Quantum Dot Photoresists Market | Source: Fact.MR
| Country | CAGR |
|---|---|
| South Korea | 31.9% |
| Germany | 31.5% |
| USA | 30.7% |
| UK | 23.6% |
| Japan | 21.8% |
Source: Fact.MR analysis. Updated Aug 24, 2026
What supports South Korea adoption?
31.9% CAGR, supported by QD-OLED development and electronics exports.
South Korea’s growth is supported by a large electronics manufacturing base and continued quantum-dot display development. MOTIR and MSIT reported that Korea’s ICT exports reached USD 264.3 billion in 2025, while semiconductor exports increased 22.1% and display exports declined 9.5%. Samsung Display also unveiled 400-nit and 264 PPI EL-QD prototypes in May 2025.
What is supporting Germany’s outlook?
31.5% CAGR, backed by materials capability and chip-factory investment.
Germany’s growth is supported by semiconductor investment and access to advanced materials expertise. The European Commission approved EUR 623 million in German State aid in December 2025 for semiconductor factories in Dresden and Erfurt. Merck also inaugurated a EUR 500 million Semiconductor Solutions megasite in Taiwan in December 2025 focused especially on thin-film materials.
How is the USA scaling demand?
30.7% CAGR, driven by advanced-packaging research and display-material qualification.
The USA’s growth is supported by advanced-packaging investment and continued lithography research. NIST reported USD 1.4 billion in finalized CHIPS advanced-packaging awards in January 2025, while JSR/Inpria and Lam Research announced a September 2025 agreement covering next-generation semiconductor patterning. These activities create a favorable environment for new photoresist and patterning materials requiring qualification across advanced manufacturing processes.
What supports the UK outlook?
23.6% CAGR, supported by photonics clusters and semiconductor design activity.
The UK’s growth reflects a specialized semiconductor and photonics ecosystem. DSIT’s Semiconductor Sector Study 2026 identified 705 UK semiconductor companies, with dedicated companies generating an estimated GBP 10.6 billion in revenue and employing about 16,350 people in 2025. This base supports material development, device design and pilot-scale qualification where quantum-dot photoresists could be evaluated.
How does Japan perform?
21.8% CAGR, led by photoresist strength and display-material expertise.
Japan’s growth is supported by its established semiconductor-material and lithography equipment position. The U.S. International Trade Administration estimated Japan’s semiconductor market at USD 51.886 billion in 2025 and, citing Brookings research, reported almost 88% global share in semiconductor coater/developers and 50% in photoresists. This materials and process-equipment depth supports qualification of advanced photoresist systems for display and semiconductor applications.
Who leads the Quantum Dot Photoresists Market?
Companies profiled for direct or adjacent material capability include Samsung SDI, Merck KGaA, and Shoei Chemical Inc. (Nanosys). Official sources confirm quantum-dot, display-material or photoresist capabilities.
Samsung SDI and Merck KGaA are closest to the qualification path for display and semiconductor materials. Merck’s December 2025 Taiwan megasite expanded capacity for advanced semiconductor materials, including thin films, formulation materials and specialty gases, while positioning production close to major customers in a strategically important semiconductor ecosystem. JSR/Inpria’s September 2025 agreement with Lam Research supports next-generation semiconductor patterning, including EUV dry resist, metal-oxide resist and advanced materials development.
Shoei Chemical Inc. (Nanosys), and Alfa Chemistry complete the supplier set through quantum dot materials, display chemistry and research-grade resist access. Competition is expected to center on emission stability, cadmium-control documentation and coating support. Suppliers that help customers solve dispersion and pattern fidelity problems should hold stronger account positions.
Which companies are the key providers?
Key companies include Samsung SDI, Merck KGaA, Shoei Chemical Inc. (Nanosys), Alfa Chemistry.
- Samsung SDI
- Merck KGaA
- Shoei Chemical Inc. (Nanosys)
- Alfa Chemistry
Bibliography
- Department for Science, Innovation and Technology. (2026, June 8). Semiconductor Sector Study 2026. GOV.UK.
- European Commission. (2025, December 11). Commission approves €623 million German State aid to support set-up of two first-of-a-kind chips factories in Germany.
- International Trade Administration. (2025, November 20). Japan - Semiconductors. U.S. Department of Commerce.
- JSR Corporation. (2025, September 16). JSR Corporation/Inpria Corporation and Lam Research enter cross licensing and collaboration agreement to advance semiconductor manufacturing.
- Merck KGaA, Darmstadt, Germany. (2025, December 1). Merck KGaA, Darmstadt, Germany, inaugurates Semiconductor Solutions site in Taiwan to support AI growth.
- Ministry of Trade, Industry and Resources, & Ministry of Science and ICT. (2026, January 15). ICT exports post record annual performance in 2025.
- National Institute of Standards and Technology. (2025, January 16). U.S. Department of Commerce announces $1.4 billion in final awards to support the next generation of U.S. semiconductor advanced packaging.
- Samsung Display. (2025, May 13). Samsung Display unveils advanced R&D achievements at Display Week 2025.
This Report Answers
- The report explains where QD photoresists are used across quantum dot chemistry and display architecture.
- Segment analysis identifies CdSe-based resists and QD-OLED conversion as the primary categories.
- Country analysis covers South Korea, Germany, the USA, the UK and Japan.
- Competitive analysis reviews Samsung SDI, Merck KGaA, Shoei Chemical Inc. (Nanosys), and Alfa Chemistry.
- Application analysis covers emission control, process stability and pattern fidelity.
- Supply-form analysis covers ready-to-coat resist, QD concentrate and custom formulation routes.
- The forecast uses provider checks, official source review and display-material qualification assumptions.
What does the Quantum Dot Photoresists Market cover?
CdSe-based, InP-based and perovskite quantum dot resists used for patterned color conversion.
The Quantum Dot Photoresists Market covers materials that combine quantum dot emission with photoresist patterning behavior. It includes resists and related formulations used to place color-conversion materials within defined pixel or photonic structures.
The assessment differs from broad quantum dot films because the material must behave like a patternable resist. It excludes bulk quantum dot powders unless they are sold for formulation into QD photoresists or included in a custom resist package.
What is included in the scope?
Quantum dot photoresist systems used in display conversion and research photonics.
The included display context connects to quantum dot display applications. Adjacent patterning context is linked to photoresist ancillary lithography chemicals because QD resists share lithography handling needs.
Semiconductor materials comparisons reference semiconductor process chemicals where high-purity formulation and qualification rules overlap. Quantum dot feedstock context connects to quantum dot materials and technologies when resists use tuned nanocrystal inputs.
What is excluded from the scope?
Standalone quantum dot films and general photoresists are outside the scope.
The review separates material-form revenue from nano quantum dots sold as particles, powders or research reagents. Electronics chemical adjacency is captured through electronic chemicals and materials when suppliers sell broader semiconductor or display inputs.
Control electronics are excluded when they belong to display driver coverage and do not contain patterned QD conversion materials. Standard semiconductor photoresists are excluded when they do not carry quantum dots or directly support quantum dot patterning. Broad QD films are included only when the commercial product is sold as a photoresist or formulation package for patterned deposition.
How Was the Analysis Built?
120+ sources, 35+ company portfolios, 25+ countries and more than 20 interviews.
- Primary Research: Primary research includes discussions with display-material suppliers, photoresist formulators, distributors, procurement teams and technical experts. These conversations examine qualification needs, coating behavior and emission stability.
- Desk Research: Desk research covers government statistics, regulatory publications, company announcements, official product pages and technical studies. Selected public evidence sources cited in the analysis are documented in the bibliography.
- Market Sizing and Forecasting: Market estimates combine historical values, segment shares, country growth, provider participation, display adoption and commercialization barriers.
- Data Validation and Update Cycle: Findings are validated against public data, company activity, policy changes and industry developments. Updates review launches, partnerships and material qualification.
Segmentation
What is the report’s scope and coverage?
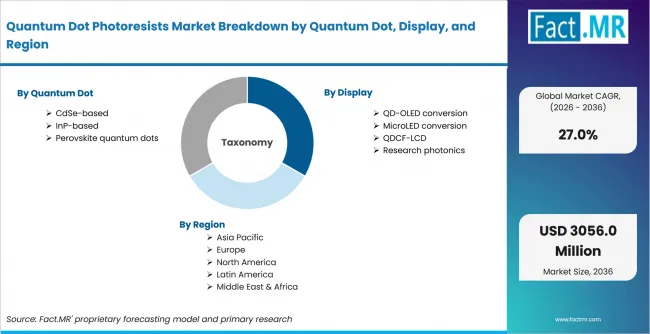
Quantum Dot Photoresists Market Breakdown By Quantum Dot, Display, And Region | Source: Fact.MR
| Attribute | Details |
|---|---|
| Quantitative Units | USD million |
| Market Definition | Photoresist formulations that integrate quantum dots or support quantum dot patterning for display color conversion, research photonics and related micro-patterned optical layers. |
| Quantum Dot | CdSe-based; InP-based; Perovskite quantum dots |
| Display | QD-OLED conversion; MicroLED conversion; QDCF-LCD; Research photonics |
| Resist Tone | Negative tone; Positive tone; Hybrid matrix |
| Emission | Red; Green; Blue-specialty |
| Supply Form | Ready-to-coat resist; QD concentrate; Custom formulation |
| Regions Covered | North America; Latin America; Western Europe; Eastern Europe; East Asia; South Asia & Pacific; Middle East & Africa |
| Countries Covered | USA; UK; Germany; Japan; South Korea |
| Companies Profiled | Samsung SDI, Merck KGaA, Shoei Chemical Inc. (Nanosys), Alfa Chemistry |
| Forecast Period | 2026 to 2036 |
| Approach | Hybrid top-down and bottom-up approach using display-material qualification, QD chemistry, photoresist use cases, country adoption and provider portfolio review. |
Source: Fact.MR analysis. Updated Aug 24, 2026
How is the market segmented?
-
By Quantum Dot:
- CdSe-based
- InP-based
- Perovskite quantum dots
-
By Display:
- QD-OLED conversion
- MicroLED conversion
- QDCF-LCD
- Research photonics
-
By Resist Tone:
- Negative tone
- Positive tone
- Hybrid matrix
-
By Emission:
- Red
- Green
- Blue-specialty
-
By Supply Form:
- Ready-to-coat resist
- QD concentrate
- Custom formulation
-
By Region:
- North America
- Latin America
- Western Europe
- Eastern Europe
- East Asia
- South Asia & Pacific
- Middle East & Africa
Frequently Asked Questions
How big is the quantum dot photoresists market in 2026?
What is the CAGR of the quantum dot photoresists market from 2026 to 2036?
Which quantum dot leads the quantum dot photoresists market?
Which display leads the quantum dot photoresists market?
Who are the leading companies in the quantum dot photoresists market?
Who worked on this report


Preview the report firsthand - request a free sample
Free SampleGet the brochure for pricing and purchase details
Download PDF