Regenerative Suspension System Market
Regenerative Suspension System Market Analysis, By Technology, By Vehicle Type, By Suspension Type, By Sales Channel, and Region - Market Insights 2025 to 2035
Analysis of Regenerative Suspension System Market Covering 30+ Countries Including Analysis of US, Canada, UK, Germany, France, Nordics, GCC countries, Japan, Korea and many more.
Regenerative Suspension System Market Outlook (2025 to 2035)
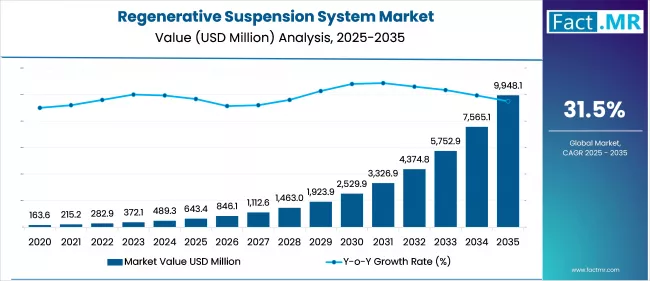
The global regenerative suspension system market is projected to increase from USD 643.4 million in 2025 to USD 9,948.1 million by 2035, with a CAGR of 31.5% during the forecast period. Growth is driven by rising demand for energy recovery technologies in electric and hybrid vehicles, stringent fuel economy regulations, and growing R&D investments in smart suspension technologies.
Their use makes them ideal for improving fuel efficiency, extending the driving range of electric and hybrid vehicles, and contributing to overall sustainability in the transportation sector.
What are the Drivers of the Regenerative Suspension System Market?
The surge in adoption of electric and hybrid vehicles globally is a core driver behind the regenerative suspension system market. These systems help recover kinetic energy during vehicle motion, converting it into electricity that can recharge the vehicle’s battery. With increasing regulatory pressure for improved fuel efficiency and reduced greenhouse gas emissions, automakers are integrating regenerative components to enhance overall energy management. As vehicle manufacturers seek lightweight and energy-efficient solutions, regenerative suspension becomes an ideal choice.
Growing interest in advanced driver assistance systems (ADAS) and vehicle autonomy has also contributed significantly. These smart suspension systems not only offer energy recovery but also provide adaptive damping and active ride control, thus improving passenger comfort and vehicle handling. As luxury and premium car segments expand in emerging markets, the demand for sophisticated, energy-efficient suspension systems is expected to multiply.
OEMs and Tier-1 suppliers are increasing their R&D spending on regenerative technologies. Innovations such as electromagnetic and hydraulic hybrid systems are being trialed across prototype fleets in Europe and Asia. Moreover, government support in the form of innovation grants and e-mobility incentives is helping accelerate the development and commercialization of regenerative suspension technologies.
What are the Regional Trends of the Regenerative Suspension System Market?
North America is one of the leading regions for the deployment of regenerative suspension systems. The U.S. is witnessing increased integration of these systems in electric SUVs and performance vehicles. Automakers like Tesla and GM are actively exploring regenerative technologies to enhance range and efficiency. Moreover, federal clean vehicle incentives and rising consumer awareness regarding EV efficiency support market expansion.
Europe represents the most aggressive adopter, with leading automakers such as Audi, Mercedes-Benz, and Porsche already testing regenerative suspension systems in high-end vehicles. The EU’s commitment to carbon neutrality and fuel-efficiency benchmarks further drives OEMs to adopt energy-recovery systems. Germany, in particular, is the core innovation hub, benefiting from a robust automotive supply chain and proactive government support.
Asia Pacific is emerging rapidly, led by China, Japan, and South Korea. China’s expansive EV manufacturing sector and policy mandates for greener transportation have catalyzed development. Japanese manufacturers are renowned for their advanced automotive R&D, particularly in energy efficiency and autonomous driving, which aligns with regenerative suspension systems. South Korea is also making progress in this space, with Hyundai and Kia exploring integration in their upcoming EV models.
What are the Challenges and Restraining Factors of the Regenerative Suspension System Market?
One of the primary restraints is the high initial cost of regenerative suspension systems. These technologies involve complex mechatronics, including electromagnetic actuators, electronic controllers, and energy storage components, driving up production and integration expenses. As a result, their adoption remains largely limited to premium vehicle segments.
Durability and reliability concerns also persist, especially under harsh road conditions. The performance of regenerative systems must match traditional suspensions in all terrains, which can delay full-scale commercialization in mass-market vehicles. Additionally, technical integration with existing vehicle platforms requires advanced engineering, making retrofitting a challenging process.
Standardization remains a key challenge, as the involvement of diverse technologies, including mechanical, hydraulic, and electromagnetic systems, across various suppliers leads to fragmented protocols and inconsistent safety standards. Moreover, awareness about the technology's dual benefits (ride comfort and energy recovery) remains low among end consumers and aftermarket participants.
Country-Wise Outlook
U.S.: Market Driven by EV Innovation and Clean Mobility Policies
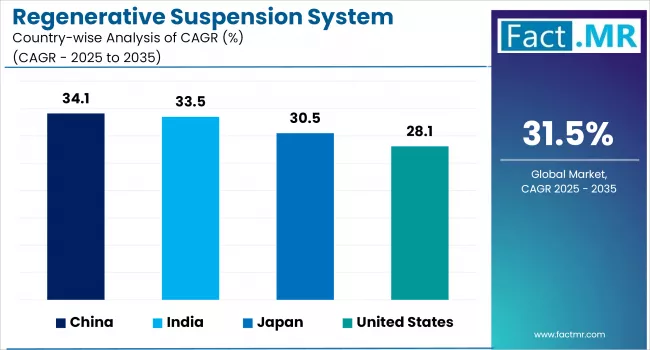
The U.S. leads in regenerative suspension innovation due to its thriving electric vehicle ecosystem and progressive clean energy regulations. Companies like Tesla, Rivian, and Lucid Motors are incorporating or exploring energy-recovery suspension components in their premium models. The U.S. Department of Energy's grants and clean technology funding further encourage research and development in this space.
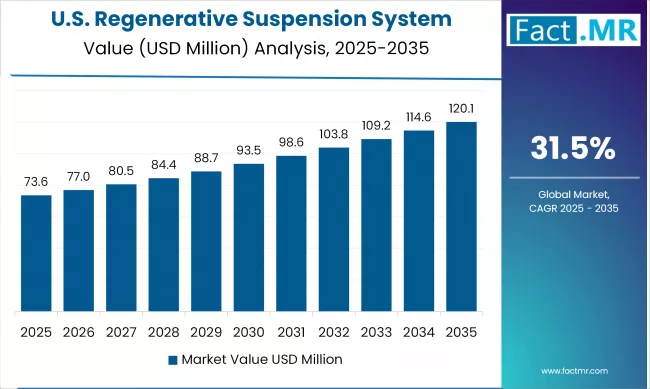
Moreover, the rising popularity of electric SUVs and light trucks, which are more likely to benefit from energy recovery due to their higher mass and dynamic range requirements, is fueling commercial demand. Several Tier-1 suppliers based in Michigan and California are partnering with OEMs to develop scalable and cost-effective regenerative suspension prototypes.
Germany: Technological Leadership in Automotive Mechatronics
Germany is a global hub for automotive innovation, and regenerative suspension systems are gaining attention among luxury automakers. Audi’s e-tron models and Mercedes-Benz concept vehicles have piloted adaptive regenerative suspensions that combine active damping with kinetic energy harvesting. The country’s strong engineering base and favorable R&D tax incentives promote continuous innovation.
German OEMs are collaborating closely with research institutions and component suppliers, such as ZF Friedrichshafen and Bosch, to enhance real-time suspension response and energy capture. Additionally, Germany’s push towards carbon neutrality and vehicle electrification, especially for urban transport, makes it a critical market for pilot projects and early adoption.
China: Policy-Backed Expansion in Green Vehicle Technologies
China, the world’s largest EV market, is fast becoming a center for regenerative suspension system implementation. The government’s strict emissions norms and incentives for new energy vehicles (NEVs) create fertile ground for energy-recovery technologies. Chinese OEMs, such as BYD, NIO, and XPeng, are experimenting with advanced suspension modules to enhance energy efficiency and improve ride dynamics.
Massive investments in smart vehicle infrastructure and AI-integrated driving systems are also supporting the adoption of electronically controlled regenerative suspensions. Additionally, local Tier-1 suppliers are developing proprietary technologies to support domestic OEMs, aided by favorable IP regulations and funding programs from provincial governments.
Category-wise Analysis
Electromagnetic to Exhibit Leading by Technology
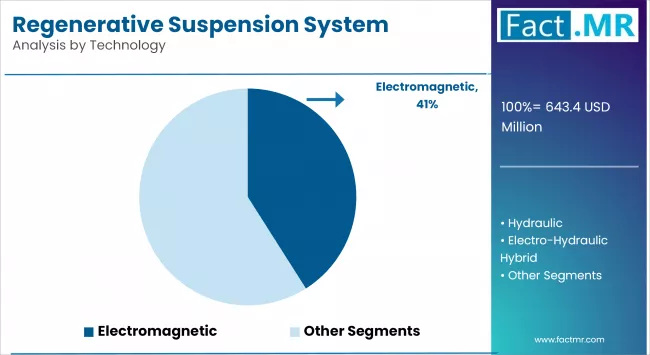
Electromagnetic regenerative suspension systems account for the largest share of the regenerative suspension system market, owing to their superior ability to convert kinetic energy into electricity using electromagnetic damping units. These systems replace traditional hydraulic shock absorbers with electromagnetic actuators that convert oscillatory motion into electrical energy, which can be reused by the vehicle’s powertrain or stored in onboard batteries. Their precise control capabilities also enhance vehicle ride comfort and stability, making them increasingly popular in premium electric vehicles (EVs) and luxury hybrids.
OEMs such as Audi, Mercedes-Benz, and Genesis have already demonstrated prototypes or commercial models with electromagnetic suspension technologies. Their suitability for integration with regenerative braking and advanced driver-assistance systems (ADAS) further expands their application in next-generation vehicles.
Despite high initial costs and complex system integration, ongoing R&D and falling component prices are expected to increase adoption over the next decade. With the rise in EV penetration and government support for energy-efficient automotive systems, electromagnetic regenerative suspension is expected to continue leading the market.
Heavy-Duty and Commercial to Exhibit Leading by Vehicle Type
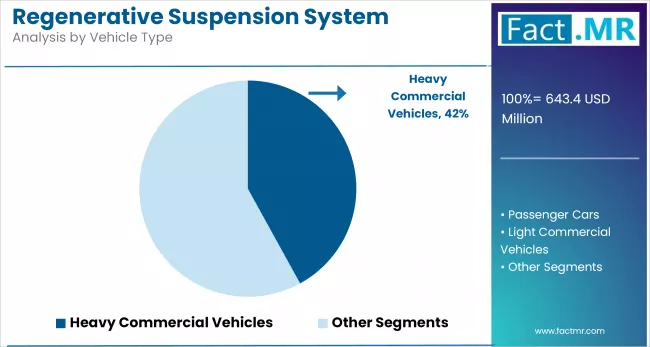
Hydraulic regenerative suspension systems are increasingly favored in heavy-duty and commercial vehicles due to their higher load-bearing capacity and robust performance on rugged terrains. Unlike electromagnetic systems, these use hydraulic pumps to convert suspension movement into hydraulic pressure, which can then power auxiliary systems or be stored. While they may not achieve the same energy recovery efficiency as their electromagnetic counterparts, they are far more affordable and technically compatible with existing vehicle architectures.
The public transport sector, especially in Europe and North America, is exploring these systems in buses and logistics fleets to meet sustainability targets without investing in complete electrification. Additionally, their ability to improve fuel efficiency and reduce wear on traditional mechanical parts makes them attractive in cost-sensitive and high-usage applications. While adoption in passenger vehicles remains limited, hydraulic systems are gaining ground where durability, scalability, and cost-effectiveness are prioritized.
Semi-Active to Exhibit Leading by Suspension Type
The semi-active suspension segment holds the largest share in the regenerative suspension system market. Its ability to adjust the damping force in real time based on road conditions and driving behavior offers an optimal balance between ride comfort and handling. Semi-active systems are also more cost-effective and less complex than fully active setups, making them a preferred choice for integration in mid- to high-end vehicle models, particularly in electric and hybrid vehicles aiming to enhance energy efficiency.
The active suspension and adaptive suspension segments are projected to experience rapid growth during the forecast period. As consumer expectations rise for luxury, performance, and safety, automakers are adopting these advanced systems that offer real-time adjustments for ride height, stiffness, and body control. The growing deployment of electric and autonomous vehicles, which demand enhanced ride quality and control, is further accelerating demand for these intelligent suspension technologies across both premium and performance-oriented vehicle categories.
OEM to Exhibit leading by Sales Channel
The Original Equipment Manufacturer (OEM) segment is anticipated to account for the largest share in the regenerative suspension system market. This is due to the increasing integration of regenerative shock absorbers in new vehicle models, spurred by the surge in electric vehicle (EV) production and automakers' emphasis on energy-efficient suspension technologies.
OEMs possess the financial resources and R&D capabilities to develop and integrate regenerative suspension systems seamlessly into their vehicle production processes, ensuring optimal performance and compatibility. OEMs are increasingly incorporating regenerative dampers into their EVs to optimize range and meet climate goals for mobility.
The aftermarket for regenerative suspension systems is poised for rapid expansion, driven by increasing vehicle numbers and evolving consumer demands. As more vehicles with regenerative shock absorbers hit the roads, the demand for replacement parts and performance-enhancing modifications will rise.
Consumers are increasingly seeking out aftermarket solutions to boost their vehicles' efficiency and handling, creating a steady revenue stream for manufacturers and suppliers of regenerative suspension components. The trend of vehicle customization and performance upgrades further bolsters demand, as enthusiasts and daily drivers alike look for improved driving dynamics and ride quality.
Competitive Analysis
The global regenerative suspension system market is becoming increasingly competitive, with a mix of established automotive OEMs, Tier-1 suspension system suppliers, and emerging tech-driven startups. This dynamic landscape is primarily fueled by innovation in energy recovery mechanisms, intelligent damping technologies, and system integration tailored for electric and hybrid vehicles.
Companies such as Audi, Mercedes-Benz, Tesla, and BYD are leading on the OEM side, integrating prototypes and concept designs. Meanwhile, suppliers like ZF Friedrichshafen, Tenneco, Continental AG, and Bose Corporation are pioneering technological advancements, including magnetorheological dampers and electromagnetic actuator modules. Startups such as ClearMotion are innovating with software-defined suspensions that combine ride optimization with energy recovery.
To gain a competitive edge, companies are increasingly focusing on modular designs, software integration, and digital twin simulations for pre-deployment testing. The convergence of AI, mechatronics, and the Internet of Things (IoT) in suspension systems is also opening doors for aftermarket retrofits and predictive maintenance solutions.
Recent Developments
- In January 2024, ClearMotion raised $39 million in funding to scale production of its proactive ride system, which combines energy recovery with real-time road condition adjustment.
- In October 2023, ZF Friedrichshafen AG unveiled a new-generation semi-active suspension platform with integrated energy harvesting capabilities aimed at premium EVs.
Segmentation of the Regenerative Suspension System Market
-
By Technology :
- Electromagnetic
- Hydraulic
- Electro-Hydraulic Hybrid
- Others
-
By Vehicle Type :
- Passenger Cars
- Light Commercial Vehicles
- Heavy Commercial Vehicles
-
By Suspension Type :
- Semi-Active Suspension
- Active Suspension
- Adaptive Suspension
-
By Sales Channel :
- OEM
- Aftermarket
-
By Region :
- North America
- Latin America
- Western Europe
- Eastern Europe
- East Asia
- South Asia & Pacific
- Middle East & Africa
Table of Content
- Executive Summary
- Global Market Outlook
- Demand-side Trends
- Supply-side Trends
- Technology Roadmap Analysis
- Analysis and Recommendations
- Market Overview
- Market Coverage / Taxonomy
- Market Definition / Scope / Limitations
- Market Background
- Market Dynamics
- Drivers
- Restraints
- Opportunity
- Trends
- Scenario Forecast
- Demand in Optimistic Scenario
- Demand in Likely Scenario
- Demand in Conservative Scenario
- Opportunity Map Analysis
- Product Life Cycle Analysis
- Supply Chain Analysis
- Supply Side Participants and their Roles
- Producers
- Mid-Level Participants (Traders/ Agents/ Brokers)
- Wholesalers and Distributors
- Value Added and Value Created at Node in the Supply Chain
- List of Component Suppliers
- List of Existing and Potential Buyers
- Supply Side Participants and their Roles
- Investment Feasibility Matrix
- Value Chain Analysis
- Profit Margin Analysis
- Wholesalers and Distributors
- Retailers
- PESTLE and Porter’s Analysis
- Regulatory Landscape
- By Key Regions
- By Key Countries
- Production and Consumption Statistics
- Import and Export Statistics
- Market Dynamics
- Global Market Analysis 2020 to 2024 and Forecast, 2025 to 2035
- Historical Market Size Value (USD Mn) & Volume (Units) Analysis, 2020 to 2024
- Current and Future Market Size Value (USD Mn) & Volume (Units) Projections, 2025 to 2035
- Y-o-Y Growth Trend Analysis
- Absolute $ Opportunity Analysis
- Global Market Pricing Analysis 2020 to 2024 and Forecast 2025 to 2035
- Global Market Analysis 2020 to 2024 and Forecast 2025 to 2035, By Technology
- Introduction / Key Findings
- Historical Market Size Value (USD Mn) & Volume (Units) Analysis By Technology, 2020 to 2024
- Current and Future Market Size Value (USD Mn) & Volume (Units) Analysis and Forecast By Technology, 2025 to 2035
- Electromagnetic
- Hydraulic
- Electro-Hydraulic Hybrid
- Others
- Y-o-Y Growth Trend Analysis By Technology, 2020 to 2024
- Absolute $ Opportunity Analysis By Technology, 2025 to 2035
- Global Market Analysis 2020 to 2024 and Forecast 2025 to 2035, By Vehicle Type
- Introduction / Key Findings
- Historical Market Size Value (USD Mn) & Volume (Units) Analysis By Vehicle Type, 2020 to 2024
- Current and Future Market Size Value (USD Mn) & Volume (Units) Analysis and Forecast By Vehicle Type, 2025 to 2035
- Passenger Cars
- Light Commercial Vehicles
- Heavy Commercial Vehicles
- Y-o-Y Growth Trend Analysis By Vehicle Type, 2020 to 2024
- Absolute $ Opportunity Analysis By Vehicle Type, 2025 to 2035
- Global Market Analysis 2020 to 2024 and Forecast 2025 to 2035, By Suspension Type
- Introduction / Key Findings
- Historical Market Size Value (USD Mn) & Volume (Units) Analysis By Suspension Type, 2020 to 2024
- Current and Future Market Size Value (USD Mn) & Volume (Units) Analysis and Forecast By Suspension Type, 2025 to 2035
- Semi-Active Suspension
- Active Suspension
- Adaptive Suspension
- Y-o-Y Growth Trend Analysis By Suspension Type, 2020 to 2024
- Absolute $ Opportunity Analysis By Suspension Type, 2025 to 2035
- Global Market Analysis 2020 to 2024 and Forecast 2025 to 2035, By Sales Channel
- Introduction / Key Findings
- Historical Market Size Value (USD Mn) & Volume (Units) Analysis By Sales Channel, 2020 to 2024
- Current and Future Market Size Value (USD Mn) & Volume (Units) Analysis and Forecast By Sales Channel, 2025 to 2035
- OEM
- Aftermarket
- Y-o-Y Growth Trend Analysis By Sales Channel, 2020 to 2024
- Absolute $ Opportunity Analysis By Sales Channel, 2025 to 2035
- Global Market Analysis 2020 to 2024 and Forecast 2025 to 2035, By Region
- Introduction
- Historical Market Size Value (USD Mn) & Volume (Units) Analysis By Region, 2020 to 2024
- Current Market Size Value (USD Mn) & Volume (Units) Analysis and Forecast By Region, 2025 to 2035
- North America
- Latin America
- Western Europe
- East Asia
- South Asia Pacific
- Eastern Europe
- Middle East & Africa
- Market Attractiveness Analysis By Region
- North America Market Analysis 2020 to 2024 and Forecast 2025 to 2035, By Country
- Historical Market Size Value (USD Mn) & Volume (Units) Trend Analysis By Market Taxonomy, 2020 to 2024
- Market Size Value (USD Mn) & Volume (Units) Forecast By Market Taxonomy, 2025 to 2035
- By Country
- U.S.
- Canada
- Mexico
- By Technology
- By Vehicle Type
- By Suspension Type
- By Sales Channel
- By Country
- Market Attractiveness Analysis
- By Country
- By Technology
- By Vehicle Type
- By Suspension Type
- By Sales Channel
- Key Takeaways
- Latin America Market Analysis 2020 to 2024 and Forecast 2025 to 2035, By Country
- Historical Market Size Value (USD Mn) & Volume (Units) Trend Analysis By Market Taxonomy, 2020 to 2024
- Market Size Value (USD Mn) & Volume (Units) Forecast By Market Taxonomy, 2025 to 2035
- By Country
- Brazil
- Chile
- Rest of Latin America
- By Technology
- By Vehicle Type
- By Suspension Type
- By Sales Channel
- By Country
- Market Attractiveness Analysis
- By Country
- By Technology
- By Vehicle Type
- By Suspension Type
- By Sales Channel
- Key Takeaways
- Western Europe Market Analysis 2020 to 2024 and Forecast 2025 to 2035, By Country
- Historical Market Size Value (USD Mn) & Volume (Units) Trend Analysis By Market Taxonomy, 2020 to 2024
- Market Size Value (USD Mn) & Volume (Units) Forecast By Market Taxonomy, 2025 to 2035
- By Country
- Germany
- Italy
- France
- U.K.
- Spain
- Russia
- BENELUX
- Rest of Europe
- By Technology
- By Vehicle Type
- By Suspension Type
- By Sales Channel
- By Country
- Market Attractiveness Analysis
- By Country
- By Technology
- By Vehicle Type
- By Suspension Type
- By Sales Channel
- Key Takeaways
- East Asia Market Analysis 2020 to 2024 and Forecast 2025 to 2035, By Country
- Historical Market Size Value (USD Mn) & Volume (Units) Trend Analysis By Market Taxonomy, 2020 to 2024
- Market Size Value (USD Mn) & Volume (Units) Forecast By Market Taxonomy, 2025 to 2035
- By Country
- China
- Japan
- South Korea
- By Technology
- By Vehicle Type
- By Suspension Type
- By Sales Channel
- By Country
- Market Attractiveness Analysis
- By Country
- By Technology
- By Vehicle Type
- By Suspension Type
- By Sales Channel
- Key Takeaways
- South Asia Pacific Market Analysis 2020 to 2024 and Forecast 2025 to 2035, By Country
- Historical Market Size Value (USD Mn) & Volume (Units) Trend Analysis By Market Taxonomy, 2020 to 2024
- Market Size Value (USD Mn) & Volume (Units) Forecast By Market Taxonomy, 2025 to 2035
- By Country
- India
- ASEAN Countries
- Australia & New Zealand
- Rest of South Asia Pacific
- By Technology
- By Vehicle Type
- By Suspension Type
- By Sales Channel
- By Country
- Market Attractiveness Analysis
- By Country
- By Technology
- By Vehicle Type
- By Suspension Type
- By Sales Channel
- Key Takeaways
- Eastern Europe Market Analysis 2020 to 2024 and Forecast 2025 to 2035, By Country
- Historical Market Size Value (USD Mn) & Volume (Units) Trend Analysis By Market Taxonomy, 2020 to 2024
- Market Size Value (USD Mn) & Volume (Units) Forecast By Market Taxonomy, 2025 to 2035
- By Country
- Russia
- Poland
- Hungary
- Balkan & Baltics
- Rest of Eastern Europe
- By Technology
- By Vehicle Type
- By Suspension Type
- By Sales Channel
- By Country
- Market Attractiveness Analysis
- By Country
- By Technology
- By Vehicle Type
- By Suspension Type
- By Sales Channel
- Key Takeaways
- Middle East & Africa Market Analysis 2020 to 2024 and Forecast 2025 to 2035, By Country
- Historical Market Size Value (USD Mn) & Volume (Units) Trend Analysis By Market Taxonomy, 2020 to 2024
- Market Size Value (USD Mn) & Volume (Units) Forecast By Market Taxonomy, 2025 to 2035
- By Country
- KSA
- Other GCC Countries
- Turkiye
- South Africa
- Rest of MEA
- By Technology
- By Vehicle Type
- By Suspension Type
- By Sales Channel
- By Country
- Market Attractiveness Analysis
- By Country
- By Technology
- By Vehicle Type
- By Suspension Type
- By Sales Channel
- Key Takeaways
- Key Countries Market Analysis
- United States
- Pricing Analysis
- Market Share Analysis, 2024
- By Technology
- By Vehicle Type
- By Suspension Type
- By Sales Channel
- Germany
- Pricing Analysis
- Market Share Analysis, 2024
- By Technology
- By Vehicle Type
- By Suspension Type
- By Sales Channel
- Japan
- Pricing Analysis
- Market Share Analysis, 2024
- By Technology
- By Vehicle Type
- By Suspension Type
- By Sales Channel
- China
- Pricing Analysis
- Market Share Analysis, 2024
- By Technology
- By Vehicle Type
- By Suspension Type
- By Sales Channel
- South Korea
- Pricing Analysis
- Market Share Analysis, 2024
- By Technology
- By Vehicle Type
- By Suspension Type
- By Sales Channel
- United States
- Market Structure Analysis
- Competition Dashboard
- Competition Benchmarking
- Market Share Analysis of Top Players
- By Regional
- By Technology
- By Vehicle Type
- By Suspension Type
- By Sales Channel
- Competition Analysis
- Competition Deep Dive
- ZF Friedrichshafen
- Overview
- Product Portfolio
- Profitability by Market Segments (Product/Age /Sales Channel/Region)
- Sales Footprint
- Strategy Overview
- Marketing Strategy
- Product Strategy
- Channel Strategy
- Tenneco
- Overview
- Product Portfolio
- Profitability by Market Segments (Product/Age /Sales Channel/Region)
- Sales Footprint
- Strategy Overview
- Marketing Strategy
- Product Strategy
- Channel Strategy
- Continental AG
- Overview
- Product Portfolio
- Profitability by Market Segments (Product/Age /Sales Channel/Region)
- Sales Footprint
- Strategy Overview
- Marketing Strategy
- Product Strategy
- Channel Strategy
- Audi
- Overview
- Product Portfolio
- Profitability by Market Segments (Product/Age /Sales Channel/Region)
- Sales Footprint
- Strategy Overview
- Marketing Strategy
- Product Strategy
- Channel Strategy
- Tesla
- Overview
- Product Portfolio
- Profitability by Market Segments (Product/Age /Sales Channel/Region)
- Sales Footprint
- Strategy Overview
- Marketing Strategy
- Product Strategy
- Channel Strategy
- ClearMotion
- Overview
- Product Portfolio
- Profitability by Market Segments (Product/Age /Sales Channel/Region)
- Sales Footprint
- Strategy Overview
- Marketing Strategy
- Product Strategy
- Channel Strategy
- BYD
- Overview
- Product Portfolio
- Profitability by Market Segments (Product/Age /Sales Channel/Region)
- Sales Footprint
- Strategy Overview
- Marketing Strategy
- Product Strategy
- Channel Strategy
- ZF Friedrichshafen
- Competition Deep Dive
- Assumptions & Acronyms Used
- Research Methodology
List Of Table
- Table 1: Global Market Value (USD Mn) Forecast by Region, 2020 to 2035
- Table 2: Global Market Volume (Units) Forecast by Region, 2020 to 2035
- Table 3: Global Market Value (USD Mn) Forecast by Technology, 2020 to 2035
- Table 4: Global Market Volume (Units) Forecast by Technology, 2020 to 2035
- Table 5: Global Market Value (USD Mn) Forecast by Vehicle Type, 2020 to 2035
- Table 6: Global Market Volume (Units) Forecast by Vehicle Type, 2020 to 2035
- Table 7: Global Market Value (USD Mn) Forecast by Suspension Type, 2020 to 2035
- Table 8: Global Market Volume (Units) Forecast by Suspension Type, 2020 to 2035
- Table 9: Global Market Value (USD Mn) Forecast by Sales Channel, 2020 to 2035
- Table 10: Global Market Volume (Units) Forecast by Sales Channel, 2020 to 2035
- Table 11: North America Market Value (USD Mn) Forecast by Country, 2020 to 2035
- Table 12: North America Market Volume (Units) Forecast by Country, 2020 to 2035
- Table 13: North America Market Value (USD Mn) Forecast by Technology, 2020 to 2035
- Table 14: North America Market Volume (Units) Forecast by Technology, 2020 to 2035
- Table 15: North America Market Value (USD Mn) Forecast by Vehicle Type, 2020 to 2035
- Table 16: North America Market Volume (Units) Forecast by Vehicle Type, 2020 to 2035
- Table 17: North America Market Value (USD Mn) Forecast by Suspension Type, 2020 to 2035
- Table 18: North America Market Volume (Units) Forecast by Suspension Type, 2020 to 2035
- Table 19: North America Market Value (USD Mn) Forecast by Sales Channel, 2020 to 2035
- Table 20: North America Market Volume (Units) Forecast by Sales Channel, 2020 to 2035
- Table 21: Latin America Market Value (USD Mn) Forecast by Country, 2020 to 2035
- Table 22: Latin America Market Volume (Units) Forecast by Country, 2020 to 2035
- Table 23: Latin America Market Value (USD Mn) Forecast by Technology, 2020 to 2035
- Table 24: Latin America Market Volume (Units) Forecast by Technology, 2020 to 2035
- Table 25: Latin America Market Value (USD Mn) Forecast by Vehicle Type, 2020 to 2035
- Table 26: Latin America Market Volume (Units) Forecast by Vehicle Type, 2020 to 2035
- Table 27: Latin America Market Value (USD Mn) Forecast by Suspension Type, 2020 to 2035
- Table 28: Latin America Market Volume (Units) Forecast by Suspension Type, 2020 to 2035
- Table 29: Latin America Market Value (USD Mn) Forecast by Sales Channel, 2020 to 2035
- Table 30: Latin America Market Volume (Units) Forecast by Sales Channel, 2020 to 2035
- Table 31: Western Europe Market Value (USD Mn) Forecast by Country, 2020 to 2035
- Table 32: Western Europe Market Volume (Units) Forecast by Country, 2020 to 2035
- Table 33: Western Europe Market Value (USD Mn) Forecast by Technology, 2020 to 2035
- Table 34: Western Europe Market Volume (Units) Forecast by Technology, 2020 to 2035
- Table 35: Western Europe Market Value (USD Mn) Forecast by Vehicle Type, 2020 to 2035
- Table 36: Western Europe Market Volume (Units) Forecast by Vehicle Type, 2020 to 2035
- Table 37: Western Europe Market Value (USD Mn) Forecast by Suspension Type, 2020 to 2035
- Table 38: Western Europe Market Volume (Units) Forecast by Suspension Type, 2020 to 2035
- Table 39: Western Europe Market Value (USD Mn) Forecast by Sales Channel, 2020 to 2035
- Table 40: Western Europe Market Volume (Units) Forecast by Sales Channel, 2020 to 2035
- Table 41: East Asia Market Value (USD Mn) Forecast by Country, 2020 to 2035
- Table 42: East Asia Market Volume (Units) Forecast by Country, 2020 to 2035
- Table 43: East Asia Market Value (USD Mn) Forecast by Technology, 2020 to 2035
- Table 44: East Asia Market Volume (Units) Forecast by Technology, 2020 to 2035
- Table 45: East Asia Market Value (USD Mn) Forecast by Vehicle Type, 2020 to 2035
- Table 46: East Asia Market Volume (Units) Forecast by Vehicle Type, 2020 to 2035
- Table 47: East Asia Market Value (USD Mn) Forecast by Suspension Type, 2020 to 2035
- Table 48: East Asia Market Volume (Units) Forecast by Suspension Type, 2020 to 2035
- Table 49: East Asia Market Value (USD Mn) Forecast by Sales Channel, 2020 to 2035
- Table 50: East Asia Market Volume (Units) Forecast by Sales Channel, 2020 to 2035
- Table 51: South Asia Pacific Market Value (USD Mn) Forecast by Country, 2020 to 2035
- Table 52: South Asia Pacific Market Volume (Units) Forecast by Country, 2020 to 2035
- Table 53: South Asia Pacific Market Value (USD Mn) Forecast by Technology, 2020 to 2035
- Table 54: South Asia Pacific Market Volume (Units) Forecast by Technology, 2020 to 2035
- Table 55: South Asia Pacific Market Value (USD Mn) Forecast by Vehicle Type, 2020 to 2035
- Table 56: South Asia Pacific Market Volume (Units) Forecast by Vehicle Type, 2020 to 2035
- Table 57: South Asia Pacific Market Value (USD Mn) Forecast by Suspension Type, 2020 to 2035
- Table 58: South Asia Pacific Market Volume (Units) Forecast by Suspension Type, 2020 to 2035
- Table 59: South Asia Pacific Market Value (USD Mn) Forecast by Sales Channel, 2020 to 2035
- Table 60: South Asia Pacific Market Volume (Units) Forecast by Sales Channel, 2020 to 2035
- Table 61: Eastern Europe Market Value (USD Mn) Forecast by Country, 2020 to 2035
- Table 62: Eastern Europe Market Volume (Units) Forecast by Country, 2020 to 2035
- Table 63: Eastern Europe Market Value (USD Mn) Forecast by Technology, 2020 to 2035
- Table 64: Eastern Europe Market Volume (Units) Forecast by Technology, 2020 to 2035
- Table 65: Eastern Europe Market Value (USD Mn) Forecast by Vehicle Type, 2020 to 2035
- Table 66: Eastern Europe Market Volume (Units) Forecast by Vehicle Type, 2020 to 2035
- Table 67: Eastern Europe Market Value (USD Mn) Forecast by Suspension Type, 2020 to 2035
- Table 68: Eastern Europe Market Volume (Units) Forecast by Suspension Type, 2020 to 2035
- Table 69: Eastern Europe Market Value (USD Mn) Forecast by Sales Channel, 2020 to 2035
- Table 70: Eastern Europe Market Volume (Units) Forecast by Sales Channel, 2020 to 2035
- Table 71: Middle East & Africa Market Value (USD Mn) Forecast by Country, 2020 to 2035
- Table 72: Middle East & Africa Market Volume (Units) Forecast by Country, 2020 to 2035
- Table 73: Middle East & Africa Market Value (USD Mn) Forecast by Technology, 2020 to 2035
- Table 74: Middle East & Africa Market Volume (Units) Forecast by Technology, 2020 to 2035
- Table 75: Middle East & Africa Market Value (USD Mn) Forecast by Vehicle Type, 2020 to 2035
- Table 76: Middle East & Africa Market Volume (Units) Forecast by Vehicle Type, 2020 to 2035
- Table 77: Middle East & Africa Market Value (USD Mn) Forecast by Suspension Type, 2020 to 2035
- Table 78: Middle East & Africa Market Volume (Units) Forecast by Suspension Type, 2020 to 2035
- Table 79: Middle East & Africa Market Value (USD Mn) Forecast by Sales Channel, 2020 to 2035
- Table 80: Middle East & Africa Market Volume (Units) Forecast by Sales Channel, 2020 to 2035
List Of Figures
- Figure 1: Global Market Volume (Units) Forecast 2020 to 2035
- Figure 2: Global Market Pricing Analysis
- Figure 3: Global Market Value (USD Mn) Forecast 2020 to 2035
- Figure 4: Global Market Value Share and BPS Analysis by Technology, 2025 and 2035
- Figure 5: Global Market Y-o-Y Growth Comparison by Technology, 2025 to 2035
- Figure 6: Global Market Attractiveness Analysis by Technology
- Figure 7: Global Market Value Share and BPS Analysis by Vehicle Type, 2025 and 2035
- Figure 8: Global Market Y-o-Y Growth Comparison by Vehicle Type, 2025 to 2035
- Figure 9: Global Market Attractiveness Analysis by Vehicle Type
- Figure 10: Global Market Value Share and BPS Analysis by Suspension Type, 2025 and 2035
- Figure 11: Global Market Y-o-Y Growth Comparison by Suspension Type, 2025 to 2035
- Figure 12: Global Market Attractiveness Analysis by Suspension Type
- Figure 13: Global Market Value Share and BPS Analysis by Sales Channel, 2025 and 2035
- Figure 14: Global Market Y-o-Y Growth Comparison by Sales Channel, 2025 to 2035
- Figure 15: Global Market Attractiveness Analysis by Sales Channel
- Figure 16: Global Market Value (USD Mn) Share and BPS Analysis by Region, 2025 and 2035
- Figure 17: Global Market Y-o-Y Growth Comparison by Region, 2025 to 2035
- Figure 18: Global Market Attractiveness Analysis by Region
- Figure 19: North America Market Incremental $ Opportunity, 2025 to 2035
- Figure 20: Latin America Market Incremental $ Opportunity, 2025 to 2035
- Figure 21: Western Europe Market Incremental $ Opportunity, 2025 to 2035
- Figure 22: East Asia Market Incremental $ Opportunity, 2025 to 2035
- Figure 23: South Asia Pacific Market Incremental $ Opportunity, 2025 to 2035
- Figure 24: Eastern Europe Market Incremental $ Opportunity, 2025 to 2035
- Figure 25: Middle East & Africa Market Incremental $ Opportunity, 2025 to 2035
- Figure 26: North America Market Value Share and BPS Analysis by Country, 2025 and 2035
- Figure 27: North America Market Value Share and BPS Analysis by Technology, 2025 and 2035
- Figure 28: North America Market Y-o-Y Growth Comparison by Technology, 2025 to 2035
- Figure 29: North America Market Attractiveness Analysis by Technology
- Figure 30: North America Market Value Share and BPS Analysis by Vehicle Type, 2025 and 2035
- Figure 31: North America Market Y-o-Y Growth Comparison by Vehicle Type, 2025 to 2035
- Figure 32: North America Market Attractiveness Analysis by Vehicle Type
- Figure 33: North America Market Value Share and BPS Analysis by Suspension Type, 2025 and 2035
- Figure 34: North America Market Y-o-Y Growth Comparison by Suspension Type, 2025 to 2035
- Figure 35: North America Market Attractiveness Analysis by Suspension Type
- Figure 36: North America Market Value Share and BPS Analysis by Sales Channel, 2025 and 2035
- Figure 37: North America Market Y-o-Y Growth Comparison by Sales Channel, 2025 to 2035
- Figure 38: North America Market Attractiveness Analysis by Sales Channel
- Figure 39: Latin America Market Value Share and BPS Analysis by Country, 2025 and 2035
- Figure 40: Latin America Market Value Share and BPS Analysis by Technology, 2025 and 2035
- Figure 41: Latin America Market Y-o-Y Growth Comparison by Technology, 2025 to 2035
- Figure 42: Latin America Market Attractiveness Analysis by Technology
- Figure 43: Latin America Market Value Share and BPS Analysis by Vehicle Type, 2025 and 2035
- Figure 44: Latin America Market Y-o-Y Growth Comparison by Vehicle Type, 2025 to 2035
- Figure 45: Latin America Market Attractiveness Analysis by Vehicle Type
- Figure 46: Latin America Market Value Share and BPS Analysis by Suspension Type, 2025 and 2035
- Figure 47: Latin America Market Y-o-Y Growth Comparison by Suspension Type, 2025 to 2035
- Figure 48: Latin America Market Attractiveness Analysis by Suspension Type
- Figure 49: Latin America Market Value Share and BPS Analysis by Sales Channel, 2025 and 2035
- Figure 50: Latin America Market Y-o-Y Growth Comparison by Sales Channel, 2025 to 2035
- Figure 51: Latin America Market Attractiveness Analysis by Sales Channel
- Figure 52: Western Europe Market Value Share and BPS Analysis by Country, 2025 and 2035
- Figure 53: Western Europe Market Value Share and BPS Analysis by Technology, 2025 and 2035
- Figure 54: Western Europe Market Y-o-Y Growth Comparison by Technology, 2025 to 2035
- Figure 55: Western Europe Market Attractiveness Analysis by Technology
- Figure 56: Western Europe Market Value Share and BPS Analysis by Vehicle Type, 2025 and 2035
- Figure 57: Western Europe Market Y-o-Y Growth Comparison by Vehicle Type, 2025 to 2035
- Figure 58: Western Europe Market Attractiveness Analysis by Vehicle Type
- Figure 59: Western Europe Market Value Share and BPS Analysis by Suspension Type, 2025 and 2035
- Figure 60: Western Europe Market Y-o-Y Growth Comparison by Suspension Type, 2025 to 2035
- Figure 61: Western Europe Market Attractiveness Analysis by Suspension Type
- Figure 62: Western Europe Market Value Share and BPS Analysis by Sales Channel, 2025 and 2035
- Figure 63: Western Europe Market Y-o-Y Growth Comparison by Sales Channel, 2025 to 2035
- Figure 64: Western Europe Market Attractiveness Analysis by Sales Channel
- Figure 65: East Asia Market Value Share and BPS Analysis by Country, 2025 and 2035
- Figure 66: East Asia Market Value Share and BPS Analysis by Technology, 2025 and 2035
- Figure 67: East Asia Market Y-o-Y Growth Comparison by Technology, 2025 to 2035
- Figure 68: East Asia Market Attractiveness Analysis by Technology
- Figure 69: East Asia Market Value Share and BPS Analysis by Vehicle Type, 2025 and 2035
- Figure 70: East Asia Market Y-o-Y Growth Comparison by Vehicle Type, 2025 to 2035
- Figure 71: East Asia Market Attractiveness Analysis by Vehicle Type
- Figure 72: East Asia Market Value Share and BPS Analysis by Suspension Type, 2025 and 2035
- Figure 73: East Asia Market Y-o-Y Growth Comparison by Suspension Type, 2025 to 2035
- Figure 74: East Asia Market Attractiveness Analysis by Suspension Type
- Figure 75: East Asia Market Value Share and BPS Analysis by Sales Channel, 2025 and 2035
- Figure 76: East Asia Market Y-o-Y Growth Comparison by Sales Channel, 2025 to 2035
- Figure 77: East Asia Market Attractiveness Analysis by Sales Channel
- Figure 78: South Asia Pacific Market Value Share and BPS Analysis by Country, 2025 and 2035
- Figure 79: South Asia Pacific Market Value Share and BPS Analysis by Technology, 2025 and 2035
- Figure 80: South Asia Pacific Market Y-o-Y Growth Comparison by Technology, 2025 to 2035
- Figure 81: South Asia Pacific Market Attractiveness Analysis by Technology
- Figure 82: South Asia Pacific Market Value Share and BPS Analysis by Vehicle Type, 2025 and 2035
- Figure 83: South Asia Pacific Market Y-o-Y Growth Comparison by Vehicle Type, 2025 to 2035
- Figure 84: South Asia Pacific Market Attractiveness Analysis by Vehicle Type
- Figure 85: South Asia Pacific Market Value Share and BPS Analysis by Suspension Type, 2025 and 2035
- Figure 86: South Asia Pacific Market Y-o-Y Growth Comparison by Suspension Type, 2025 to 2035
- Figure 87: South Asia Pacific Market Attractiveness Analysis by Suspension Type
- Figure 88: South Asia Pacific Market Value Share and BPS Analysis by Sales Channel, 2025 and 2035
- Figure 89: South Asia Pacific Market Y-o-Y Growth Comparison by Sales Channel, 2025 to 2035
- Figure 90: South Asia Pacific Market Attractiveness Analysis by Sales Channel
- Figure 91: Eastern Europe Market Value Share and BPS Analysis by Country, 2025 and 2035
- Figure 92: Eastern Europe Market Value Share and BPS Analysis by Technology, 2025 and 2035
- Figure 93: Eastern Europe Market Y-o-Y Growth Comparison by Technology, 2025 to 2035
- Figure 94: Eastern Europe Market Attractiveness Analysis by Technology
- Figure 95: Eastern Europe Market Value Share and BPS Analysis by Vehicle Type, 2025 and 2035
- Figure 96: Eastern Europe Market Y-o-Y Growth Comparison by Vehicle Type, 2025 to 2035
- Figure 97: Eastern Europe Market Attractiveness Analysis by Vehicle Type
- Figure 98: Eastern Europe Market Value Share and BPS Analysis by Suspension Type, 2025 and 2035
- Figure 99: Eastern Europe Market Y-o-Y Growth Comparison by Suspension Type, 2025 to 2035
- Figure 100: Eastern Europe Market Attractiveness Analysis by Suspension Type
- Figure 101: Eastern Europe Market Value Share and BPS Analysis by Sales Channel, 2025 and 2035
- Figure 102: Eastern Europe Market Y-o-Y Growth Comparison by Sales Channel, 2025 to 2035
- Figure 103: Eastern Europe Market Attractiveness Analysis by Sales Channel
- Figure 104: Middle East & Africa Market Value Share and BPS Analysis by Country, 2025 and 2035
- Figure 105: Middle East & Africa Market Value Share and BPS Analysis by Technology, 2025 and 2035
- Figure 106: Middle East & Africa Market Y-o-Y Growth Comparison by Technology, 2025 to 2035
- Figure 107: Middle East & Africa Market Attractiveness Analysis by Technology
- Figure 108: Middle East & Africa Market Value Share and BPS Analysis by Vehicle Type, 2025 and 2035
- Figure 109: Middle East & Africa Market Y-o-Y Growth Comparison by Vehicle Type, 2025 to 2035
- Figure 110: Middle East & Africa Market Attractiveness Analysis by Vehicle Type
- Figure 111: Middle East & Africa Market Value Share and BPS Analysis by Suspension Type, 2025 and 2035
- Figure 112: Middle East & Africa Market Y-o-Y Growth Comparison by Suspension Type, 2025 to 2035
- Figure 113: Middle East & Africa Market Attractiveness Analysis by Suspension Type
- Figure 114: Middle East & Africa Market Value Share and BPS Analysis by Sales Channel, 2025 and 2035
- Figure 115: Middle East & Africa Market Y-o-Y Growth Comparison by Sales Channel, 2025 to 2035
- Figure 116: Middle East & Africa Market Attractiveness Analysis by Sales Channel
- Figure 117: Global Market - Tier Structure Analysis
- Figure 118: Global Market - Company Share Analysis
- FAQs -
What is the global regenerative suspension system market size in 2025?
The regenerative suspension system is valued at USD 643.4 million in 2025.
What is the estimated valuation of the regenerative suspension system market by 2035?
The regenerative suspension system market is expected to reach USD 9,948.1 million by 2035.
Who are the major players operating in the regenerative suspension system market?
Leading players include ZF Friedrichshafen, Tenneco, Continental AG, Audi, Tesla, ClearMotion, and BYD.
What value CAGR is the regenerative suspension system market exhibit over the last five years?
The historic growth rate of regenerative suspension system market was 12.2% from 2020 to 2024.