- Market Value (2025): USD 578.7 Mn
- Estimated Value (2026): USD 640.0 Mn
- Forecast Value (2036): USD 1752.8 Mn
- CAGR (2026-2036): 10.6%
What is the Renewable Polymer Feedstocks Market forecast to be worth by 2036?
USD 640.0 million in 2026 to USD 1,752.8 million by 2036 at a 10.6% CAGR.
- The Renewable Polymer Feedstocks Market reached USD 578.7 million in 2025.
- Demand is projected to increase from USD 640.0 million in 2026 to USD 1,752.8 million by 2036.
- The market is forecast to record 10.6% CAGR from 2026 to 2036.
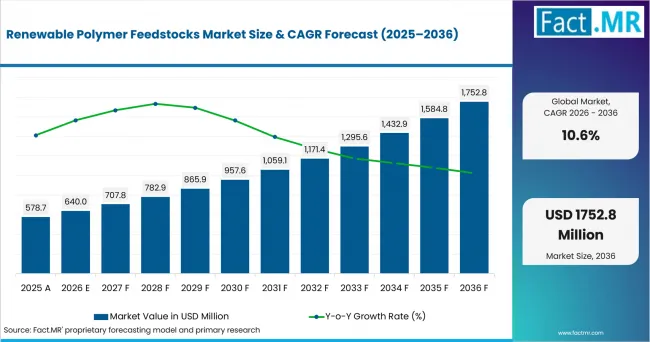
Renewable Polymer Feedstocks Market Value Analysis | Source: Fact.MR
What are the defining numbers behind Renewable Polymer Feedstocks Market growth?
An absolute opportunity of USD 1,112.8 million is expected between 2026 and 2036.
- Demand Drivers in the Market
- Polymer producers need drop-in renewable hydrocarbons that fit PE and PP assets, since resin qualification favors limited process change.
- Packaging converters need verified renewable attribution. HMRC reported in August 2025 that 38% of UK plastic packaging tonnage in financial year 2024 to 2025 was taxable under Plastic Packaging Tax.
- Chemical manufacturers need ethanol-derived intermediates for bio-ethylene routes. EIA’s July 2026 release listed U.S. fuel ethanol operable production capacity at 18,386 million gallons per year in January 2026.
- Compounders need plant-oil monomers for durable polymers where strength and heat behavior carry more weight than compostability claims.
- European resin users need audited mass-balance routes because certification makes renewable feedstock claims easier to review.
- Key Segments Analyzed
- By Renewable Feedstock: Bio-naphtha and renewable hydrocarbons are expected to hold 34.00% share in 2026 because they serve drop-in PE and PP production routes.
- By Attribution Route: Mass-balance is projected to account for 38.00% share in 2026 owing to certification systems that connect mixed feedstock streams with polymer claims.
- By Polymer and Intermediate Output: Renewable PE and PP are anticipated to capture 31.00% share in 2026 supported by familiar processing windows and broad converter experience.
- By End-use: Packaging is estimated to represent 38.00% share in 2026 since rigid and flexible formats give resin users a clear route for renewable content claims.
- Analyst Opinion at Fact.MR
- Shambhu Nath Jha, Principal Consultant at Fact.MR, states, “Renewable polymer feedstocks are being judged by proof. The market is expected to favor routes that combine resin performance with auditable chain-of-custody records. Suppliers need certified sourcing and application testing.”
- Strategic Implications
- Feedstock producers should document carbon route, certificate system and feedstock origin before approaching resin manufacturers.
- Polymer converters should qualify renewable PE and PP in packaging lines first, since process familiarity reduces approval time.
- Brand owners should separate bio-based content claims from recycled-content claims so customer communication stays clear.
- Technology licensors should show how bio-ethanol, sugars and plant oils convert into polymer-grade intermediates at commercial quality.
The USA is projected to post 12.0% CAGR through 2036 driven by ethanol capacity and plastics conversion depth. Brazil is forecast to advance at 11.3% CAGR owing to sugarcane ethanol and bio-based polyethylene. Germany is anticipated to record 10.1% CAGR supported by EU policy and chemical qualification. The Netherlands is estimated to reach 9.5% CAGR shaped by logistics. The UK is expected to hold 8.9% CAGR due to packaging tax pressure.
How does the Renewable Polymer Feedstocks Market break down by segment?
Bio-naphtha and renewable hydrocarbons lead at 34.0%; Mass-balance leads at 38.0%.
Which Renewable Feedstock dominates?
Bio-naphtha and renewable hydrocarbons hold 34.0% share in 2026.
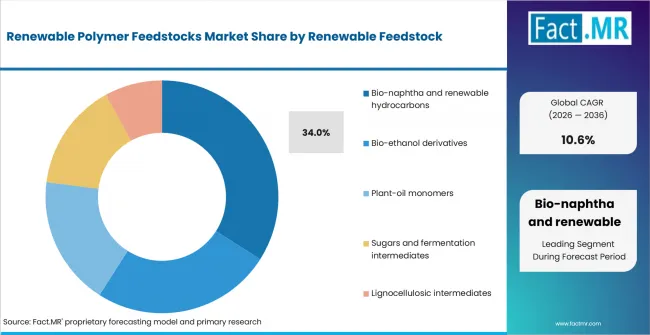
Renewable Polymer Feedstocks Market Analysis By Renewable Feedstock | Source: Fact.MR
Bio-naphtha and renewable hydrocarbons are expected to lead renewable feedstock revenue at 34.0% share in 2026 because they suit cracker and polyolefin systems. Bio-ethanol derivatives serve bio-ethylene where ethanol supply is dependable. Plant-oil monomers address specialty resin needs. The European Commission Joint Research Centre stated in March 2026 that bio-based and biodegradable plastics accounted for roughly 0.5% of total global plastics production in 2025.
What leads the Attribution Route segment?
Mass-balance accounts for 38.0% share in 2026.
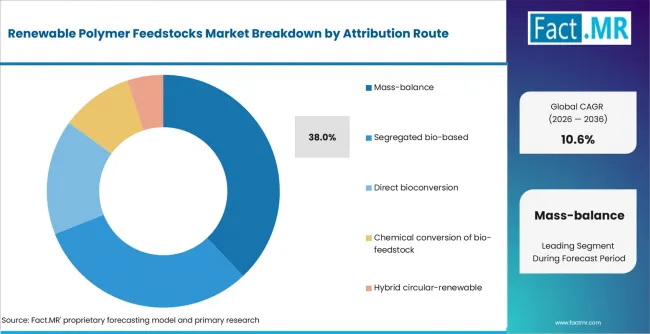
Renewable Polymer Feedstocks Market Analysis By Attribution Route | Source: Fact.MR
Mass-balance is projected to account for 38.0% of attribution-route spending in 2026 as suppliers blend renewable input into established chemical systems. Segregated bio-based supply fits physical separation needs. Direct bioconversion serves fermentation-derived materials. BASF introduced Ultrason E 2010 BMB in March 2025 with renewable feedstock from organic waste through ISCC PLUS certification.
How does Polymer and Intermediate Output shape demand?
Renewable PE and PP hold 31.0% share in 2026.
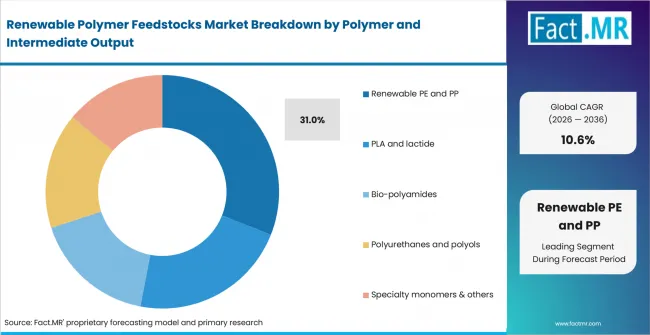
Renewable Polymer Feedstocks Market Analysis By Polymer And Intermediate Output | Source: Fact.MR
Renewable PE and PP are anticipated to represent 31.0% share in 2026 supported by familiar polyolefin applications. PLA and lactide remain central where bio-based positioning is part of the product brief. Bio-polyamides serve parts needing heat behavior. TotalEnergies Corbion’s June 2025 LCA results showed up to 85% lower carbon footprint for Luminy PLA than conventional plastics when biogenic carbon is included.
What supports Packaging within End-use?
Packaging represents 38.0% share in 2026.
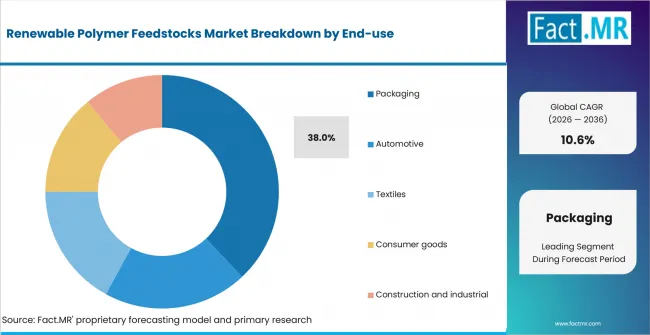
Renewable Polymer Feedstocks Market Analysis By End Use | Source: Fact.MR
Packaging is estimated to represent 38.00% share in 2026 because converters test renewable PE, PP and PLA across common formats. Automotive uses bio-polyamides where part approval depends on mechanical performance.
What is accelerating Renewable Polymer Feedstocks Market adoption, and what is holding it back?
Drop-in hydrocarbon routes drive it; certification cost restrains it.
Drivers Impact Analysis
| DRIVER | (~) % IMPACT ON CAGR | GEOGRAPHIC RELEVANCE | IMPACT TIMELINE |
|---|---|---|---|
| Drop-in renewable hydrocarbon routes | +1.8% | Global | Short term (<= 2 years) |
| Ethanol-to-olefin conversion capacity | +1.5% | USA, Brazil | Medium term (2-4 years) |
| Mass-balance certification systems | +1.2% | Europe, North America | Short term (<= 2 years) |
| Packaging material substitution | +1.0% | USA, UK, Germany | Medium term (2-4 years) |
| Plant-oil monomers for durable polymers | +0.8% | Europe, Brazil, Asia Pacific | Long term (>= 4 years) |
Source: Fact.MR analysis. Updated Sep 3, 2026
- Drop-in renewable hydrocarbon routes: Renewable hydrocarbon feedstocks can reduce switching friction for polyethylene and polypropylene users by fitting established polymer-processing infrastructure. Drop-in compatibility supports broader trials where converters want lower-carbon material options without major equipment or formulation changes.
- Ethanol-to-olefin conversion capacity: Ethanol-based routes can support renewable ethylene production and strengthen bio-based polymer supply. Regions with established ethanol industries are well positioned to connect agricultural feedstocks with downstream polyethylene and other olefin-based materials.
- Mass-balance certification systems: Certified chain-of-custody approaches can improve acceptance of renewable feedstock attribution across polymer and chemical markets. Mass balance, physical segregation, and controlled blending give manufacturers different pathways for documenting renewable content within existing production networks.
- Packaging material substitution: Packaging converters are expanding renewable resin trials as customer reporting, sustainability targets, and material-policy requirements influence purchasing decisions. Renewable polyethylene and polypropylene can provide substitution routes where processors need familiar performance alongside improved feedstock positioning.
- Plant-oil monomers for durable polymers: Plant-oil-derived monomers create opportunities in durable bio-based polymers such as polyamides. These materials can support applications requiring mechanical strength, thermal performance, and long service life while reducing reliance on conventional fossil-derived feedstocks.
Opportunity Impact Analysis
| OPPORTUNITY | (~) % IMPACT ON CAGR | GEOGRAPHIC RELEVANCE | IMPACT TIMELINE |
|---|---|---|---|
| Renewable naphtha co-processing | +1.1% | Europe, North America | Medium term (2-4 years) |
| Bio-ethanol derivative expansion | +0.9% | Brazil, USA | Long term (>= 4 years) |
| Certified mass-balance claims | +0.7% | Europe, UK | Short term (<= 2 years) |
| PLA and lactide application growth | +0.6% | Europe, Asia Pacific | Medium term (2-4 years) |
Source: Fact.MR analysis. Updated Sep 3, 2026
- Renewable naphtha co-processing: Co-processing can widen renewable feedstock options for existing crackers and refinery systems. The approach allows producers to introduce renewable raw materials while using established infrastructure, creating a practical route for supplying lower-carbon feedstocks to polymer and chemical manufacturers.
- Bio-ethanol derivative expansion: Bio-ethanol conversion supports renewable ethylene production in regions with established ethanol supply. This route can strengthen the availability of bio-based olefins for polyethylene and other downstream polymers while linking renewable feedstocks with existing petrochemical value chains.
- Certified mass-balance claims: Mass-balance systems remain attractive for facilities that process renewable and conventional feedstocks together. Certification can help manufacturers attribute renewable inputs to finished polymer grades while maintaining established production assets and providing customers with documented chain-of-custody claims.
- PLA and lactide applications: PLA and lactide continue to gain relevance across packaging, consumer goods, and other applications seeking renewable polymer options. Their bio-based feedstock profile supports material substitution where manufacturers want lower-carbon positioning alongside established processing and product-performance requirements.
Restraints Impact Analysis
| RESTRAINT | (~) % IMPACT ON CAGR | GEOGRAPHIC RELEVANCE | IMPACT TIMELINE |
|---|---|---|---|
| Certification and chain-of-custody cost | -0.6% | Global | Short term (<= 2 years) |
| Small bio-based plastics production base | -0.5% | Europe, North America | Medium term (2-4 years) |
| Feedstock allocation between fuels and chemicals | -0.4% | USA, Brazil, UK | Medium term (2-4 years) |
| Resin qualification cycles | -0.3% | Automotive, electronics | Long term (>= 4 years) |
Source: Fact.MR analysis. Updated Sep 3, 2026
- Certification and chain-of-custody cost: Audited attribution systems add administrative and documentation work for converters and resin suppliers. Chain-of-custody approaches such as mass balance, physical segregation, and controlled blending require certified handling across participating sites, increasing qualification complexity for renewable feedstock programs.
- Small bio-based plastics production base: Bio-based plastics remain constrained by comparatively limited production scale and higher manufacturing costs. These conditions can weaken their cost position against conventional fossil-based plastics and slow adoption in applications where buyers prioritize material economics.
- Feedstock allocation between fuels and chemicals: Renewable hydrocarbons and alcohols can face competing demand from transport fuels and chemical production. This competition may tighten feedstock availability and affect pricing for polymer producers seeking renewable inputs for bio-based or mass-balanced resin systems.
- Resin qualification cycles: Renewable feedstock routes require application-specific testing before wider adoption in automotive and industrial parts. Material teams need to confirm mechanical performance, processing consistency, compatibility, and certification requirements, which can extend switching and commercial approval cycles.
Which countries are scaling the Renewable Polymer Feedstocks Market through 2036?
- The country comparison spans 3.03 percentage points across the forecast period.
- The USA remains 0.64 percentage point above Brazil through ethanol capacity and plastics conversion depth.
- Brazil remains 1.27 percentage points above Germany as sugarcane ethanol supports bio-based polyethylene supply.
- Germany remains 0.53 percentage point above the Netherlands through EU bioeconomy policy and chemical-sector qualification work.
- The Netherlands remains 0.59 percentage point above the UK through chemical logistics and converter-support programs.
- The UK closes the displayed range as packaging tax exposure and renewable fuel policy shape material substitution choices.
Comparable CAGRs create different entry conditions due to feedstock access, certification depth and converter readiness. Full report coverage includes North America, Latin America, Western Europe, Eastern Europe, East Asia, South Asia & Pacific, Middle East & Africa.
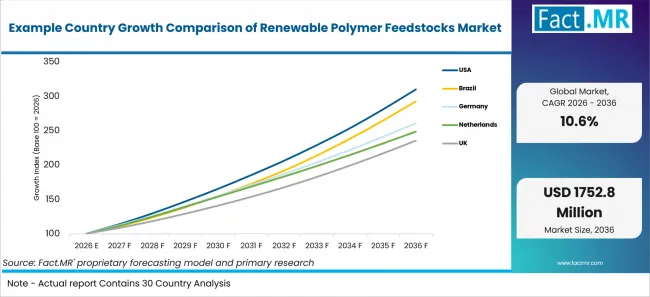
Example Country Growth Comparison Of Renewable Polymer Feedstocks Market | Source: Fact.MR
| Country | CAGR (2026-2036) |
|---|---|
| United States | 12.0% |
| Brazil | 11.3% |
| Germany | 10.1% |
| Netherlands | 9.5% |
| United Kingdom | 8.9% |
Source: Fact.MR analysis. Updated Sep 3, 2026
What supports USA adoption?
12.0% CAGR, supported by ethanol capacity and plastics conversion depth.
U.S. polymer producers evaluate renewable feedstocks by resin fit and certificate route. BEA reported in June 2026 that plastics and rubber parts manufacturing accounted for 21,800 current employees among acquired U.S. enterprises in 2025. The USA is projected to record 12.0% CAGR through 2036 as renewable PE and PP trials expand across converter networks.
How is Brazil scaling demand?
11.3% CAGR, driven by sugarcane ethanol and bio-based polyethylene capacity.
Brazil has a sugarcane base that fits ethanol-to-ethylene chemistry. Conab’s August 2026 survey estimated Brazil’s 2026/27 sugarcane crop at 705.2 million tonnes. Brazil is forecast to advance at 11.3% CAGR through 2036 because Braskem’s green ethylene route connects ethanol with bio-based polyethylene.
What supports Germany’s growth?
10.1% CAGR, backed by EU bioeconomy policy and chemical-sector conversion.
German converters require proof that renewable feedstock routes match polymer performance and customer rules. Destatis reported in July 2026 that calendar-adjusted manufacturing turnover in May 2026 was 4.2% higher than in May 2025. Germany is anticipated to record 10.1% CAGR through 2036 as chemical producers extend certified mass-balance options.
How is the Netherlands developing demand?
9.5% CAGR, driven by chemical logistics and converter support.
Dutch chemical and polymer users benefit from Rotterdam logistics and nearby conversion markets. RVO listed a EUR 13.0 million budget for SOPV 2025 to support production tests by plastic converters and compounders using increased amounts of recycled plastic or bio-based polymers. The Netherlands is estimated to reach 9.5% CAGR through 2036 as converter-support programs facilitate production testing with recycled or bio-based plastics.
What underpins UK growth?
8.9% CAGR, supported by packaging tax exposure and renewable fuel policy.
UK packaging converters weigh renewable feedstocks against recycled-content rules and customer checks. The Department for Transport reported in July 2026 that the SAF Mandate starts at 2% of UK jet fuel demand in 2025. The UK is expected to hold 8.9% CAGR through 2036 as renewable hydrocarbon logistics support material review.
Who leads the Renewable Polymer Feedstocks Market?
Neste and Braskem lead direct renewable feedstock coverage, while BASF strengthens certified attribution routes.
Neste is active through renewable feedstock for polymers and chemicals, including segregated renewable-hydrocarbon and refinery co-processing routes. Braskem is active through its ethanol-to-renewable-ethylene pathway and I’m green™ bio-based polyethylene. BASF adds certified biomass-balanced polymer coverage through Ultrason® E 2010 BMB.
TotalEnergies Corbion is active through Luminy® PLA and Lumilact® lactide products. Arkema adds castor-oil-based Rilsan® PA11 to the competitive landscape. Competition is increasingly influenced by feedstock traceability, certification systems, material performance and customer application support.
Which companies are the key providers?
Key companies include Neste, Braskem, BASF, TotalEnergies Corbion, and Arkema.
- Neste
- Braskem
- BASF
- TotalEnergies Corbion
- Arkema
Bibliography
- U.S. Energy Information Administration. (2026, August 31). U.S. fuel ethanol production capacity (million gallons).
- U.S. Bureau of Economic Analysis. (2026, June 10). New foreign direct investment in the United States, 2025.
- Agência Nacional do Petróleo, Gás Natural e Biocombustíveis. (2026, June 30). ANP divulga dados consolidados do setor regulado em 2025.
- Companhia Nacional de Abastecimento. (2026, August 20). 2º Levantamento - Safra 2026/27.
- European Commission, Joint Research Centre. (2026, March 3). Bio-based plastics: Technology readiness and high cost key barriers to wide use.
- Federal Statistical Office (Destatis). (2026, July 6). New orders in manufacturing in May 2026: +1.9% on the previous month.
- Rijksdienst voor Ondernemend Nederland. (2026, February 5). Subsidie Omschakeling Plasticverwerkers 2025 (SOPV).
- HM Revenue & Customs. (2026, August 27). Plastic Packaging Tax (PPT) statistics commentary.
- Department for Transport. (2026, July 13). Sustainable Aviation Fuel (SAF) Mandate.
- Neste. (2025, November 10). Neste to receive EU Innovation Fund support for developing a new co-processing technology.
- Braskem. (2025, May 6). Celebrating 15 Years of I'm green bio-based with operation rates above nameplate capacity after expansion.
- BASF. (2025, March 4). The world's first biomass-balanced polyethersulfone (PESU).
- LyondellBasell. (2025, October 2). Henkel and LyondellBasell collaborate on bio-circular raw material solution for WC Frisch/Bref Toilet Rim Block cage.
- TotalEnergies Corbion. (2025, June 26). New Luminy® PLA LCA Results Released.
This Report Answers
- The report explains renewable feedstock use by type and attribution route. Polymer output and end use complete the assessment.
- Segment analysis identifies bio-naphtha and renewable hydrocarbons as the main feedstock position. It covers mass-balance routes, renewable PE and PP, and packaging.
- Country analysis reviews the United States and Brazil alongside Germany, the Netherlands and the United Kingdom. It assesses feedstock access and converter readiness.
- Competitive analysis reviews Neste, Braskem, BASF. TotalEnergies Corbion is assessed across PLA. Arkema is assessed across bio-polyamide routes.
- Application analysis assesses how packaging and automotive users evaluate renewable content. Textiles, consumer goods, construction and industrial uses are covered separately.
What does the Renewable Polymer Feedstocks Market cover?
Renewable hydrocarbons, bio-ethanol derivatives, plant-oil monomers and fermentation intermediates used for polymer production.
The Renewable Polymer Feedstocks Market covers renewable inputs converted into polymer intermediates or resin families. It includes feedstocks for renewable PE and PP, PLA and lactide, bio-polyamides and polyurethanes. Fermentation intermediates are treated as bio-based platform chemicals when they move into polymer-grade routes.
The market differs from finished bio-plastics because it measures upstream feedstock and intermediate routes. Finished goods are covered only when they explain resin adoption decisions.
What is included in the scope?
Renewable polymer feedstock systems used in qualified resin and intermediate production.
The scope includes bio-naphtha, renewable hydrocarbons and bio-feedstock routes, including plant-oil monomers and lignocellulosic intermediates. It links upstream renewable chemicals with resin systems that overlap with bio-based plastics and qualified converter applications. Coverage includes attribution routes such as mass-balance, segregated bio-based supply and direct bioconversion. PLA and lactide coverage connects to lactic acid value chains, while packaging applications link to sustainable plastic packaging where renewable resin choices support material substitution.
What is excluded from the scope?
Finished plastic goods and recycled plastic feedstocks are outside the scope.
The scope excludes finished packaging formats, finished consumer goods and recycled resin streams without renewable feedstock attribution. Conventional fossil naphtha, fossil ethylene and fossil propylene are outside the boundary.
Biofuels are excluded when they are sold only for energy use. A renewable fuel stream is included only when a verified route directs it into polymer or chemical feedstock production.
How Was the Analysis Built?
The analysis draws on 120+ sources, 35+ company portfolios, 25+ countries, and more than 20 industry interviews.
- Primary Research: Primary research includes discussions with manufacturers, service providers, technology developers, distributors, end users, and subject-matter experts. These conversations examine purchasing priorities, product adoption, operational challenges, approval requirements, competitive positioning, and the factors that influence wider market acceptance.
- Desk Research: Desk research covers government statistics, regulatory publications, company filings, trade data, technical studies, industry associations, standards, public policy, and other authoritative sources. Every source used in the analysis is documented in the bibliography.
- Market Sizing and Forecasting: Market estimates combine historical performance, demand indicators, pricing and volume trends, segment shares, company participation, country-level growth, adoption patterns, investment activity, and barriers to market expansion.
- Data Validation and Update Cycle: Findings are validated by comparing primary interviews with public data, company activity, regulatory changes, trade patterns, and industry developments. Regular updates review new product launches, capacity changes, partnerships, approvals, and shifts in commercial adoption.
Segmentation
What is the report’s scope and coverage?
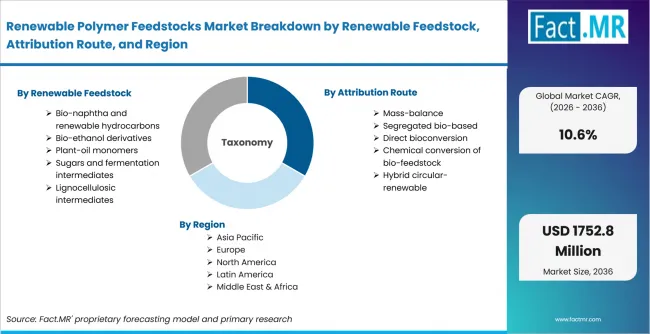
Renewable Polymer Feedstocks Market Breakdown By Renewable Feedstock, Attribution Route, And Region | Source: Fact.MR
| Attribute | Details |
|---|---|
| Quantitative Units | USD million |
| Market Definition | Renewable feedstocks used to produce polymer intermediates and resin outputs including renewable hydrocarbons, bio-ethanol derivatives, plant-oil monomers, sugars, fermentation intermediates and lignocellulosic intermediates. |
| Renewable Feedstock | Bio-naphtha and renewable hydrocarbons; Bio-ethanol derivatives; Plant-oil monomers; Sugars and fermentation intermediates; Lignocellulosic intermediates |
| Attribution Route | Mass-balance; Segregated bio-based; Direct bioconversion; Chemical conversion of bio-feedstock; Hybrid circular-renewable |
| Polymer and Intermediate Output | Renewable PE and PP; PLA and lactide; Bio-polyamides; Polyurethanes and polyols; Specialty monomers and others |
| End-use | Packaging; Automotive; Textiles; Consumer goods; Construction and industrial |
| Regions Covered | North America; Latin America; Western Europe; Eastern Europe; East Asia; South Asia & Pacific; Middle East & Africa |
| Countries Covered | United States; Brazil; Germany; Netherlands; United Kingdom |
| Key Companies Profiled | Neste; Braskem; BASF; TotalEnergies Corbion; Arkema |
| Forecast Period | 2026 to 2036 |
| Approach | Hybrid top-down and bottom-up approach using feedstock availability, conversion routes, resin qualification behavior, segment shares, country adoption and provider portfolio review. |
Source: Fact.MR analysis. Updated Sep 3, 2026
How is the market segmented?
-
By Renewable Feedstock
- Bio-naphtha and renewable hydrocarbons
- Bio-ethanol derivatives
- Plant-oil monomers
- Sugars and fermentation intermediates
- Lignocellulosic intermediates
-
By Attribution Route
- Mass-balance
- Segregated bio-based
- Direct bioconversion
- Chemical conversion of bio-feedstock
- Hybrid circular-renewable
-
By Polymer and Intermediate Output
- Renewable PE and PP
- PLA and lactide
- Bio-polyamides
- Polyurethanes and polyols
- Specialty monomers and others
-
By End-use
- Packaging
- Automotive
- Textiles
- Consumer goods
- Construction and industrial
-
By Region
- North America
- Latin America
- Western Europe
- Eastern Europe
- East Asia
- South Asia & Pacific
- Middle East & Africa
Frequently Asked Questions
How big is the renewable polymer feedstocks market in 2026?
What is the CAGR of the renewable polymer feedstocks market from 2026 to 2036?
Which renewable feedstock leads the renewable polymer feedstocks market?
Which attribution route leads the renewable polymer feedstocks market?
Who are the leading companies in the renewable polymer feedstocks market?
Who worked on this report


Preview the report firsthand - request a free sample
Free SampleGet the brochure for pricing and purchase details
Download PDF