- Market Value (2025): USD 155.6 Bn
- Estimated Value (2026): USD 165.7 Bn
- Forecast Value (2036): USD 311.0 Bn
- CAGR (2026-2036): 6.5%
What is the Bio-Feedstock Market forecast to be worth by 2036?
USD 165.7 billion in 2026 to USD 311.0 billion by 2036 at a 6.5% CAGR.
- The bio-feedstock market crossed a valuation of USD 155.6 billion in 2025.
- Demand is projected from USD 165.7 billion in 2026 to USD 311.0 billion by 2036.
- The market is forecast to record 6.5% CAGR from 2026 to 2036 as producers secure renewable carbon inputs.
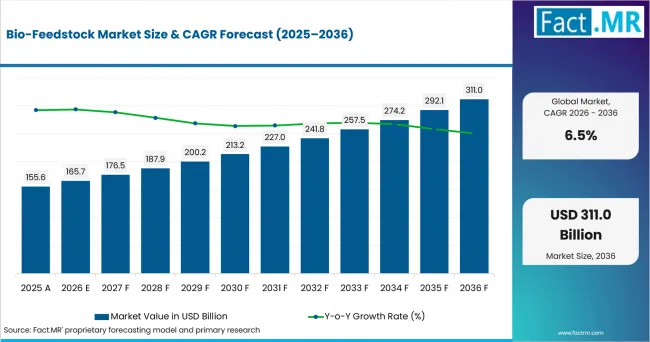
Bio Feedstock Market Value Analysis | Source: Fact.MR
What are the defining numbers behind Bio-Feedstock Market growth?
USD 145.3 billion absolute opportunity between 2026 and 2036.
- Demand Drivers in the Market
- Biofuel producers need reliable corn, sugarcane, oilseed and waste-oil supply for ethanol, biodiesel and renewable diesel production.
- Chemical manufacturers need biomass carbon for platform chemicals and polymer intermediates, especially where buyers ask for renewable-content documentation.
- Utilities need forestry residue, municipal waste and biogas feedstock where biomass power and renewable heat remain part of energy planning.
- Material producers need cellulose and sugarcane ethanol streams that connect renewable feedstock quality with finished resin performance.
- Key Segments Analyzed
- By Product: Agricultural Feedstocks are expected to hold 57.40% share in 2026 because crop streams already move through established farm handling systems.
- By Application: Biofuel Production is projected to account for 41.80% share in 2026 supported by ethanol, biodiesel and renewable diesel use.
- By End Use: Energy Industry is anticipated to capture 74.60% share in 2026 owing to large-volume fuel and power conversion demand.
- By Technology: Biochemical Conversion Technology is estimated to represent 63.70% share in 2026 driven by fermentation routes.
- By Formulation: Solid Feedstock Formulations are forecast to hold 36.90% share in 2026 as raw biomass remains practical to store and move.
- By Distribution Channel: Direct Supply Agreements are projected to account for 52.80% share in 2026 since larger plants need repeat deliveries with origin records.
- Analyst Opinion at Fact.MR
- Shambhu Nath Jha, Principal Consultant at Fact.MR, states, “Bio-feedstock has become a supply-discipline market. Plant operators evaluate quality, traceability and conversion yield before price alone. Suppliers that combine pre-processing, documentation and repeat delivery are expected to gain stronger buyer attention.”
- Strategic Implications
- Feedstock suppliers should document origin, moisture and delivery consistency before negotiating multi-year supply agreements.
- Biofuel producers should diversify crop, oilseed and waste streams to avoid dependence on a single harvest cycle.
- Aggregators should invest in densification, sorting and traceability systems that reduce handling losses and downtime.
Germany is expected to record 7.5% CAGR through 2036, led by biomass auctions and renewable heat use. Brazil is projected to post 6.8% CAGR supported by sugarcane ethanol and corn ethanol routes. The USA is anticipated to reach 6.2% CAGR as biofuel plants maintain large corn and oilseed needs. The UK is estimated to advance at 5.5% CAGR due to RTFO reporting and cereal availability. Japan is forecast to record 4.9% CAGR shaped by biomass power rules and municipal waste recovery.
How does the Bio-Feedstock Market break down by segment?
Energy Industry leads at 74.6%; Agricultural Feedstocks lead at 57.4% share.
Which Product dominates?
Agricultural Feedstocks are expected to hold 57.4% share in 2026.
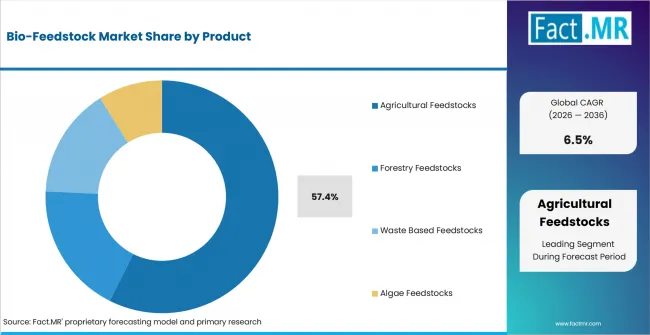
Bio Feedstock Market Analysis By Product | Source: Fact.MR
Agricultural feedstocks are expected to lead because farm crops and residues already have handling channels. Energy crops and oilseeds fit fuel production. Forestry and waste streams support heat, power and cellulosic conversion. USDA ERS reported in May 2026 that U.S. fuel ethanol used 5.44 billion bushels of corn in 2024/25, linking crop supply directly with conversion demand.
What leads the Application segment?
Biofuel Production is projected to account for 41.8% share in 2026.
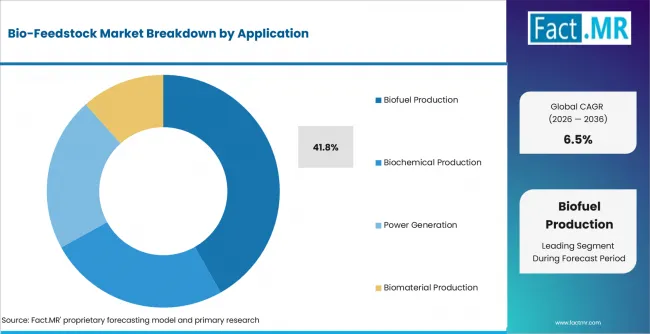
Bio Feedstock Market Analysis By Application | Source: Fact.MR
Biofuel production is projected to lead supported by ethanol, biodiesel and renewable diesel plant purchasing. Sugarcane mills, corn ethanol plants and oilseed processors need repeat input streams.
How does End Use shape demand?
Energy Industry is anticipated to capture 74.6% share in 2026.
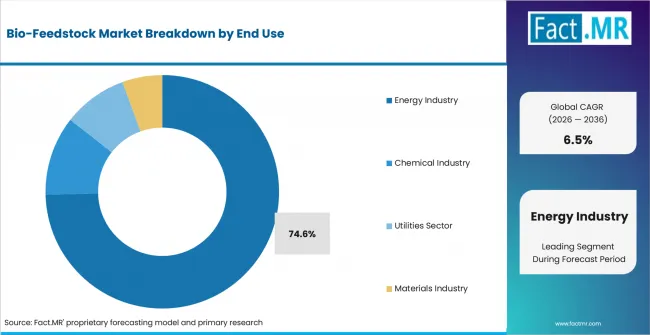
Bio Feedstock Market Analysis By End Use | Source: Fact.MR
Energy industry demand is anticipated to account for most volume because fuel producers and utilities operate large conversion assets. Renewable diesel and ethanol plants buy feedstock in repeat lots. Bio-feedstock use also connects with carbon-neutral fuels where biomass and organic waste streams influence fuel economics.
What supports Technology demand?
Biochemical Conversion Technology is estimated to represent 63.7% share in 2026.
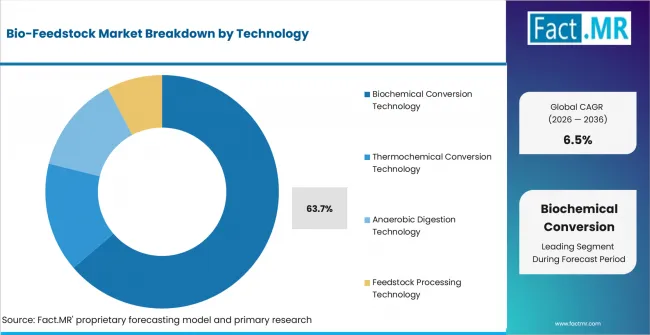
Bio Feedstock Market Analysis By Technology | Source: Fact.MR
Biochemical conversion is estimated to lead because fermentation and enzymatic routes fit ethanol and biochemical production. Thermochemical routes remain relevant where mixed or dry waste streams need gasification or pyrolysis.
What leads the Formulation segment?
Solid Feedstock Formulations are forecast to hold 36.9% share in 2026.
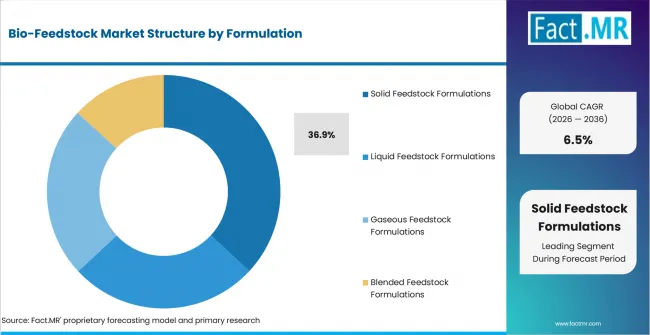
Bio Feedstock Market Analysis By Formulation | Source: Fact.MR
Solid formulations are forecast to lead as raw biomass, chips, pellets and bales remain practical to store. Densified materials reduce transport cost per energy unit. The segment also connects with renewable heating fuels where biomass pellets and solid streams influence heating supply chains.
How does Distribution Channel shape supply?
Direct Supply Agreements are projected to account for 52.8% share in 2026.
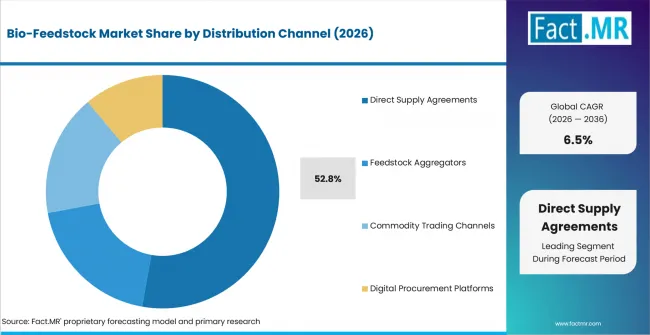
Bio Feedstock Market Analysis By Distribution Channel | Source: Fact.MR
Direct supply agreements are projected to lead because large plants need repeat deliveries with defined quality. Aggregators serve scattered feedstock where farm or waste volumes are smaller. Digital sourcing platforms help compare verified lots without replacing physical testing, storage and delivery capability.
What is accelerating Bio-Feedstock Market adoption, and what is holding it back?
Biofuel capacity drives it; feedstock variability restrains it.
Drivers Impact Analysis
| Driver | (~) % Impact on CAGR | Geographic Relevance | Impact Timeline |
|---|---|---|---|
| Biofuel plant demand for crop and oilseed inputs | +1.4% | North America, Latin America, Europe | Short term (<= 2 years) |
| Agricultural and forestry residue aggregation | +1.1% | Germany, UK, Japan | Medium term (2-4 years) |
| Biochemical conversion routes | +0.9% | Global | Medium term (2-4 years) |
| Bio-based polymer and chemical feedstock needs | +0.7% | Brazil, Europe, Japan | Long term (>= 4 years) |
| Documented direct supply agreements | +0.5% | Global | Short term (<= 2 years) |
Source: Fact.MR analysis. Updated Sep 1, 2026
- Biofuel plant demand for crop and oilseed inputs: Biofuel facilities require reliable streams of crop and oilseed feedstocks to maintain continuous production. Expanding renewable fuel capacity supports demand for consistent feedstock supply, quality control, and dependable delivery arrangements.
- Agricultural and forestry residue aggregation: Aggregation systems help move straw, wood chips, and harvest by-products into biofuel, biomethane, and heat applications. Coordinated collection, storage, and transport can improve feedstock availability while supporting broader use of agricultural and forestry residues.
- Biochemical conversion routes: Biochemical conversion processes favor clean and consistent sugar, starch, and cellulose feedstocks. Feedstock testing and quality management can improve conversion efficiency, support predictable yields, and reduce plant interruptions.
Opportunity Impact Analysis
| Opportunity | (~) % Impact on CAGR | Geographic Relevance | Impact Timeline |
|---|---|---|---|
| Waste-based feedstock recovery | +1.0% | Japan, Europe, North America | Medium term (2-4 years) |
| Biorefineries using several input streams | +0.8% | Global | Long term (>= 4 years) |
| Densified biomass logistics | +0.6% | Germany, UK, Japan | Medium term (2-4 years) |
| Bio-based material applications | +0.5% | Brazil, Europe, East Asia | Long term (>= 4 years) |
Source: Fact.MR analysis. Updated Sep 1, 2026
- Waste-based feedstock recovery: Waste oils, tallow and municipal waste provide renewable feedstock options beyond conventional crop-based inputs. Recovery and sorting systems can expand usable material supply while supporting fuel and chemical production from waste streams.
- Biorefineries using several input streams: Integrated biorefineries can process multiple feedstock types, creating demand for flexible sourcing and preprocessing systems. Plants designed around mixed inputs can improve feedstock resilience and support broader use of municipal, agricultural and industrial waste materials.
- Densified biomass logistics: Densification improves the movement and storage of residues collected from dispersed farms and forests. Pellets, chips and bales increase storage efficiency, simplify handling and help create more reliable biomass supply chains for industrial users.
Restraints Impact Analysis
| Restraint | (~) % Impact on CAGR | Geographic Relevance | Impact Timeline |
|---|---|---|---|
| Seasonal crop and residue availability | -0.7% | Global | Short term (<= 2 years) |
| Competing food and feed uses | -0.6% | USA, Brazil, UK | Medium term (2-4 years) |
| Variable waste stream quality | -0.5% | Europe, Japan, North America | Medium term (2-4 years) |
| Policy eligibility changes | -0.4% | Germany, Japan, UK | Long term (>= 4 years) |
Source: Fact.MR analysis. Updated Sep 1, 2026
- Seasonal crop and residue availability: Harvest timing influences feedstock volume, moisture content and storage requirements. Local storage, drying and pre-treatment capacity can help smooth seasonal supply fluctuations and support more reliable delivery to conversion facilities.
- Competing food and feed uses: Corn, oilseeds and sugarcane also serve food, feed and export markets. Competition among end uses can tighten feedstock availability and influence pricing, requiring biofuel and biochemical producers to manage sourcing carefully.
- Variable waste stream quality: Waste oils, municipal waste and agricultural residues can vary in moisture, ash and contamination levels. Sorting, testing and pre-treatment therefore add cost and operational complexity before these materials enter conversion processes.
Which countries are scaling the Bio-Feedstock Market through 2036?
- The country comparison spans 2.6 percentage points and forms three practical growth bands across the forecast period.
- Germany remains 0.7 percentage point above Brazil through biomass auctions, crop residue availability and renewable heat use.
- Brazil remains 0.6 percentage point above the USA as sugarcane ethanol and corn ethanol routes expand feedstock use.
- The USA remains 0.7 percentage point above the UK through ethanol capacity, oilseed crushing and renewable diesel feedstock needs.
- The UK remains 0.6 percentage point above Japan as RTFO reporting and cereal supply support qualified feedstock channels.
- Japan closes the displayed range through biomass power rules, municipal waste recovery and woody biomass programs.
Comparable CAGRs create different entry conditions due to feedstock type, conversion route, documentation needs and policy eligibility. Full report coverage includes North America, Latin America, Western Europe, Eastern Europe, East Asia, South Asia & Pacific, Middle East & Africa.
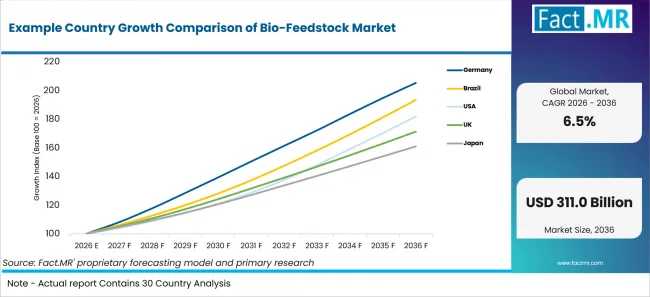
Example Country Growth Comparison Of Bio Feedstock Market | Source: Fact.MR
| Country | CAGR (2026-2036) |
|---|---|
| Germany | 7.5% |
| Brazil | 6.8% |
| USA | 6.2% |
| UK | 5.5% |
| Japan | 4.9% |
Source: Fact.MR analysis. Updated Sep 1, 2026
What supports Germany adoption?
7.5% CAGR, supported by biomass auctions and renewable heat use.
Destatis reported that Germany harvested 45 million tonnes of grain, including grain maize and corn-cob mix, in 2025. The German Environment Agency reported in March 2026 that solid, liquid and gaseous biomass supplied about 77% of Germany’s renewable heat in 2025. Germany is expected to record 7.5% CAGR through 2036 as residue aggregation, biogas and heat routes keep feedstock demand active.
How is Brazil scaling demand?
6.8% CAGR, driven by sugarcane ethanol and corn ethanol routes.
EPE reported in 2026 that sugarcane ethanol production reached 28.7 million cubic meters in 2025. ANP reported in December 2025 that distributors had retired about 38.18 million CBIOs by 22 December 2025. Brazil is projected to post 6.8% CAGR through 2036 as mills and fuel distributors maintain feedstock-linked decarbonization activity.
What supports the USA outlook?
6.2% CAGR, backed by ethanol capacity and oilseed processing.
EIA’s July 31, 2026 release lists U.S. fuel-ethanol operable production capacity at 18,374 million gallons per year for May 2026. USDA ERS reported in May 2026 that U.S. ethanol exports reached 2.13 billion gallons in the 2024/25 corn marketing year. The USA is anticipated to reach 6.2% CAGR through 2036 as large conversion assets keep crop and oilseed inputs in demand.
What supports the United Kingdom’s growth?
5.5% CAGR, supported by RTFO reporting and cereal supply.
Defra reported in January 2026 that the final 2025 UK wheat harvest reached 12 million tonnes. DfT published the fifth provisional RTFO 2025 release on July 23, 2026 using data available as of July 7, 2026. The UK is estimated to advance at 5.5% CAGR through 2036 as fuel reporting and arable residues support qualified supply chains.
How does Japan perform?
4.9% CAGR, led by biomass power rules and municipal waste recovery.
METI reported in April 2026 that renewable energy, including hydro, accounted for 23.1% of Japan’s FY2024 power generation mix. Japan’s Ministry of the Environment reported in March 2026 that 415 waste plants had power generation facilities in FY2024. Japan is forecast to record 4.9% CAGR through 2036 as waste recovery and biomass power rules guide feedstock selection.
Who leads the Bio-Feedstock Market?
ADM, Chevron Renewable Energy Group, and Suzano are active across agricultural, renewable fuel, forestry and bio-based polymer feedstock routes. ADM expanded its oilseed-processing strategy in July 2026 by announcing investments designed to unlock approximately 700,000 metric tons of additional annual crush capacity across four U.S. facilities. Chevron Renewable Energy Group increased its renewable diesel production capability in 2025 after the Geismar expansion raised plant capacity from 7,000 to 22,000 barrels per day.
Targray supplies used cooking oil, animal tallow, soybean oil and corn oil for renewable-fuel production. Competitive differentiation is shaped by feedstock traceability, pre-treatment and purification capability, quality consistency and reliable supply arrangements.
Which companies are the key providers?
Key companies include Archer Daniels Midland Company, Chevron Renewable Energy Group, Suzano S.A., and Targray Technology International Inc.
- Archer Daniels Midland Company
- Chevron Renewable Energy Group
- Suzano S.A.
- Targray Technology International Inc.
Bibliography
- Agência Nacional do Petróleo, Gás Natural e Biocombustíveis. (2025, December 23). RenovaBio: prazo para aposentadoria de CBIOs por distribuidores na B3 vai até 30/12.
- ADM. (2026, July 30). ADM to expand North America crush capacity amid strong biofuel demand.
- Bundesnetzagentur. (2026, June 9). Results of the April auctions for biomass and biomethane plants.
- Chevron Corporation. (2026, January 30). Chevron reports fourth quarter 2025 results.
- Companhia Nacional de Abastecimento. (2025, November 4). Clima adverso impacta produção de cana estimada pela Conab em 666,4 milhões de toneladas na safra 2025/26 [Audio news release].
- Department for Environment, Food & Rural Affairs. (2026, January 20). Cereal and oilseed production in the United Kingdom 2025.
- Department for Transport. (2026, July 23). Renewable Transport Fuel Obligation (RTFO) statistics 2025: Fifth provisional release.
- Empresa de Pesquisa Energética. (2026, July 2). Balanço Energético Nacional 2026.
- Federal Statistical Office (Destatis). (2026, January 23). 2025 grain and potato harvest: 45 million tons of grain and 14 million tons of potatoes.
- German Environment Agency. (2026, March 10). Renewable energies in figures.
- Ministry of Economy, Trade and Industry. (2025, March 21). METI sets the surcharge rate for FY2025, renewable energy purchase prices for FY2025 onward, and other details relating to the FIT and FIP schemes.
- Ministry of Economy, Trade and Industry. (2026, April 14). FY2024 Energy Supply and Demand Report (Revised Report).
- U.S. Department of Agriculture, National Agricultural Statistics Service. (2026, March 31). US farmers expect to plant less corn and more soybean acres.
- U.S. Energy Information Administration. (2026, July 31). U.S. total biofuels operable production capacity.
This Report Answers
- The report explains bio-feedstock use across product, application and technology categories.
- Segment analysis identifies Agricultural Feedstocks, Biofuel Production, Energy Industry and Direct Supply Agreements as major share positions.
- Country analysis examines Germany, Brazil, USA, UK and Japan using official crop, fuel and waste evidence.
- Competitive analysis reviews ADM, Chevron Renewable Energy Group, Suzano, and Targray.
- Application analysis assesses fuel, biochemical, power and biomaterial routes with attention to conversion fit.
- Supply analysis reviews direct agreements, aggregators, trading channels and digital sourcing platforms.
What does the Bio-Feedstock Market cover?
The Bio-Feedstock Market covers renewable biological raw materials used in conversion routes. It includes agricultural feedstocks, forestry inputs, waste-based streams and algae feedstocks bought for fuel, chemical, power, heat or material output.
The assessment differs from finished fuel coverage because the focus is the input stream. Related bio-feedstock coverage is therefore anchored in feedstock origin, quality and conversion suitability. Finished downstream products are treated as demand links when they shape input selection.
What is included in the scope?
The scope includes agricultural, forestry, waste-based and algae feedstocks used in biofuel, biochemical, power generation and biomaterial production. It includes energy crops, oilseed crops, wood residues, municipal waste, industrial waste, microalgae and macroalgae when they are sold for conversion.
Adjacent biorefinery platforms and aviation biomass fuels are referenced when feedstock choice shapes plant economics or qualification needs. The scope also includes solid, liquid, gaseous and blended feedstock forms, together with direct agreements and verified sourcing channels.
What is excluded from the scope?
Finished fuels, SAF, bioplastics and packaging products are outside the scope when sold without feedstock relevance. General agricultural commodities are also outside the scope unless sold into conversion. Equipment, plant engineering and fuel retailing are treated as adjacent markets.
How Was the Analysis Built?
The analysis draws on 120+ sources, 35+ company portfolios, 25+ countries, and more than 20 industry interviews.
- Primary Research: Primary research includes discussions with manufacturers, service providers, technology developers, distributors, end users, and subject-matter experts. These conversations examine purchasing priorities, product adoption, operational challenges, approval requirements, competitive positioning, and the factors that influence wider market acceptance.
- Desk Research: Desk research covers government statistics, regulatory publications, company filings, trade data, technical studies, industry associations, standards, public policy, and other authoritative sources. Every source used in the analysis is documented in the bibliography.
- Market Sizing and Forecasting: Market estimates combine historical performance, demand indicators, pricing and volume trends, segment shares, company participation, country-level growth, adoption patterns, investment activity, and barriers to market expansion.
- Data Validation and Update Cycle: Findings are validated by comparing primary interviews with public data, company activity, regulatory changes, trade patterns, and industry developments. Regular updates review new product launches, capacity changes, partnerships, approvals, and shifts in commercial adoption.
Segmentation
What is the report’s scope and coverage?
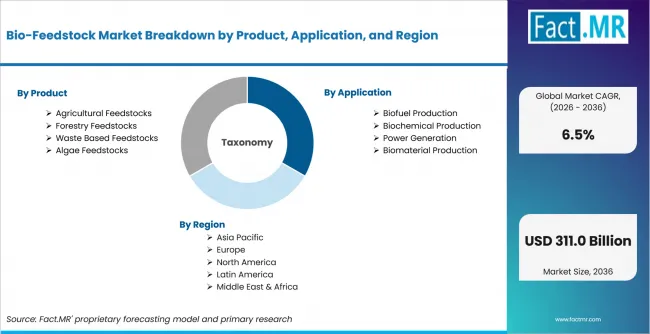
Bio Feedstock Market Breakdown By Product, Application, And Region | Source: Fact.MR
| Attribute | Details |
|---|---|
| Quantitative Units | USD billion |
| Market Definition | Renewable biological raw materials used for fuel, chemical, power, heat and material conversion. |
| Product | Agricultural Feedstocks; Forestry Feedstocks; Waste Based Feedstocks; Algae Feedstocks |
| Application | Biofuel Production; Biochemical Production; Power Generation; Biomaterial Production |
| End Use | Energy Industry; Chemical Industry; Utilities Sector; Materials Industry |
| Technology | Biochemical Conversion Technology; Thermochemical Conversion Technology; Anaerobic Digestion Technology; Feedstock Processing Technology |
| Formulation | Solid Feedstock Formulations; Liquid Feedstock Formulations; Gaseous Feedstock Formulations; Blended Feedstock Formulations |
| Distribution Channel | Direct Supply Agreements; Industrial Supply Contracts; Long Term Supply Contracts; Feedstock Aggregators; Agricultural Aggregators; Biomass Aggregators; Commodity Trading Channels; Biomass Trading Companies; Energy Commodity Firms; Digital Sourcing Platforms; Online Biomass Exchanges; Supplier Direct Platforms |
| Regions Covered | North America; Latin America; Western Europe; Eastern Europe; East Asia; South Asia & Pacific; Middle East & Africa |
| Countries Covered | Germany; Brazil; USA; UK; Japan |
| Key Companies Profiled | Archer Daniels Midland Company, Chevron Renewable Energy Group, Suzano S.A., and Targray Technology International Inc. |
| Forecast Period | 2026 to 2036 |
| Approach | Hybrid top-down and bottom-up approach using feedstock availability, application demand, conversion routes, country growth and provider portfolio review. |
Source: Fact.MR analysis. Updated Sep 1, 2026
How is the market segmented?
-
By Product
- Agricultural Feedstocks
- Energy Crops
- Oilseed Crops
- Forestry Feedstocks
- Wood Based Feedstocks
- Forest Residue Feedstocks
- Waste Based Feedstocks
- Municipal Waste Feedstocks
- Industrial Waste Feedstocks
- Algae Feedstocks
- Microalgae Feedstocks
- Macroalgae Feedstocks
- Agricultural Feedstocks
-
By Application
- Biofuel Production
- Liquid Biofuel Production
- Advanced Biofuel Production
- Biochemical Production
- Industrial Chemicals Production
- Specialty Chemical Production
- Power Generation
- Biomass Power Generation
- Biogas Energy Production
- Biomaterial Production
- Bioplastic Manufacturing
- Composite Material Manufacturing
- Biofuel Production
-
By End Use
- Energy Industry
- Fuel Producers
- Integrated Energy Companies
- Chemical Industry
- Industrial Chemical Manufacturers
- Specialty Chemical Companies
- Utilities Sector
- Power Generation Companies
- District Energy Providers
- Materials Industry
- Bioplastics Manufacturers
- Composite Manufacturers
- Energy Industry
-
By Technology
- Biochemical Conversion Technology
- Fermentation Technology
- Enzymatic Conversion Technology
- Thermochemical Conversion Technology
- Gasification Technology
- Pyrolysis Technology
- Anaerobic Digestion Technology
- Wet Digestion Systems
- Dry Digestion Systems
- Feedstock Processing Technology
- Mechanical Processing Systems
- Pre Treatment Systems
- Biochemical Conversion Technology
-
By Formulation
- Solid Feedstock Formulations
- Raw Biomass Feedstocks
- Densified Feedstocks
- Liquid Feedstock Formulations
- Oil Based Feedstocks
- Slurry Feedstocks
- Gaseous Feedstock Formulations
- Biogas Feedstocks
- Syngas Feedstocks
- Blended Feedstock Formulations
- Multi Biomass Blends
- Hybrid Feedstock Blends
- Solid Feedstock Formulations
-
By Distribution Channel
- Direct Supply Agreements
- Industrial Supply Contracts
- Long Term Procurement Contracts
- Feedstock Aggregators
- Agricultural Aggregators
- Biomass Aggregators
- Commodity Trading Channels
- Biomass Trading Companies
- Energy Commodity Firms
- Digital Procurement Platforms
- Online Biomass Exchanges
- Supplier Direct Platforms
- Direct Supply Agreements
-
By Region
- North America
- Latin America
- Western Europe
- Eastern Europe
- East Asia
- South Asia & Pacific
- Middle East & Africa
Frequently Asked Questions
How big is the Bio-Feedstock Market in 2026?
What is the CAGR of the Bio-Feedstock Market from 2026 to 2036?
Which product leads the Bio-Feedstock Market?
Which application leads the Bio-Feedstock Market?
Who are the leading companies in the Bio-Feedstock Market?
Who worked on this report


Preview the report firsthand - request a free sample
Free SampleGet the brochure for pricing and purchase details
Download PDF