- Market Value (2025): USD 287.4 Bn
- Estimated Value (2026): USD 299.5 Bn
- Forecast Value (2036): USD 449.9 Bn
- CAGR (2026-2036): 4.2%
What is the Rigid Packaging for Food and Beverages Market forecast to be worth by 2036?
USD 299.5 billion in 2026 to USD 449.9 billion by 2036, at a 4.2% CAGR.
- The rigid packaging for food and beverages market reached USD 287.4 billion in 2025.
- As per Fact.MR analysis, sales are projected to move from USD 299.5 billion in 2026 to USD 449.9 billion by 2036.
- The market is expected to grow at a 4.2% CAGR from 2026 to 2036 as food processors and beverage fillers continue buying protective rigid packs.
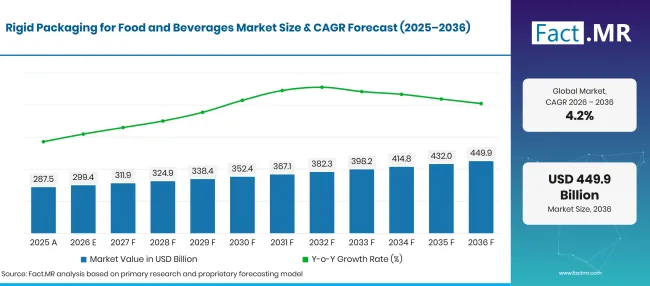
Factmr Rigid Packaging For Food And Beverages Market Forecast Global | Source: Fact.MR
| Year | Basis | Market Value (USD billion) |
|---|---|---|
| 2025 | Actual | 287.4 |
| 2026 | Estimate | 299.5 |
| 2036 | Forecast | 449.9 |
| CAGR 2026 to 2036 | Forecast period | 4.2% |
Source: Fact.MR analysis. Updated Oct 19, 2026
What are the defining numbers behind Rigid Packaging for Food and Beverages Market growth?
USD 150.4 billion absolute opportunity between 2026 and 2036, with plastic packs and food-industry customers forming the principal sales base.
- Demand Drivers in the Market
- Beverage bottlers need lightweight containers that hold their shape on fast filling lines. Plastic bottles offer design flexibility, while metal cans allow efficient stacking and controlled portion sizes. Container producers compete on sealing reliability and line compatibility.
- Fresh food packaging relies on trays and sealed containers to protect chilled or prepared food during delivery. Pack depth and material stiffness affect how much product a retailer can load into refrigerated displays.
- Brand owners compare packaging formats by looking at filling and transport costs together. A lighter container can reduce shipping costs, provided it remains strong enough for automated handling.
- Packaging compliance teams are reviewing material choices as recycling obligations become more detailed. Eurostat reported that the EU generated 79.7 million tonnes of packaging waste in 2023 in its October 2025 release [1].
- Key Segments Analyzed
- By Material Type: Plastic represents 42.3% share in 2026, reflecting widespread use in beverage bottles and food containers.
- By Product Type: Bottles & Jars account for 40.8% share in 2026 because filling plants use standardized container forms.
- By Application: Beverages hold 43.7% share in 2026, led by repeat container purchases by drink manufacturers.
- By End-User: Food Industry represents 54.1% share in 2026, reflecting packaging for processed and shelf-stable foods.
- Analyst Opinion at Fact.MR
- Shambhu Nath Jha, Principal Consultant at Fact.MR, states, “Rigid container contracts depend on how well a pack works on the customer’s existing line. The price of the empty container is only one part of that choice. Manufacturers who combine dependable closures with reliable material supply are likely to gain repeat orders, especially when beverage brands change pack weight or recycled-content specifications.”
- Strategic Implications
- container manufacturers must test new bottle weights against drop resistance and filling performance before moving designs into routine production. Lower resin use has limited value if packs fail during distribution.
- Food processors should assess tray sealing and stacking requirements at the start of product design. Changes after a filling line has been commissioned increase conversion costs.
- brand owners need clear material specifications for recycling records and package labels. Separate treatment of glass, plastic and metal can change the business case for each format.
- Packaging distributors helps smaller food businesses manage minimum order quantities and delivery timing. A dependable supply of identical lids and containers also reduces avoidable line changes.
Germany is projected to record a 4.8% CAGR through 2036, followed by Brazil at 4.4%. The United States is forecast at 4.0%, while the United Kingdom reaches 3.6%. Japan follows at 3.2%, with established filling equipment and collection systems influencing container replacement decisions.
How does the Rigid Packaging for Food and Beverages Market break down by segment?
Plastic leads with 42.3%; Bottles & Jars hold 40.8% share in 2026.
Which Material Type dominates?
Plastic holds 42.3% share in 2026.
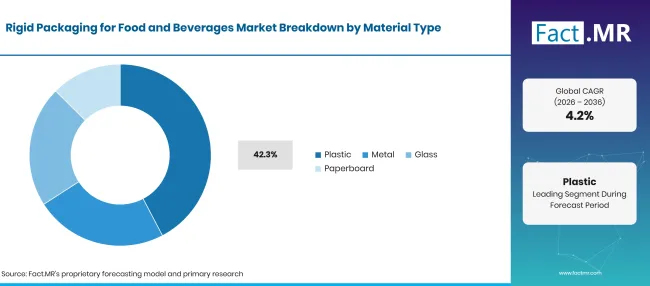
Factmr Rigid Packaging For Food And Beverages Market Breakdown Material Type | Source: Fact.MR
| Material Type | Share (2026) |
|---|---|
| Plastic (Leading segment) | 42.3% |
| Other segments combined | 57.7%* |
| Total | 100.0% |
Source: Fact.MR analysis. Updated Oct 19, 2026
Plastic lead the material type segment in 2026. Beverage fillers often want clear containers that make the product visible, while dairy packers need stiffness near the seal. Metal cans protect products that require a closed barrier throughout storage. Glass jars offer a different appearance and tolerate established hot-fill processes when the design is suitable.
What leads the Product Type segment?
Bottles & Jars account for 40.8% share in 2026.
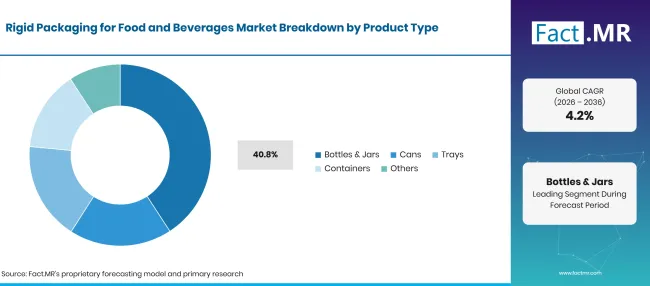
Factmr Rigid Packaging For Food And Beverages Market Breakdown Product Type | Source: Fact.MR
| Product Type | Share (2026) |
|---|---|
| Bottles & Jars (Leading segment) | 40.8% |
| Other segments combined | 59.2%* |
| Total | 100.0% |
Source: Fact.MR analysis. Updated Oct 19, 2026
Bottles and jars suit repeat filling operations because neck and closure dimensions can be standardized. Food brands use jars for spreads and sauces, while beverage businesses purchase bottles in large runs. Cans are attractive where a compact pack and complete closure are valuable. Trays help processors display prepared meals or meat products.
Which Application accounts for the main share?
Beverages represent 43.7% share in 2026.
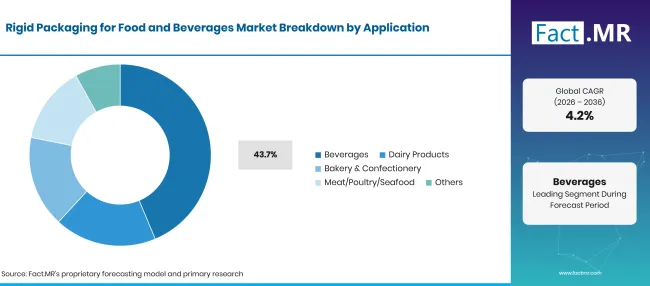
Factmr Rigid Packaging For Food And Beverages Market Breakdown Application | Source: Fact.MR
| Application | Share (2026) |
|---|---|
| Beverages (Leading segment) | 43.7% |
| Other segments combined | 56.3%* |
| Total | 100.0% |
Source: Fact.MR analysis. Updated Oct 19, 2026
Beverages holds the 43.7% share in 2026. Dairy products also rely on rigid containers where handling and resealing are useful. Bakery and confectionery goods use trays and tubs for separation and crush protection. Meat, poultry and seafood need packs suited to cold storage and sealing controls.
How does End-User purchasing shape sales?
Food Industry represents 54.1% share in 2026.
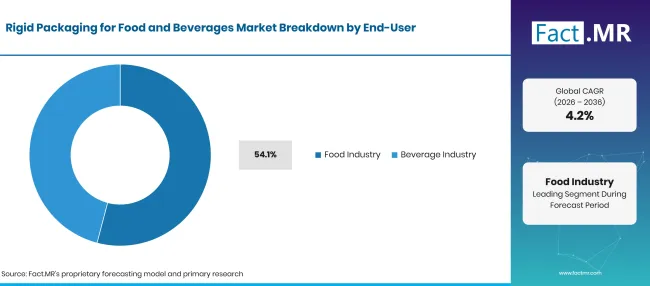
Factmr Rigid Packaging For Food And Beverages Market Breakdown End User | Source: Fact.MR
| End-User | Share (2026) |
|---|---|
| Food Industry (Leading segment) | 54.1% |
| Other segments combined | 45.9%* |
| Total | 100.0% |
Source: Fact.MR analysis. Updated Oct 19, 2026
Food factories select produce packaging trays and other containers to match filling equipment, portion size and how goods move through warehouses. They also review pack cost against the retail value of the product. Beverage companies work with can and bottle suppliers on specifications that preserve line uptime. Both groups seek reliable deliveries because switching a container can also mean changing labels and closures.
What is accelerating Rigid Packaging for Food and Beverages Market adoption, and what is holding it back?
repeat food and beverage filling supports purchases, while recycling charges and pack conversion costs influence material selection.
Drivers Impact Analysis
| DRIVER | (~) % IMPACT ON CAGR | GEOGRAPHIC RELEVANCE | IMPACT TIMELINE |
|---|---|---|---|
| Filling-line compatibility | +0.9% | Global | Medium term (2–4 years) |
| Beverage container replenishment | +0.7% | Global | Short term (≤2 years) |
| Food shelf-life requirements | +0.6% | Global | Medium term (2–4 years) |
| Retail pack-size variety | +0.4% | North America, Europe | Medium term (2–4 years) |
| Recyclable container design | +0.3% | Europe, Japan | Long term (≥4 years) |
Source: Fact.MR analysis. Updated Oct 19, 2026
Opportunity Impact Analysis
| OPPORTUNITY | (~) % IMPACT ON CAGR | GEOGRAPHIC RELEVANCE | IMPACT TIMELINE |
|---|---|---|---|
| Lightweight bottles | +0.7% | Global | Medium term (2–4 years) |
| Can supply networks | +0.5% | Americas | Short term (≤2 years) |
| Recycled-material grades | +0.4% | Europe | Medium term (2–4 years) |
| Standardized closures | +0.3% | Global | Long term (≥4 years) |
Source: Fact.MR analysis. Updated Oct 19, 2026
Restraints Impact Analysis
| RESTRAINT | (~) % IMPACT ON CAGR | GEOGRAPHIC RELEVANCE | IMPACT TIMELINE |
|---|---|---|---|
| Resin and metal input costs | -0.7% | Global | Short term (≤2 years) |
| Recycling fee exposure | -0.6% | Europe | Medium term (2–4 years) |
| Filling-line changeover expense | -0.5% | Global | Medium term (2–4 years) |
| Material recovery limits | -0.3% | Global | Long term (≥4 years) |
Source: Fact.MR analysis. Updated Oct 19, 2026
Which countries are scaling the Rigid Packaging for Food and Beverages Market through 2036?
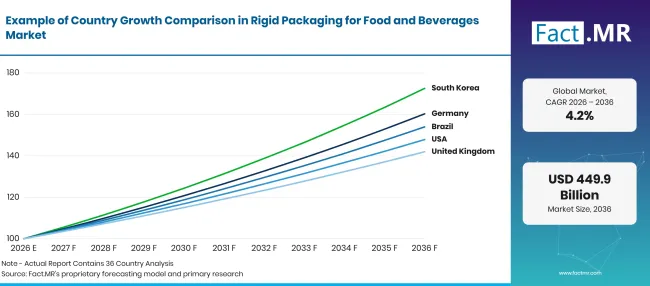
Factmr Rigid Packaging For Food And Beverages Market Growth Index | Source: Fact.MR
| Country | CAGR (2026–2036) |
|---|---|
| Germany | 4.8% |
| Brazil | 4.4% |
| United States | 4.0% |
| United Kingdom | 3.6% |
| Japan | 3.2% |
Source: Fact.MR analysis. Updated Oct 19, 2026
Why is Germany expanding rigid food packaging use?
4.8% CAGR, linked to material recovery systems and reliable food-packaging specifications.
Germany's reusable bottle and container systems shape packaging design for beverage and food producers. In February 2026, Destatis reported that 1.883 million tonnes of glass packaging had been collected or taken back during 2024 [4]. Local glassmakers and food packaging converters work with fillers on repeatable bottle dimensions.
How is Brazil developing rigid packaging sales?
4.4% CAGR, shaped by beverage can filling and food processing requirements.
Brazilian beverage fillers work with metal-can producers to manage long packaging runs and frequent delivery schedules. Ball's November 2025 company announcement described its South American beverage-packaging operations [2]. Beverage companies choose can sizes around the output of their filling plants. Food processors use tubs and sealed containers to protect processed goods on longer domestic routes.
What supports rigid packaging purchases in the United States?
4.0% CAGR, tied to beverage filling scale and repeat consumer-packaged-food orders.
U.S. beverage bottlers purchase bottles and cans in volumes aligned with high-speed filling operations. In August 2026, the U.S. Census Bureau reported that e-commerce accounted for 17.1% of total seasonally adjusted retail sales in the second quarter of 2026 [5]. Food brands evaluate closure tightness because sealed packs must withstand transport and warehouse handling.
How is the United Kingdom adjusting rigid container choices?
3.6% CAGR, influenced by producer fees and documented material recovery.
UK food and beverage brands review rigid pack materials in light of extended producer responsibility charges. In September 2026, Defra reported a provisional glass-packaging recycling rate of 75.1% for 2025 [3]. Beverage plants continue using bottles and cans that fit proven line speeds. Food companies require trays with dependable seals for chilled products.
Why does Japan continue to purchase rigid food containers?
3.2% CAGR, supported by established container manufacturing and precise pack dimensions.
Japanese food businesses work with container suppliers to keep pack dimensions consistent across filling and retail handling. Packaging suppliers in Japan continue to work with food and beverage fillers on container compatibility and material specifications. Beverage producers focus on closure fit and controlled bottle shapes.
Who leads the Rigid Packaging for Food and Beverages Market?
Amcor, Ardagh, Crown and Ball cover different rigid packaging materials, alongside Sonoco and other container manufacturers.
Amcor serves food and beverage customers with plastic packaging formats and inherited Berry operations following the 2025 combination. Ardagh Group supplies glass and metal containers through its operating businesses. Crown Holdings and Ball focus on metal packaging, including beverage cans. Each company’s suitability depends on material choice and the customer’s filling operation rather than a single all-format ranking.
Sonoco Products Company supplies consumer packaging and paper-based containers. Sealed Air Corporation is active in food packaging, including rigid and semi-rigid solutions within a broader protective packaging business. Tetra Pak International S.A. is associated with paper-based food and beverage cartons, many of which are composite packs and sit at the boundary of a strictly rigid-only definition.
Which companies are the key providers?
Key companies include Ardagh Group S.A.; Amcor Plc; Sealed Air Corporation; Sonoco Products Company; Ball Corporation; Crown Holdings, Inc.; Tetra Pak International S.A.
- Ardagh Group S.A.
- Amcor Plc
- Sealed Air Corporation
- Sonoco Products Company
- Ball Corporation
- Crown Holdings, Inc.
- Tetra Pak International S.A.
Bibliography
- [1] Eurostat. (2025, October 22). Plastic packaging waste in the EU: 35.3 kg per person.
- [2] Ball Corporation. (2025, November 4). Ball reports third quarter 2025 results.
- [3] Department for Environment, Food & Rural Affairs. (2026, September 23). UK statistics on waste. GOV.UK.
- [4] Statistisches Bundesamt (Destatis). (2026, February 23). Abfallentsorgung 2024: Art und Menge der im Berichtsjahr 2024 gesammelten/zurückgenommenen Verpackungen.
- [5] U.S. Census Bureau. (2026, August 18). Quarterly retail e-commerce sales: Second quarter 2026.
- [6] Japan Packaging Institute. (2026, July 1). 2025[Overview of 2025 Japanese packaging industry shipment statistics].
This Report Answers
- The report examines how plastic bottles and metal cans compete for food and beverage packaging orders.
- Material comparisons cover container weight, closure design and suitability for common filling methods.
- Country analysis follows Germany, Brazil, the United States, the United Kingdom and Japan.
- Beverage applications and food-industry purchasing are assessed using their 2026 segment positions.
- The competitive review distinguishes direct rigid container suppliers from adjacent paper-carton businesses.
What does the Rigid Packaging for Food and Beverages Market cover?
The market covers plastic, metal, glass and qualifying rigid paperboard packaging sold to food and beverage producers. It includes bottles, cans and containers whose shape remains stable during normal handling. Packaging films sold alone fall outside this boundary. Related packaging material assessments are available for rigid plastic packaging and metal cans.
What is included in the scope?
Food and beverage containers enter the scope when the item is sold as a rigid protective pack.
Bottles and jars serve drinks and food products that require a defined shape during filling. Cans are included for beverage and suitable food uses. Rigid trays and tubs also count when they are part of the finished packaging supplied to processors.
What is excluded from the scope?
Loose flexible films and bags are outside this rigid-container definition.
Filling machines and recycling equipment are also excluded because their sales are equipment sales rather than container revenue. Secondary sales of used plastic or glass do not count as new finished-pack purchases.
How Was the Analysis Built?
The analysis draws on 120+ sources, 35+ company portfolios, 25+ countries, and more than 20 industry interviews.
- Primary Research: Primary research includes discussions with manufacturers, service providers, technology developers, distributors, end users, and subject-matter experts. These conversations examine purchasing priorities, product adoption, operational challenges, approval requirements, competitive positioning, and the factors that influence wider market acceptance.
- Desk Research: Desk research covers government statistics, regulatory publications, company filings, trade data, technical studies, industry associations, standards, public policy, and other authoritative sources. Every source used in the analysis is documented in the bibliography.
- Market Sizing and Forecasting: Market estimates combine historical performance, demand indicators, pricing and volume trends, segment shares, company participation, country-level growth, adoption patterns, investment activity, and barriers to market expansion.
- Data Validation and Update Cycle: Findings are validated by comparing primary interviews with public data, company activity, regulatory changes, trade patterns, and industry developments. Regular updates review new product launches, capacity changes, partnerships, approvals, and shifts in commercial adoption.
Segmentation
What is the report’s scope and coverage?
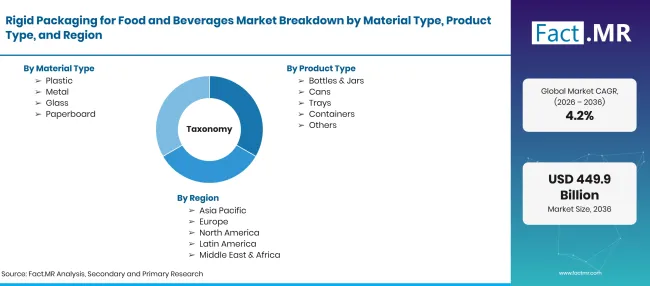
Factmr Rigid Packaging For Food And Beverages Market Taxonomy | Source: Fact.MR
| Attribute | Details |
|---|---|
| Quantitative Units | USD billion in 2026 and 2036; CAGR 2026 to 2036 |
| Market Definition | Rigid containers sold for the protection and distribution of food and beverage products. |
| Material Type | Plastic; Metal; Glass; Paperboard |
| Product Type | Bottles & Jars; Cans; Trays; Containers; Others |
| Application | Beverages; Dairy Products; Bakery & Confectionery; Meat/Poultry/Seafood; Others |
| End-User | Food Industry; Beverage Industry |
| Regions Covered | North America; Latin America; Western Europe; Eastern Europe; East Asia; South Asia & Pacific; Middle East & Africa |
| Countries Covered | Germany; Brazil; USA; UK; Japan |
| Companies Profiled | Ardagh Group S.A.; Amcor Plc; Sealed Air Corporation; Sonoco Products Company; Ball Corporation; Crown Holdings, Inc.; Tetra Pak International S.A. |
| Forecast Period | 2026 to 2036 |
| Approach | Comparison of packaging applications, material properties, regulations, official statistics and manufacturer activity |
Source: Fact.MR analysis. Updated Oct 19, 2026
How is the market segmented?
-
By Material Type
- Plastic
- Metal
- Glass
- Paperboard
-
By Product Type
- Bottles & Jars
- Cans
- Trays
- Containers
- Others
-
By Application
- Beverages
- Dairy Products
- Bakery & Confectionery
- Meat/Poultry/Seafood
- Others
-
By End-User
- Food Industry
- Beverage Industry
-
By Region
- North America
- Latin America
- Western Europe
- Eastern Europe
- East Asia
- South Asia & Pacific
- Middle East & Africa
Frequently Asked Questions
How big is the Rigid Packaging for Food and Beverages Market in 2026?
What is the CAGR of the Rigid Packaging for Food and Beverages Market from 2026 to 2036?
Which material type leads the Rigid Packaging for Food and Beverages Market?
Which product type leads the Rigid Packaging for Food and Beverages Market?
Who are the leading companies in the Rigid Packaging for Food and Beverages Market?
Who worked on this report


Preview the report firsthand - request a free sample
Free SampleGet the brochure for pricing and purchase details
Download PDF