- Market Value (2025): USD 3.12 Bn
- Estimated Value (2026): USD 3.41 Bn
- Forecast Value (2036): USD 8.18 Bn
- CAGR (2026-2036): 9.1%
What is the Robotic Medical Imaging Systems Market forecast to be worth by 2036?
USD 3.4 billion in 2026 to USD 8.2 billion by 2036, at 9.1% CAGR.
- The robotic medical imaging systems market reached USD 3.12 billion in 2025.
- According to Fact.MR analysis, sales are forecast to rise from USD 3.41 billion in 2026 to USD 8.18 billion by 2036.
- The 2026 to 2036 outlook carries a 9.1% CAGR as hospitals assess motorized positioning and imaging systems for clinical workflows.
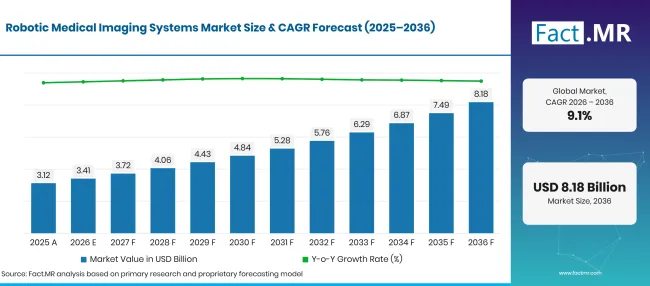
Robotic Medical Imaging Systems Market Forecast Global | Source: Fact.MR
| Year | Basis | Market Value (USD billion) |
|---|---|---|
| 2025 | Actual | 3.12 |
| 2026 | Estimate | 3.41 |
| 2036 | Forecast | 8.18 |
| CAGR 2026 to 2036 | Forecast period | 9.1% |
Source: Fact.MR analysis. Updated Oct 23, 2026
What are the defining numbers behind Robotic Medical Imaging Systems Market growth?
USD 4.8 billion absolute opportunity between 2026 and 2036, with diagnostic use and hospitals forming the main purchasing base.
- Demand Drivers in the Market
- Interventional teams purchase motorized imaging systems when access around the patient affects the speed and consistency of image-guided procedures. In May 2026, Siemens Healthineers announced FDA clearance for six Artis interventional systems, including the floor-mounted robotic Artis vision pheno configuration [1].
- Cath labs place value on aligning images with device movement during treatment. Philips introduced a CT and Azurion integration in October 2025 that synchronizes preoperative CT images with C-arm movement for coronary procedures. [2]
- Hospital planners need to consider the price of a robotic imaging system alongside the room layout and available service support. The equipment must leave enough working space for clinical staff as well as the moving imaging arm.
- Key Segments Analyzed
- By Product Type: X-ray systems account for 28.4% share in 2026 because movable C-arm platforms serve interventional and surgical imaging.
- By Application: Diagnostics represent 52.3% share in 2026 as imaging teams evaluate automated examination workflows.
- By End-User: Hospitals hold 54.8% share in 2026 since specialist imaging rooms often sit alongside interventional and surgical services.
- By Technology: AI-Integrated systems capture 54.8% share in 2026 as software assists image reconstruction and procedure guidance.
- Analyst Opinion at Fact.MR
- Shambhu Nath Jha, Principal Consultant at Fact.MR, states, “Robotic medical imaging systems compete on the practical value of moving an imaging chain around patients. For a hospital, a shorter positioning sequence only creates value when image quality and room access remain reliable.”
- Strategic Implications
- Hospital administrators should compare the number of procedures supported by an imaging room before approving a robotic platform.
- Imaging manufacturers should document how motorized movement changes patient positioning and equipment setup under normal clinical conditions.
- Clinical teams should evaluate whether automated positioning leaves enough space for staff access during complex interventions.
- Service providers should plan for calibration and software updates across an installed imaging fleet.
Germany is forecast to post 11.7% CAGR, while Brazil follows at 10.7% as healthcare systems review imaging access and clinical capacity. The United States carries a 9.7% outlook, with the United Kingdom at 8.7%.
How does the Robotic Medical Imaging Systems Market break down by segment?
X-ray 28.4%; Diagnostics 52.3%; Hospitals 54.8%; AI-Integrated 54.8% in 2026.
Which Product Type dominates?
According to Fact.MR analysis, X-ray holds 28.4% share in 2026.
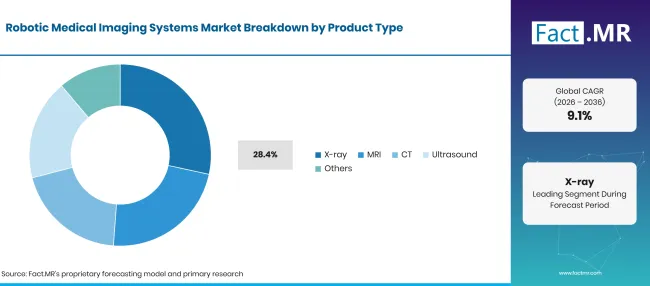
Robotic Medical Imaging Systems Market Breakdown Product Type | Source: Fact.MR
| Product Type | Share (2026) |
|---|---|
| X-ray (Leading segment) | 28.4% |
| Other segments combined | 71.6% |
| Total | 100.0% |
Source: Fact.MR analysis. Updated Oct 23, 2026
Motorized X-ray platforms are useful where clinicians need imaging during an intervention and the C-arm must move around the procedure table. MRI equipment serves soft-tissue imaging and selected image-guided workflows, although conventional fixed-room MRI is outside a strictly robotic system boundary. CT systems support planned interventions where scans guide instrument placement. [3]
What leads the Application segment?
Diagnostics account for 52.3% share in 2026.
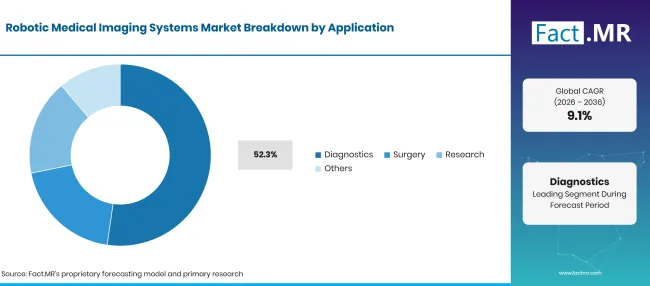
Robotic Medical Imaging Systems Market Breakdown Application | Source: Fact.MR
| Application | Share (2026) |
|---|---|
| Diagnostics (Leading segment) | 52.3% |
| Other segments combined | 47.7% |
| Total | 100.0% |
Source: Fact.MR analysis. Updated Oct 23, 2026
Diagnostic imaging accounts for the specified majority of application sales as clinicians use automated positioning to make examinations more consistent. Surgery represents a separate equipment decision where imaging must remain available during a procedure. Research sites examine robotic scanning methods before wider clinical use, often focusing on how movement affects image acquisition. These operating conditions help explain different technology choices across the application groups.
How does End-User purchasing shape sales?
Hospitals lead with 54.8% share in 2026.
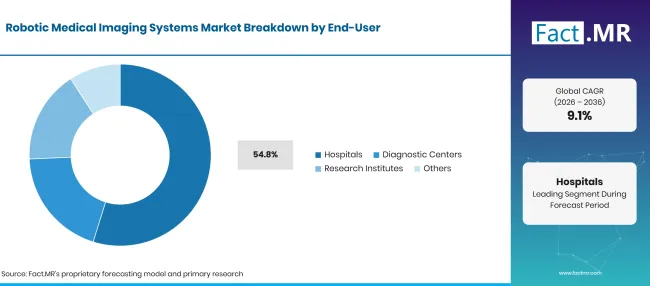
Robotic Medical Imaging Systems Market Breakdown End User | Source: Fact.MR
| End-User | Share (2026) |
|---|---|
| Hospitals (Leading segment) | 54.8% |
| Other segments combined | 45.2% |
| Total | 100.0% |
Source: Fact.MR analysis. Updated Oct 23, 2026
Hospitals can use robotic imaging in radiology, surgery and interventional care when room design permits. Diagnostic centers usually compare patient throughput and repeatable examinations, while research sites assess more specialized movement and scanning methods. The useful configuration depends on the work each site performs.
Which Technology has the greatest forecast share?
AI-Integrated represents 54.8% share in 2026.
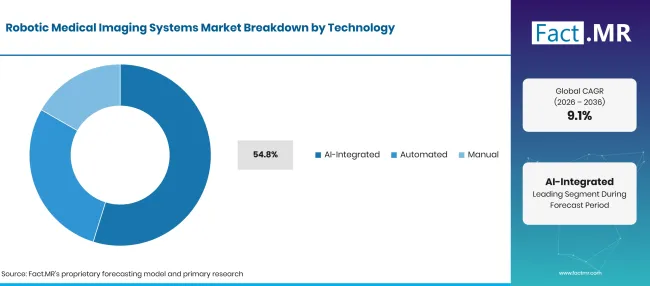
Robotic Medical Imaging Systems Market Breakdown Technology | Source: Fact.MR
| Technology | Share (2026) |
|---|---|
| AI-Integrated (Leading segment) | 54.8% |
| Other segments combined | 45.2% |
| Total | 100.0% |
Source: Fact.MR analysis. Updated Oct 23, 2026
AI-integrated imaging systems apply software to tasks such as processing images or guiding the operator through familiar steps. Robotics refers to controlled physical movement, so AI and robotic movement describe different capabilities that may appear in one platform. Automated systems handle selected positioning sequences under a predefined workflow, while manual operation leaves more adjustments to clinical staff.
What is accelerating Robotic Medical Imaging Systems Market adoption, and what is holding it back?
Controlled image positioning supports clinical use; installation and equipment approval costs limit purchase speed.
Drivers Impact Analysis
| DRIVER | (~) % IMPACT ON CAGR | GEOGRAPHIC RELEVANCE | IMPACT TIMELINE |
|---|---|---|---|
| Interventional room upgrades | +1.0% | North America, Europe | Medium term (2–4 years) |
| Repeatable positioning | +0.8% | Global | Short term (<= 2 years) |
| Image-guided navigation | +0.7% | Europe, United States | Medium term (2–4 years) |
| Clinical workflow integration | +0.5% | Global | Medium term (2–4 years) |
| Ultrasound automation | +0.4% | Global | Long term (>= 4 years) |
Source: Fact.MR analysis. Updated Oct 23, 2026
Opportunity Impact Analysis
| OPPORTUNITY | (~) % IMPACT ON CAGR | GEOGRAPHIC RELEVANCE | IMPACT TIMELINE |
|---|---|---|---|
| Hybrid room redesign | +0.8% | Europe, North America | Medium term (2–4 years) |
| Robotic ultrasound control | +0.6% | Global | Long term (>= 4 years) |
| Software upgrades | +0.5% | Global | Short term (<= 2 years) |
| Service coverage | +0.4% | Global | Medium term (2–4 years) |
Source: Fact.MR analysis. Updated Oct 23, 2026
Restraints Impact Analysis
| RESTRAINT | (~) % IMPACT ON CAGR | GEOGRAPHIC RELEVANCE | IMPACT TIMELINE |
|---|---|---|---|
| Capital equipment expense | -0.8% | Global | Short term (<= 2 years) |
| Room installation limits | -0.6% | Global | Medium term (2–4 years) |
| Clinical training needs | -0.5% | Global | Medium term (2–4 years) |
| Approval and validation | -0.4% | Global | Long term (>= 4 years) |
Source: Fact.MR analysis. Updated Oct 23, 2026
Which countries are scaling Robotic Medical Imaging Systems through 2036?
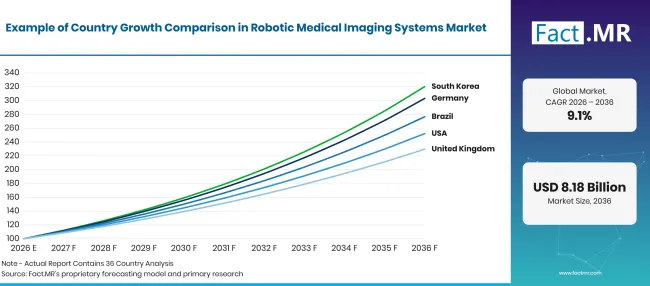
Robotic Medical Imaging Systems Market Growth Index | Source: Fact.MR
| Country | CAGR (2026–2036) |
|---|---|
| Germany | 11.7% |
| Brazil | 10.7% |
| United States | 9.7% |
| United Kingdom | 8.7% |
| Japan | 7.7% |
Source: Fact.MR analysis. Updated Oct 23, 2026
Why is Germany expanding robotic medical imaging adoption?
11.7% CAGR, supported by interventional imaging needs and hospital equipment upgrades.
German hospitals assess robotic imaging for procedures where clinicians need controlled movement around the treatment table. Statistisches Bundesamt reported around 17.5 million inpatient hospital cases in 2024 [4]. In cardiology and vascular care, motorized C-arm systems can support changes in imaging position while maintaining clinical access to the patient.
How is Brazil widening access to robotic medical imaging systems?
10.7% CAGR, shaped by diagnostic access, specialist treatment capacity, and equipment servicing.
Brazilian hospitals are reviewing imaging capacity as access to diagnostic procedures expands. In July 2026, the Ministério da Saúde updated payment arrangements covering more than 120 diagnostic procedures within the SUS system [5]. Larger hospitals may consider robotic imaging for interventional suites, while purchasing decisions also depend on equipment cost, trained staff, and reliable local technical support.
What is driving robotic medical imaging sales in the United States?
9.7% CAGR, influenced by equipment innovation and regulated clinical adoption.
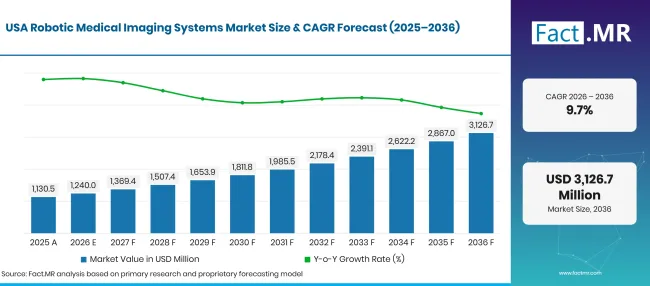
Robotic Medical Imaging Systems Market Forecast Usa | Source: Fact.MR
U.S. hospitals consider robotic imaging when replacing or upgrading equipment used in diagnostic and interventional rooms. Commercially available systems give providers more options for controlled positioning, while purchasing teams assess patient access, room utilization, capital approval, software support, and maintenance requirements before introducing a new platform.
How is the United Kingdom developing robotic medical imaging use?
8.7% CAGR, linked to diagnostic capacity planning and hospital workflow improvements.
UK imaging departments assess robotic systems where controlled movement can support image-guided procedures and improve access around the patient table. Hospitals also consider equipment uptime and room design before installation, since older facilities may need physical changes to accommodate motorized imaging hardware.
Why is Japan maintaining steady robotic medical imaging growth?
7.7% CAGR, influenced by selective equipment replacement and established radiology workflows.
Japanese hospitals evaluate robotic imaging according to the procedures performed and the space available in existing imaging rooms. Fujifilm have established domestic imaging activities that support clinical equipment servicing. Hospitals considering motorized positioning also review scan quality, staff training, room compatibility, and long-term technical support before replacing existing systems.
Who leads the Robotic Medical Imaging Systems Market?
Siemens Healthineers offers Artis platforms including a robotic-positioning configuration. GE HealthCare develops autonomous imaging applications and supplies motorized X-ray equipment. Philips supports image-guided procedures through Azurion systems, some with multi-axis FlexArm geometry.
Fujifilm Holdings and its healthcare operations, Samsung Medison, Brainlab AG, Carestream Health have imaging portfolios that touch related clinical applications. Their inclusion reflects imaging capability, but specific robotic movement or automated-positioning products must be evaluated model by model.
Which companies are the key providers?
Key companies include GE HealthCare Technologies Inc.; Siemens Healthineers AG; Fujifilm Healthcare Corporation; Brainlab AG; and Medtronic plc.
- GE HealthCare Technologies Inc.
- Siemens Healthineers AG
- Fujifilm Healthcare Corporation
- Brainlab AG
- Medtronic plc
Bibliography
- [1] Siemens Healthineers. (2026, May 12). Siemens Healthineers receives FDA clearance for six new interventional systems with Optiq AI imaging chain.
- [2] Philips. (2025, October 27). Philips introduces cath lab integration that automatically synchronizes pre-operative CT with C-arm movement, paving the way for CT-guided PCI.
- [3] GE HealthCare. (2025, July 24). GE HealthCare launches new advanced digital X-ray system to enable access and increase efficiency in high throughput settings.
- [4] Statistisches Bundesamt (Destatis). (2025, November 6). 2,0 % mehr stationäre Krankenhausbehandlungen im Jahr 2024.
- [5] Ministério da Saúde. (2026, July 25). Ministério da Saúde atualiza valores para oferta de tomografias e ressonâncias na rede privada pelo SUS.
- [6] Department of Health and Social Care. (2026, April 13). NHS patients to get quicker tests and scans closer to home.
This Report Answers
- The report evaluates robotic imaging in diagnostic and interventional settings.
- Product analysis distinguishes X-ray positioning platforms from MRI, CT and ultrasound equipment with varying levels of automation.
- Application analysis assesses diagnostic work separately from surgery and research use.
- The country outlook compares Germany, Brazil, the United States, the United Kingdom and Japan.
- Competitive analysis explains why supplier-wide imaging portfolios should be distinguished from robotic device capabilities.
What does the Robotic Medical Imaging Systems Market cover?
This market covers imaging systems in which controlled mechanical movement contributes to imaging acquisition or procedure guidance. Relevant systems include robotic C-arms and selected automated ultrasound platforms.
What is included in the scope?
The scope includes robotic X-ray systems for interventional rooms and automated imaging equipment with controlled movement. Diagnostic imaging and surgical guidance are covered where the device performs this function. Hospitals and diagnostic centers are assessed as equipment buyers. The technology split includes AI-Integrated, Automated and Manual categories.
What is excluded from the scope?
Conventional fixed scanners with image-processing software alone are excluded unless the device includes the relevant robotic or motorized imaging control. Surgical robots without an integrated imaging system fall outside the imaging equipment boundary. Standalone image-analysis software is also excluded when sold separately from the specified system.
How Was the Analysis Built?
The analysis draws on 120+ sources, 35+ company portfolios, 25+ countries, and more than 20 industry interviews.
- Primary Research: Primary research includes discussions with manufacturers, service providers, technology developers, distributors, end users, and subject-matter experts. These conversations examine purchasing priorities, product adoption, operational challenges, approval requirements, competitive positioning, and the factors that influence wider market acceptance.
- Desk Research: Desk research covers government statistics, regulatory publications, company filings, trade data, technical studies, industry associations, standards, public policy, and other authoritative sources. Every source used in the analysis is documented in the bibliography.
- Market Sizing and Forecasting: Market estimates combine historical performance, demand indicators, pricing and volume trends, segment shares, company participation, country-level growth, adoption patterns, investment activity, and barriers to market expansion.
- Data Validation and Update Cycle: Findings are validated by comparing primary interviews with public data, company activity, regulatory changes, trade patterns, and industry developments. Regular updates review new product launches, capacity changes, partnerships, approvals, and shifts in commercial adoption.
Segmentation
What is the report’s scope and coverage?
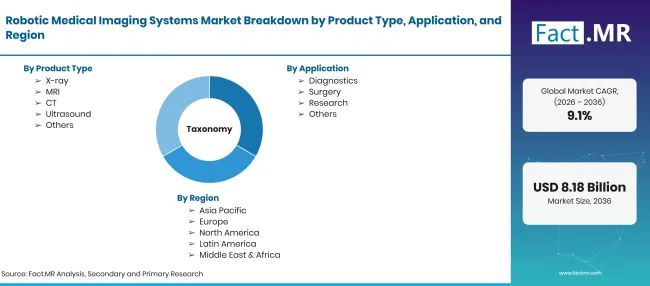
Robotic Medical Imaging Systems Market Taxonomy | Source: Fact.MR
| Attribute | Details |
|---|---|
| Quantitative Units | USD billion in 2026 to USD billion by 2036, at CAGR |
| Market Definition | Medical imaging systems with robotic or motorized positioning used in clinical imaging workflows |
| Product Type | X-ray; MRI; CT; Ultrasound; Others |
| Application | Diagnostics; Surgery; Research; Others |
| End-User | Hospitals; Diagnostic Centers; Research Institutes; Others |
| Technology | AI-Integrated; Automated; Manual |
| Regions Covered | North America; Latin America; Western Europe; Eastern Europe; East Asia; South Asia & Pacific; Middle East & Africa |
| Countries Covered | Germany; Brazil; United States; United Kingdom; Japan |
| Companies Profiled | GE HealthCare Technologies Inc.; Siemens Healthineers AG; Fujifilm Healthcare Corporation; Brainlab AG; and Medtronic plc |
| Forecast Period | 2026 to 2036 |
| Approach | Equipment classification, clinical workflow assessment, country outlook and publicly reported product developments |
Source: Fact.MR analysis. Updated Oct 23, 2026
How is the market segmented?
-
By Product Type
- MRI
- Ultrasound
-
By Application
- Surgery
- Others
- Hospitals
- Research Institutes
-
By Technology
- AI-Integrated
- Automated
- Manual
-
By Region
- North America
- Latin America
- Western Europe
- Eastern Europe
- East Asia
- South Asia & Pacific
- Middle East & Africa
Frequently Asked Questions
How big is the robotic medical imaging systems market in 2026?
What CAGR is forecast for 2026 to 2036?
Which product type leads in 2026?
Which application holds the main share?
Who are the main companies in the robotic medical imaging systems market?
Who worked on this report


Preview the report firsthand - request a free sample
Free SampleGet the brochure for pricing and purchase details
Download PDF