- Market Value (2025): USD 205.4 Mn
- Estimated Value (2026): USD 230 Mn
- Forecast Value (2036): USD 714.3 Mn
- CAGR (2026-2036): 12.0%
What is the shore power connection boxes market forecast to be worth by 2036?
USD 230 million in 2026 to USD 714.3 million by 2036, at 12.0% CAGR.
- The shore power connection boxes market reached USD 205.4 million in 2025.
- Market value is projected to increase to USD 230 million in 2026 to USD 714.3 million by 2036.
- The industry is expected to expand at 12.0% CAGR during the forecast period as marine electrification projects accelerate across commercial ports and passenger terminals.
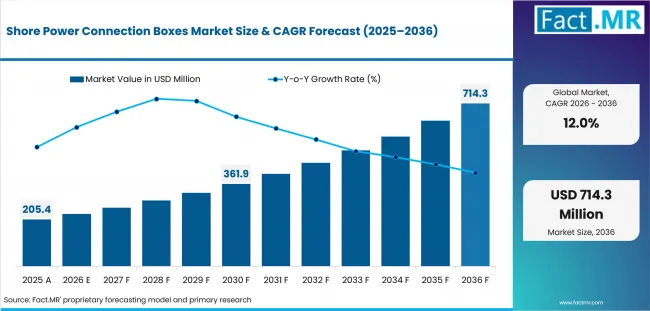
Shore Power Connection Boxes Market Market Value Analysis | Source: Fact.MR
What are the defining numbers behind shore power connection boxes market growth?
USD 484.3 million absolute opportunity by 2036, supported by cleaner port infrastructure and marine electrification.
- Demand Drivers in the Market
- Port electrification programs continue increasing demand for dedicated connection equipment.
- Environmental regulations encourage wider use of shore supplied electricity.
- Vessel operators seek safer electrical connections during berthing.
- Key Segments Analyzed
- By Connection Type: Medium voltage interfaces are expected to account for 36.0% share in 2026 because they support large commercial shore power installations.
- By Vessel Segment: Cruise ships are projected to hold 30.0% share in 2026 as passenger terminals continue expanding shore power capability.
- By Protection: IP rated enclosures are forecast to represent 33.0% share in 2026 because marine environments require dependable weather protection.
- By Buyer Type: Port operators are expected to capture 39.0% share in 2026 as they lead investment in waterfront electrification.
- By Geography: The United States is projected to record 12.8% CAGR through 2036 as shore power deployment continues expanding.
- Analyst Opinion at Fact.MR
- Shambhu Nath Jha, Senior Analyst at Fact.MR, states, "Reliable electrical connection points are becoming essential as shore power moves into everyday port operations. Products that simplify installation and improve operational safety are likely to benefit from the next phase of marine electrification."
- Strategic Implications
- Equipment suppliers should develop standardized connection systems for multiple vessel classes.
- Port operators should include connection equipment in long term electrification planning.
- Shipyards should support compatible shore connection standards for new vessels.
- Developers should strengthen protection features for demanding marine environments.
Shore power connection boxes provide the secure interface between port electrical infrastructure and vessels during berthing. They improve electrical safety while reducing manual handling during cable connection. Their role has become more important as ports seek dependable shore power operations.
Growing investment in low emission ports continues creating opportunities across ferry terminals, cruise facilities and container ports. Modern products now include metering, automated interlocks and arc protection that improve operational reliability. These developments support wider adoption across both new construction and retrofit projects.
The United States is projected to record 12.8% CAGR through 2036 because shore power investment continues expanding across major ports. Germany is expected to achieve 12.4% CAGR as marine electrification projects gain momentum. Japan is likely to register 12.0% CAGR through continued waterfront modernization. China is forecast to grow at 11.7% CAGR as coastal infrastructure expands. India is anticipated to reach 11.4% CAGR through new green port initiatives.
How does the shore power connection boxes market break down by segment?
Medium voltage interfaces lead at 36.0%. Cruise ships lead at 30.0%.
Which connection type dominates?
Medium voltage interfaces hold 36.0% share in 2026.
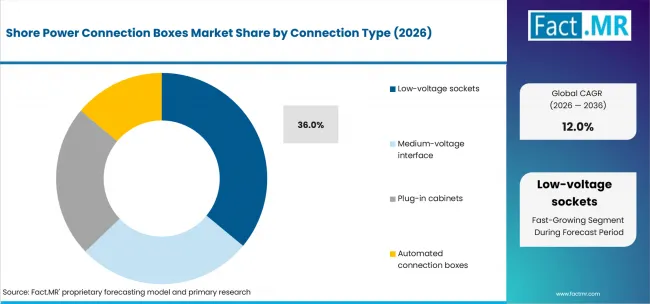
Shore Power Connection Boxes Market Analysis By Connection Type | Source: Fact.MR
Medium voltage interfaces are expected to account for 36.0% share in 2026 because they support the power needs of large commercial vessels. They also improve compatibility across modern port infrastructure. Low voltage sockets remain suitable for smaller vessels. Plug in cabinets simplify electrical access. Automated connection boxes reduce manual intervention during berthing. ABB was selected by Rotterdam Shore Power to engineer the world's largest shore power project for the Port of Rotterdam. The project includes shore connection infrastructure across three container terminals with 35 shore connection points, supporting large-scale shore power distribution.
Which vessel segment dominates?
Cruise ships lead with 30.0% share in 2026.
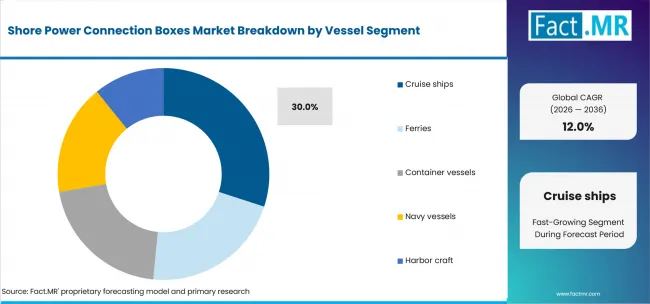
Shore Power Connection Boxes Market Analysis By Vessel Segment | Source: Fact.MR
Cruise ships are projected to capture 30.0% share in 2026 because they remain alongside for extended periods and consume significant onboard power. Ferries require rapid electrical connection during frequent port calls. Container vessels support demand across large commercial terminals. Navy vessels expand adoption through defense infrastructure. Harbor craft use compact connection systems. Cavotec received a EUR 1.5 million order for a Southern California cruise terminal expansion, supplying PowerFeed shore connection boxes, PowerCover, and PowerMove technologies for vessel shore power connections.
Which protection feature dominates?
IP rated enclosures hold 33.0% share in 2026.
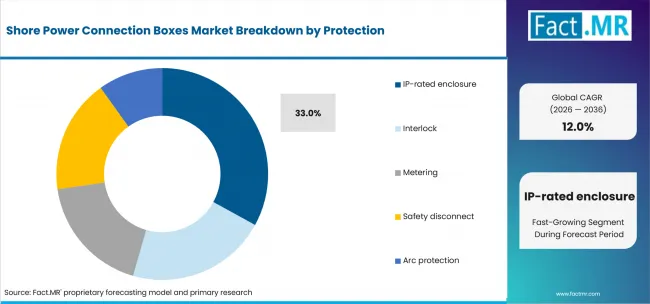
Shore Power Connection Boxes Market Analysis By Protection | Source: Fact.MR
IP rated enclosures remain the largest protection category because electrical equipment operates in demanding marine conditions. The segment is expected to account for 33.0% share in 2026. Interlock systems improve operator safety. Metering supports energy management. Safety disconnect devices improve maintenance procedures. Arc protection reduces electrical hazards.
Which installation dominates?
Fixed quay installations lead market with 38.0%.
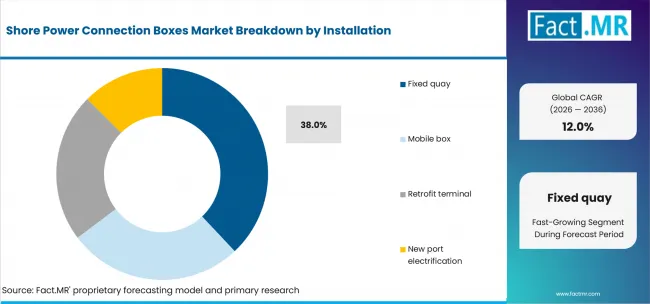
Shore Power Connection Boxes Market Analysis By Installation | Source: Fact.MR
Fixed quay installations are expected to account for 38.0% share in 2026 because permanent shore power infrastructure continues expanding across commercial ports. These systems support dependable daily operation. Mobile boxes provide deployment flexibility. Retrofit terminals upgrade existing facilities. New port electrification projects include connection equipment from the planning stage. ABB, together with Eiffage Construction and Fauché, completed France's largest shore power installation at the Port of Toulon, providing shore connection infrastructure for ferries and cruise ships.
Which buyer type dominates?
Port operators lead with 39.0% share in 2026.
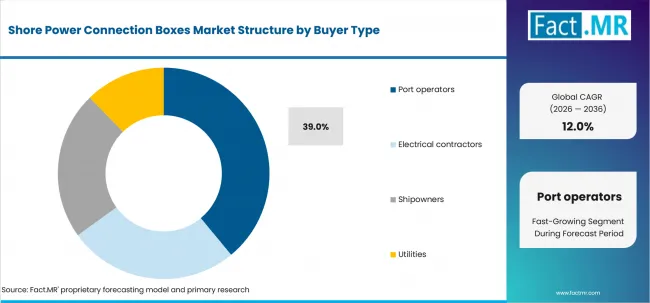
Shore Power Connection Boxes Market Analysis By Buyer Type | Source: Fact.MR
Port operators remain the largest customer group because they manage waterfront infrastructure and electrification investment. The segment is expected to account for 39.0% share in 2026. Electrical contractor’s complete installation work. Shipowners upgrade compatible vessels. Utilities support power distribution for shore connection projects. Cavotec secured EUR 9.35 million in orders to supply shore power systems for newly built and existing container vessels, including retrofits and newbuild installations. The systems enable vessels to connect safely to shore-side electricity while at berth, supporting port electrification and reducing emissions through advanced connection equipment.
What is accelerating Shore Power Connection Boxes Market and what is holding back?
Marine electrification supports growth while infrastructure costs remain a challenge.
Drivers Impact Analysis
| DRIVER | (~) % IMPACT ON CAGR | GEOGRAPHIC RELEVANCE | IMPACT TIMELINE |
|---|---|---|---|
| Expansion of shore power infrastructure | +1.0% | Global | Medium term (2-4 years) |
| Stronger environmental regulations | +0.9% | Europe, North America | Medium term (2-4 years) |
| Investment in green ports | +0.8% | Global | Long term (≥4 years) |
| Growth of vessel electrification | +0.6% | Asia Pacific, Europe | Medium term (2-4 years) |
| Modernization of waterfront facilities | +0.5% | Global | Short term (≤2 years) |
Source: Fact.MR analysis. Updated Jul 6, 2026
- Shore power infrastructure
- Ports continue building shore connection facilities to reduce emissions during vessel berthing. Connection boxes remain a core part of every installation.
- Environmental regulations
- Emission control measures encourage ports to replace onboard auxiliary power with shore supplied electricity. This supports equipment demand.
- Green ports
- Many governments continue funding cleaner maritime infrastructure. Electrical connection equipment benefits from these investment programs.
- Vessel electrification
- New vessels increasingly include shore connection capability. This creates steady demand for compatible port equipment.
- Waterfront modernization
- Terminal upgrades often include electrical improvements that support future expansion and safer operation.
Opportunity Impact Analysis
| OPPORTUNITY | (~) % IMPACT ON CAGR | GEOGRAPHIC RELEVANCE | IMPACT TIMELINE |
|---|---|---|---|
| Cruise terminal upgrades | +0.8% | Europe, North America | Medium term (2-4 years) |
| Retrofit of existing ports | +0.7% | Global | Medium term (2-4 years) |
| Smart energy monitoring | +0.5% | Global | Long term (≥4 years) |
| Expansion of naval shore power | +0.4% | North America, Asia Pacific | Medium term (2-4 years) |
Source: Fact.MR analysis. Updated Jul 6, 2026
- Cruise terminal upgrades
- Passenger ports continue improving electrical infrastructure to reduce emissions during vessel stays. Connection boxes remain essential equipment.
- Port retrofits
- Existing terminals are adding shore power without rebuilding entire waterfronts. Retrofit activity creates consistent project demand.
- Smart energy monitoring
- Digital metering improves energy management and equipment performance. Operators gain better visibility into electricity use.
- Naval shore power
- Defense facilities are gradually expanding shore connection capability. Modern electrical systems improve operational efficiency.
Restraints Impact Analysis
| RESTRAINT | (~) % IMPACT ON CAGR | GEOGRAPHIC RELEVANCE | IMPACT TIMELINE |
|---|---|---|---|
| High installation costs | -0.7% | Global | Medium term (2-4 years) |
| Grid upgrade requirements | -0.5% | Developing regions | Long term (≥4 years) |
| Complex retrofit projects | -0.4% | Older ports | Medium term (2-4 years) |
| Lengthy approval procedures | -0.3% | Public infrastructure | Medium term (2-4 years) |
Source: Fact.MR analysis. Updated Jul 6, 2026
- High installation costs
- Electrical infrastructure upgrades require significant investment before shore connection systems become operational.
- Grid upgrade requirements
- Some ports need additional utility capacity before supporting high power shore connections. This extends project timelines.
- Complex retrofit projects
- Older terminals often require engineering modifications before new electrical equipment can be installed safely.
- Approval procedures
- Large port infrastructure projects usually pass through detailed technical reviews before construction begins.
Which countries are advancing shore power connection box adoption?
United States 12.8%; Germany 12.4%; Japan 12.0%; China 11.7%; India 11.4%.
Based on regional analysis, the shore power connection boxes market is segmented into North America, Europe, East Asia, South Asia, Latin America and Middle East and Africa.
| Country | CAGR |
|---|---|
| United States | 12.8% |
| Germany | 12.4% |
| Japan | 12.0% |
| China | 11.7% |
| India | 11.4% |
Source: Fact.MR analysis. Updated Jul 6, 2026
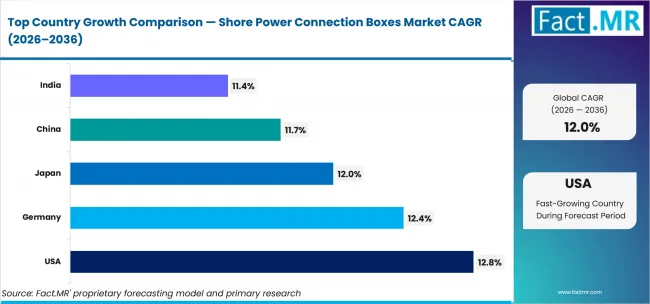
Shore Power Connection Boxes Market Cagr Analysis By Country | Source: Fact.MR
What is encouraging market expansion in the United States?
12.8% CAGR, supported by clean port investment and stronger electrical infrastructure.
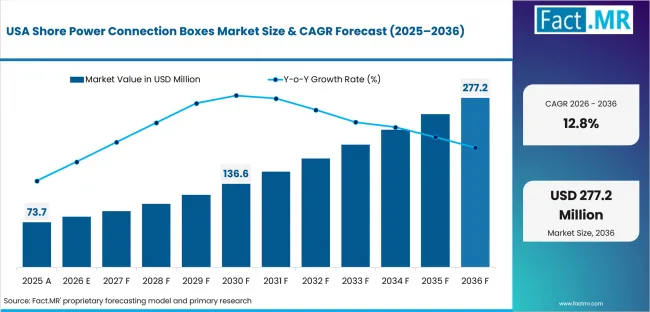
Shore Power Connection Boxes Market Country Value Analysis | Source: Fact.MR
The United States is projected to record 12.8% CAGR from 2026 to 2036 as ports continue expanding shore power facilities across major shipping corridors. Infrastructure funding is supporting new electrical connection projects at commercial terminals. Cruise ports and container facilities are giving greater priority to low emission operations. Suppliers with dependable marine connection equipment are expected to benefit from long term investment.
Why is Germany strengthening demand?
12.4% CAGR, backed by waterfront electrification and energy transition.
Germany is expected to achieve 12.4% CAGR by 2036 because ports continue integrating shore power into terminal modernization programs. Reliable connection equipment has become an important part of electrical safety planning. Marine operators also seek standardized systems that simplify daily operations.
What supports Japan's market outlook?
12.0% CAGR, driven by efficient harbor infrastructure.
Japan is likely to register 12.0% CAGR because ports continue improving electrical systems for commercial shipping. Space efficient equipment remains important across busy waterfront facilities. Greater attention to operational reliability supports steady demand for advanced connection technology.
Why does China remain an important market?
11.7% CAGR, supported by expanding coastal infrastructure.
China is forecast to expand at 11.7% CAGR through 2036 as commercial ports continue investing in cleaner marine operations. New terminals increasingly include shore power during project development. Modern electrical infrastructure is also improving demand for integrated connection equipment.
How is India creating new growth opportunities?
11.4% CAGR, driven by green port programs and infrastructure upgrades.
India is expected to record 11.4% CAGR by 2036 as port authorities continue improving environmental performance across major maritime hubs. New electrical projects are creating demand for dependable shore connection equipment. Continued infrastructure investment is expected to support future market expansion.
Who leads the shore power connection boxes market?
Cavotec shape market competition.
The market brings together companies with strong experience in electrification, marine engineering and port infrastructure. Cavotec has established a broad portfolio focused on shore connection technology for commercial ports. ABB combines marine electrical systems with automation capabilities that support complex shore power projects.
Schneider Electric develops electrical distribution solutions designed for reliable marine operation. Siemens strengthens the market through industrial automation and power infrastructure expertise. Wärtsilä integrates shore connection equipment within wider marine energy solutions. PowerCon focuses on high performance connectors developed for demanding electrical applications.
Competition is increasingly influenced by engineering support rather than equipment alone. Customers value installation expertise, long service life and compatibility with future electrical upgrades. Suppliers that simplify commissioning and provide dependable aftersales support are expected to strengthen their position.
Which companies are the key providers?
Cavotec and ABB are leading providers. Schneider Electric and Siemens remain established participants. Wärtsilä, PowerCon complete the competitive landscape.
- Cavotec
- ABB
- Schneider Electric
- Siemens
- Wärtsilä
- PowerCon
Bibliography
- ABB. (2026, January 5). Rotterdam Shore Power selects ABB for world’s largest shore power project. ABB.
- Cavotec. (2026, June 26). Cavotec signs shore power order for cruise terminal expansion in Southern California. Cavotec.
- ABB. (2025, June 5). Port of Toulon celebrates milestone installation in France with ABB shore power technology. ABB.
- Cavotec. (2025, October 6). Cavotec signs orders worth a total of EUR 9.35 million for shore power systems for newly built and existing container vessels. Cavotec.
- Schneider Electric. (2025, September 16). How our shore power technology is driving decarbonization at the Port of Sète. Schneider Electric.
- Siemens. (2026). SIHARBOR: Shore connection power supply system for ships. Siemens.
- Wärtsilä. (2026). Shore power solutions for ships. Wärtsilä.
- PowerCon. (2026). Shore power. PowerCon.
This Report Addresses
- Strategic assessment of shore power connection boxes across port electrification and marine energy infrastructure.
- Segment evaluation covering Medium-voltage Interface and Cruise Ships.
- Country outlook for the United States, Germany, Japan, China and India.
- Competitive review of Cavotec, ABB, Schneider Electric, Siemens, Wärtsilä, PowerCon.
- Technology review covering IP-rated enclosures, automated connection boxes, metering systems, safety disconnect functions and arc protection.
- Operational assessment covering ferry terminals, cruise ports, container terminals, naval facilities and harbor operations.
- Market estimates supported by engineering studies, infrastructure tracking and industry interviews.
What does the shore power connection boxes market cover?
Electrical interface equipment designed for shore to ship power transfer.
The market includes low voltage sockets, medium voltage interfaces, plug in cabinets and automated connection boxes. These products provide secure electrical access between port infrastructure and marine vessels.
The assessment is limited to dedicated shore power connection equipment. Standard industrial electrical enclosures and general switchgear remain outside the market definition.
What is included in the scope?
Connection systems developed for marine shore power applications.
The study covers IP rated enclosures, interlock systems, metering functions, safety disconnect devices and arc protection technology. It also includes fixed quay installations, mobile connection boxes, retrofit projects and new port electrification programs.
Applications span ferries, cruise ships, container vessels, navy vessels and harbor craft. The study evaluates products supplied to port operators, electrical contractors, shipowners and utilities.
What is excluded from the scope?
Electrical products without shore connection capability are excluded.
The assessment excludes onboard generators, marine transformers, power converters and cable reels supplied without dedicated connection boxes. Conventional industrial distribution panels are also outside the study scope.
How was the analysis built?
109+ sources, 40+ company portfolios, 30+ countries, 24+ interviews.
- Primary Research:
- Port engineers, electrical consultants, marine contractors and equipment suppliers contributed technical insights. Utility specialists and shipyard professionals also participated in the research process.
- Desk Research:
- The study reviewed company portfolios, electrification programs, engineering publications and maritime environmental initiatives. Product announcements and infrastructure projects supported market assessment.
- Market Sizing and Forecasting:
- Forecasts were prepared using port electrification spending, vessel retrofit activity, waterfront infrastructure investment and equipment adoption across major maritime regions.
- Data Validation and Update Cycle:
- Market estimates were verified through supplier discussions, project tracking and expert review. Procurement activity and installation trends supported the final forecast.
Segmentation
What is the report's scope and coverage?
| Attribute | Details |
|---|---|
| Quantitative Units | USD Million in 2026 to USD Million by 2036 at CAGR |
| Market Definition | Shore power connection boxes and shore-side/socket-box interfaces used for ship-to-shore electrical power connections |
| Connection Type | Low voltage; medium voltage; high voltage shore connection |
|
Vessel Segment |
Ferries, Cruise ships, Container vessels, Navy vessels, Harbor craft |
Protection |
IP-rated enclosure, Interlock, Metering, Safety disconnect, Arc protection |
| Installation |
Fixed quay, Mobile box, Retrofit terminal, New port electrification |
| Buyer Type |
Port operators, Electrical contractors, Shipowners, Utilities |
| Regions Covered | North America; Europe; East Asia; South Asia; Latin America; Middle East and Africa |
| Countries Covered | United States; Germany; Japan; China; India |
| Key Companies Profiled |
Cavotec, ABB, Schneider Electric, Siemens, Wärtsilä . |
| Forecast Period | 2026 to 2036 |
| Approach | Hybrid top down and bottom up approach using port electrification projects, vessel retrofit activity, infrastructure spending and expert validation |
Source: Fact.MR analysis. Updated Jul 6, 2026
How is the market segmented?
-
By Connection Type:
- Low-voltage sockets
- Medium-voltage interface
- Plug-in cabinets
- Automated connection boxes
-
By Vessel Segment:
- Ferries
- Cruise ships
- Container vessels
- Navy vessels
- Harbor craft
-
By Protection:
- IP-rated enclosure
- Interlock
- Metering
- Safety disconnect
- Arc protection
-
By Installation:
- Fixed quay
- Mobile box
- Retrofit terminal
- New port electrification
-
By Buyer Type:
- Port operators
- Electrical contractors
- Shipowners
- Utilities
-
Region:
- North America
- United States
- Canada
- Europe
- Germany
- United Kingdom
- France
- Italy
- Spain
- Asia Pacific
- China
- Japan
- South Korea
- India
- Singapore
- Latin America
- Brazil
- Mexico
- Argentina
- Middle East & Africa
- GCC Countries
- South Africa
- Israel
- North America
Frequently Asked Questions
Which connection type leads the Shore Power Connection Boxes Market?
Which vessel segment leads the Shore Power Connection Boxes Market?
Which protection feature leads the Shore Power Connection Boxes Market?
Which installation type leads the Shore Power Connection Boxes Market?
Which buyer type leads the Shore Power Connection Boxes Market?
Which region leads the Shore Power Connection Boxes Market?
Which country expands fastest in the Shore Power Connection Boxes Market?
How does Germany perform in the Shore Power Connection Boxes Market?
How does Japan perform in the Shore Power Connection Boxes Market?
How does China perform in the Shore Power Connection Boxes Market?
Who worked on this report


Preview the report firsthand - request a free sample
Free SampleGet the brochure for pricing and purchase details
Download PDF