Silicon Carbide Composites Market

Silicon Carbide Composites Market Analysis, By Composite Type (Ceramic Matrix Composites (CMCs), Metal Matrix Composites (MMCs), Polymer Matrix Composites (PMCs), and Others), By Reinforcement Type, By Manufacturing Process, By End-Use Industry (Aerospace and Defense, Automotive, Energy, Electronics and Semiconductors, Nuclear, and Others), and Region - Market Insights 2025 to 2035

CMCs projected to grow at a CAGR of 15.4%, whereas another segment PMCs likely to grow at 18.1%. In terms of countries, India projected to grow at 17.6%, followed by China at 17.3 and U.S. to grow at 16.2%

Silicon Carbide Composites Market Outlook 2025 to 2035

The global silicon carbide composites market is expected to reach USD 5,708.1 million by 2035, up from USD 1,034.2 million in 2024. During the forecast period, the industry is projected to expand at a CAGR of 16.8%.

Rising demand in aerospace, defense, and EV sectors, as well as superior thermal and mechanical properties, technological advancements in processing, regulatory push for lightweight, fuel-efficient materials, and growth in nuclear and renewable energy applications.

Silicon Carbide Composites Market Value (USD Million) 2025 To 2035

What are the drivers of Silicon Carbide Composites market?

A combination of industrial utilization trends, material technological improvements, and expanding sector performance standards underpins the growth of the silicon Carbide (SiC) composites market.

Lightweight materials with high-temperature resistance have become essential to aerospace and defense applications. Commercial and military aircraft benefit from Silicon Carbide composites because they offer superior strength-to-weight ratios and thermal stability, which enable designers to use these materials for turbine parts, heat shields, and structural components, including planes and spacecraft.

The automotive industry's focus on power electronics alongside braking systems and structural weight reduction has driven the EV sector to utilize SiC composites more frequently. High temperatures, combined with corrosive conditions, enable SiC composites to expand their applications in nuclear and renewable energy systems through their use in heat exchangers and reactor components.

The reduction of production expenses through improved composite fabrication techniques, incorporating chemical vapor infiltration, polymer infiltration, and pyrolysis systems, leads to simpler commercialization of complex component designs.

As manufacturers pursue industrial automation alongside a growing need for durable components in harsh environments, such as those found in chemical processing and metallurgy, their applications continue to expand.

Surface engineering discovery, along with microstructural control, has reformed material trends, thereby solidifying SiC composites' role as foundational materials for future engineering applications.

What are the regional trends of Silicon Carbide Composites market?

The silicon carbide composites market advances most rapidly in North America because it’s aerospace and defense industries remain at high levels of development. Programs for military modernization, alongside the rapid pace of space exploration, demand high-performance SiC composites due to the substantial financial investments made in these initiatives.

The market grows steadily because of both robust research and development infrastructure, as well as state-sponsored innovation programs.

European nations, including Germany, France, and the UK, focus on lightweight materials to advance their automotive and aerospace manufacturing sectors. The combination of strict environmental regulations and fuel efficiency mandates in this region has caused SiC composites to quickly enter hybrid and electric vehicles.

The Asia-Pacific proves to be the market's fastest-growing area thanks to its rapid industrial development, infrastructure construction, and homegrown defense projects, combined with energy initiatives.

The three Asian nations, Japan, China, and South Korea, lead the scene with budget-friendly production capabilities as they expand their investment efforts in novel materials for both their local markets and international export needs.

What are the challenges and restraining factors of Silicon Carbide Composites market?

Despite strong growth prospects, the Silicon Carbide (SiC) composites market performs its widespread adoption encounters various obstacles. The main obstacle to widespread adoption results from manufacturing costs run high because of complex energy-intensive techniques including chemical vapor infiltration (CVI) and polymer infiltration and pyrolysis (PIP).

The manufacturing methods demand both exact control measures and extended processing durations, which drive up production expenses and limit scalability for large-scale manufacturing operations.

The fabrication of SiC composites faces obstacles from both the lack of experienced professionals and skilled experts, who limit its ability to achieve high standards of quality and develop new solutions. Standardization processes across various industry sectors remain incomplete, which hinders the ability of technical systems to interact with one another.

The worldwide availability of high-purity silicon carbide and reinforcement fibers is hindered by supply chain uncertainties and risks stemming from geopolitical dynamics. The production methods of SiC composites, which can lead to environmental energy issues and waste production, may result in heightened regulatory oversight, potentially leading to additional compliance expenses. These elements combine to restrict business development, especially among applications that focus on costs.

Country-Wise Outlook

U.S. Leadership in High-Performance Silicon Carbide Composites Driven by Defense, Aerospace, and Energy Sectors

Silicon Carbide Composites Market By Country

The United States maintains its position as the world's leading producer of high-performance Silicon Carbide composites through fundamental research initiatives, combined with defense requirements and the needs of the aerospace sector. General Electric and 3M lead American businesses in SiC technology development for various applications, including gas turbine engines, as well as thermal protection systems and lightweight armored components.

Government-supported defense projects in collaboration with NASA enable the United States to lead worldwide advances in ceramic matrix composite technology (CMC). The aerospace, automotive, and energy sectors drive domestic SiC component demand because these materials demonstrate excellent performance when exposed to extreme temperatures and mechanical stress.

US Silicon Carbide Composites Market Value (USD Million) 2025 To 2035

EV power electronics and renewable energy infrastructure drive the growing adoption of SiC semiconductors because of their energy efficiency requirements. The United States maintains its position as a leader in premium-grade SiC composites because of stringent purity requirements and technological advances supported by government military investments and private sector sponsorship.

China’s Dominance in Silicon Carbide Composites Fueled by Manufacturing Scale, EV Demand, and Strategic Policy Support

China leads global Silicon Carbide (SiC) composite production due to its extensive manufacturing sector, along with its abundant raw materials and government support for performance-driven materials. Integrated supply chains, cost-efficient manufacturing, combined with the rapid adoption of SiC in electric vehicles (EVs), rail transport sectors, and aerospace applications, benefit China significantly.

SiC materials from Weifang Huawei and Ningxia Tianjing specialize in power electronics components, as well as load-bearing applications. China achieves market growth in exports through pricing competitiveness coupled with massive manufacturing capabilities. The SiC composites manufacturing leadership position in China extends from its ability to produce high-volume materials at competitive low costs, which is particularly beneficial for global industries seeking thermally stable, lightweight materials.

Japan’s Role in Advancing Silicon Carbide Composites Through Precision Engineering, Automotive Innovation, and Clean Manufacturing

The global silicon carbide composites market relies heavily on Japan due to its expertise in precision engineering, combined with superior materials production and advancements in automotive and electronics development. Japanese manufacturers lead the world in microstructure control techniques, resulting in advanced SiC products with enhanced thermal conductivity characteristics and improved mechanical strength performance.

Japanese manufacturers meet domestic automotive requirements for SiC-based components, including heat exchangers, brake systems, and power modules, due to their established presence in the hybrid and electric vehicle sector. Through its investments in next-generation power systems, Japan increases its consumption of SiC material for advanced smart energy applications.

Japan excels in producing premium, reliable SiC composite materials due to its robust intellectual property rights infrastructure, stringent manufacturing standards, and collaborative relationships with global automobile manufacturers.

Category-Wise Analysis

By Composite Type – Ceramic Matrix Composites (CMCs) Dominate the Market Due to High Temperature Resistance

Silicon Carbide Composites Market By Composite Type

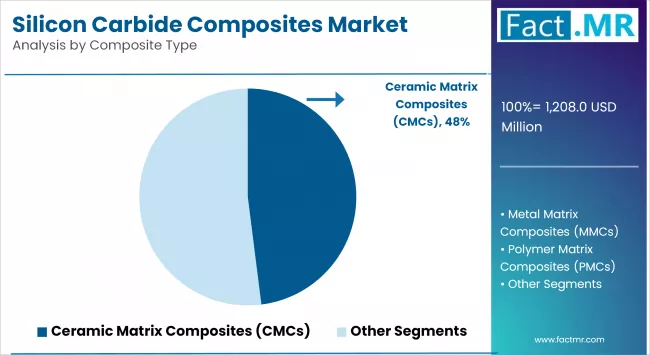
Within the silicon carbide composites market Ceramic Matrix Composites (CMCs) represent the highest performing material segment. The aerospace defense sector chooses CMCs because they demonstrate superior resistance to corrosive elements heat and shock due to their exceptional thermal properties. The extreme conditions present in jet engines and turbine blades and hypersonic vehicles render CMCs an ideal material due to their native mechanical stability under adverse conditions. The market's drive toward increased fuel efficiency combined with reduced carbon emissions makes CMCs attractive because they reduce overall weight substantially when compared with conventional metallic construction elements.

Manufacturing of CMCs through Chemical Vapor Infiltration (CVI) produces dense defect-free structures which exhibit exceptional bonding performance. The penetration of this material into low-cost markets remains constrained by production cost expenses and manufacturing duration.

The accelerated adoption of CMCs depends on regulatory support from aerospace authorities and military agencies who create material standards and certifications. CMCs continue to grow their applicability into energy systems and nuclear environments thanks to research developments that optimize production costs through hybrid processing methods and enhance market performance across high-end applications.

By Reinforcement Type – Continuous Fibers Reinforcement Leads Due to Enhanced Mechanical Strength

Silicon Carbide Composites Market By Reinforcement

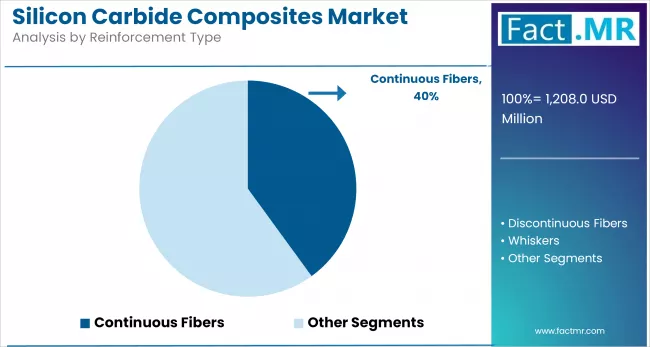
Silicon carbide composites market technology leads with continuous fiber reinforcement specifically when combined with ceramic matrix systems. The use of these fibers enables composites to maintain exceptional mechanical integrity and enhanced fracture toughness which allows them to operate under extreme operational stresses without breaking catastrophically. Their extended fiber layout efficiently moves load distances throughout design elements such as aerospace engines and defense applications and turbine housing systems.

Forward laser etching of continuous fiber-reinforced composites at high temperatures enables both dimensional retention and protection against creep elements. Modern ceramic coating techniques like CVI link tightly to this reinforcement method by applying ceramic material precisely across fiber networks to produce tough reliable matrices. These materials provide sufficient strength-to-weight performance and endurance capabilities to warrant their high cost application in critical systems.

Technological innovation is focused on enhancing fiber-matrix bonding and integrating next-gen materials such as SiC-SiC composites. With aerospace propulsion and hypersonic research driving material demands, continuous fibers are becoming a cornerstone in the evolution of high-performance composite engineering.

Competitive Analysis

The silicon carbide composites market contains companies of multinational scale alongside specialized material innovation experts. Main industry players compete based on their capabilities to create high-performance ceramics while delivering thermal resistance and lightweight structural applications. The market demand originates from aerospace, energy and electronics industries which requires improved fuel economy together with high-temperature functionality.

The market demands innovation in chemical vapor infiltration and sintering processes to function as a critical differentiating factor for companies in this industry. The rising importance of sustainability along with environmental requirements modifies both raw material selection and manufacturing methods.

A continuous wave of consolidation takes place within the market through planned partnerships alongside vertical integration and purposeful acquisitions. Companies from Asia-Pacific and other emerging regions drive market competition because they execute cost-efficient manufacturing combined with quick production scaling abilities. High-tech material innovation receives support from the current state of the market.

Key players in the market are COI Ceramics, General Electric, Rolls-Royce, SGL Carbon, Kyocera, Ube Industries, NGS Advanced Fibers, Suzhou Saifei Group, Saint-Gobain, Morgan Advanced Materials, CoorsTek, CeramTec, Schunk Group, and Tokai Carbon.

Recent Development

  • In March 2025, the Schunk Group completed the acquisition of ESK-SIC GmbH, a raw materials manufacturer specializing in silicon carbide. This strategic move allows Schunk to broaden its product portfolio and strengthen its position in the SiC market, particularly benefiting its IntrinSiC business, which focuses on 3D-printed silicon carbide components.
  • In February 2024, Kyocera Fineceramics Europe GmbH and ESK-SIC GmbH announced a partnership to improve the efficiency and sustainability of the silicon carbide value chain. The collaboration focuses on developing new manufacturing technologies, optimizing production processes, and establishing circular economy principles for recycling SiC materials.

Fact.MR has provided detailed information about the price points of key manufacturers of Silicon Carbide Composites Market positioned across regions, sales growth, production capacity, and speculative technological expansion, in the recently published report.

Segmentation of Silicon Carbide Composites market

  • By Composite Type :

    • Ceramic Matrix Composites (CMCs)
    • Metal Matrix Composites (MMCs)
    • Polymer Matrix Composites (PMCs)
    • Others
  • By Reinforcement Type :

    • Continuous Fibers
    • Discontinuous Fibers
    • Whiskers
    • Particles
    • Others
  • By Manufacturing Process :

    • Chemical Vapor Infiltration (CVI)
    • Polymer Infiltration and Pyrolysis (PIP)
    • Hot Pressing
    • Sintering
    • Others
  • By End-Use Industry :

    • Aerospace and Defense
    • Automotive
    • Energy
    • Electronics and Semiconductors
    • Nuclear
    • Others
  • By Region :

    • North America
    • Latin America
    • Western Europe
    • Eastern Europe
    • East Asia
    • South Asia & Pacific
    • Middle East & Africa

Table of Content

  1. Executive Summary
    • Global Market Outlook
    • Demand-side Trends
    • Supply-side Trends
    • Technology Roadmap Analysis
    • Analysis and Recommendations
  2. Market Overview
    • Market Coverage / Taxonomy
    • Market Definition / Scope / Limitations
  3. Market Background
    • Market Dynamics
      • Drivers
      • Restraints
      • Opportunity
      • Trends
    • Scenario Forecast
      • Demand in Optimistic Scenario
      • Demand in Likely Scenario
      • Demand in Conservative Scenario
    • Opportunity Map Analysis
    • Product Life Cycle Analysis
    • Supply Chain Analysis
      • Supply Side Participants and their Roles
        • Producers
        • Mid-Level Participants (Traders/ Agents/ Brokers)
        • Wholesalers and Distributors
      • Value Added and Value Created at Node in the Supply Chain
      • List of Raw Material Suppliers
      • List of Existing and Potential Buyers
    • Investment Feasibility Matrix
    • Value Chain Analysis
      • Profit Margin Analysis
      • Retailers
    • PESTLE and Porter’s Analysis
    • Regulatory Landscape
      • By Key Regions
      • By Key Countries
    • Production and Consumption Statistics
    • Import and Export Statistics
  4. Global Silicon Carbide Composites Market Analysis 2020-2024 and Forecast, 2025-2035
    • Historical Market Size Value (USD Mn) & Volume (Tons) Analysis, 2020-2024
    • Current and Future Market Size Value (USD Mn) & Volume (Tons) Projections, 2025-2035
      • Y-o-Y Growth Trend Analysis
      • Absolute $ Opportunity Analysis
  5. Global Silicon Carbide Composites Market Pricing Analysis 2020-2024 and Forecast 2025-2035
  6. Global Silicon Carbide Composites Market Analysis 2020-2024 and Forecast 2025-2035, By Composite Type
    • Introduction / Key Findings
    • Historical Market Size Value (USD Mn) & Volume (Tons) Analysis By Composite Type, 2020-2024
    • Current and Future Market Size Value (USD Mn) & Volume (Tons) Analysis and Forecast By Composite Type, 2025-2035
      • Ceramic Matrix Composites (CMCs)
      • Metal Matrix Composites (MMCs)
      • Polymer Matrix Composites (PMCs)
      • Others
    • Y-o-Y Growth Trend Analysis By Composite Type, 2020-2024
    • Absolute $ Opportunity Analysis By Composite Type, 2025-2035
  7. Global Silicon Carbide Composites Market Analysis 2020-2024 and Forecast 2025-2035, By Reinforcement Type
    • Introduction / Key Findings
    • Historical Market Size Value (USD Mn) & Volume (Tons) Analysis By Reinforcement Type, 2020-2024
    • Current and Future Market Size Value (USD Mn) & Volume (Tons) Analysis and Forecast By Reinforcement Type, 2025-2035
      • Continuous Fibers
      • Discontinuous Fibers
      • Whiskers
      • Particles
      • Others
    • Y-o-Y Growth Trend Analysis By Reinforcement Type, 2020-2024
    • Absolute $ Opportunity Analysis By Reinforcement Type, 2025-2035
  8. Global Silicon Carbide Composites Market Analysis 2020-2024 and Forecast 2025-2035, By Manufacturing Process
    • Introduction / Key Findings
    • Historical Market Size Value (USD Mn) & Volume (Tons) Analysis By Manufacturing Process, 2020-2024
    • Current and Future Market Size Value (USD Mn) & Volume (Tons) Analysis and Forecast By Manufacturing Process, 2025-2035
      • Chemical Vapor Infiltration (CVI)
      • Polymer Infiltration and Pyrolysis (PIP)
      • Hot Pressing
      • Sintering
      • Others
    • Y-o-Y Growth Trend Analysis By Manufacturing Process, 2020-2024
    • Absolute $ Opportunity Analysis By Manufacturing Process, 2025-2035
  9. Global Silicon Carbide Composites Market Analysis 2020-2024 and Forecast 2025-2035, By End-Use Industry
    • Introduction / Key Findings
    • Historical Market Size Value (USD Mn) & Volume (Tons) Analysis By End-Use Industry, 2020-2024
    • Current and Future Market Size Value (USD Mn) & Volume (Tons) Analysis and Forecast By End-Use Industry, 2025-2035
      • Aerospace and Defense
      • Automotive
      • Energy
      • Electronics and Semiconductors
      • Nuclear
      • Others
    • Y-o-Y Growth Trend Analysis By End-Use Industry, 2020-2024
    • Absolute $ Opportunity Analysis By End-Use Industry, 2025-2035
  10. Global Silicon Carbide Composites Market Analysis 2020-2024 and Forecast 2025-2035, By Region
    • Introduction
    • Historical Market Size Value (USD Mn) & Volume (Tons) Analysis By Region, 2020-2024
    • Current Market Size Value (USD Mn) & Volume (Tons) Analysis and Forecast By Region, 2025-2035
      • North America
      • Latin America
      • Western Europe
      • East Asia
      • South Asia Pacific
      • Eastern Europe
      • Middle East & Africa
    • Market Attractiveness Analysis By Region
  11. North America Silicon Carbide Composites Market Analysis 2020-2024 and Forecast 2025-2035, By Country
    • Historical Market Size Value (USD Mn) & Volume (Tons) Trend Analysis By Market Taxonomy, 2020-2024
    • Market Size Value (USD Mn) & Volume (Tons) Forecast By Market Taxonomy, 2025-2035
      • By Country
        • U.S.
        • Canada
        • Mexico
      • By Composite Type
      • By Reinforcement Type
      • By Manufacturing Process
      • By End-Use Industry
    • Market Attractiveness Analysis
      • By Country
      • By Composite Type
      • By Reinforcement Type
      • By Manufacturing Process
      • By End-Use Industry
    • Key Takeaways
  12. Latin America Silicon Carbide Composites Market Analysis 2020-2024 and Forecast 2025-2035, By Country
    • Historical Market Size Value (USD Mn) & Volume (Tons) Trend Analysis By Market Taxonomy, 2020-2024
    • Market Size Value (USD Mn) & Volume (Tons) Forecast By Market Taxonomy, 2025-2035
      • By Country
        • Brazil
        • Chile
        • Rest of Latin America
      • By Composite Type
      • By Reinforcement Type
      • By Manufacturing Process
      • By End-Use Industry
    • Market Attractiveness Analysis
      • By Country
      • By Composite Type
      • By Reinforcement Type
      • By Manufacturing Process
      • By End-Use Industry
    • Key Takeaways
  13. Western Europe Silicon Carbide Composites Market Analysis 2020-2024 and Forecast 2025-2035, By Country
    • Historical Market Size Value (USD Mn) & Volume (Tons) Trend Analysis By Market Taxonomy, 2020-2024
    • Market Size Value (USD Mn) & Volume (Tons) Forecast By Market Taxonomy, 2025-2035
      • By Country
        • Germany
        • Italy
        • France
        • U.K.
        • Spain
        • Russia
        • BENELUX
        • Rest of Europe
      • By Composite Type
      • By Reinforcement Type
      • By Manufacturing Process
      • By End-Use Industry
    • Market Attractiveness Analysis
      • By Country
      • By Composite Type
      • By Reinforcement Type
      • By Manufacturing Process
      • By End-Use Industry
    • Key Takeaways
  14. East Asia Silicon Carbide Composites Market Analysis 2020-2024 and Forecast 2025-2035, By Country
    • Historical Market Size Value (USD Mn) & Volume (Tons) Trend Analysis By Market Taxonomy, 2020-2024
    • Market Size Value (USD Mn) & Volume (Tons) Forecast By Market Taxonomy, 2025-2035
      • By Country
        • China
        • Japan
        • South Korea
      • By Composite Type
      • By Reinforcement Type
      • By Manufacturing Process
      • By End-Use Industry
    • Market Attractiveness Analysis
      • By Country
      • By Composite Type
      • By Reinforcement Type
      • By Manufacturing Process
      • By End-Use Industry
    • Key Takeaways
  15. South Asia Pacific Silicon Carbide Composites Market Analysis 2020-2024 and Forecast 2025-2035, By Country
    • Historical Market Size Value (USD Mn) & Volume (Tons) Trend Analysis By Market Taxonomy, 2020-2024
    • Market Size Value (USD Mn) & Volume (Tons) Forecast By Market Taxonomy, 2025-2035
      • By Country
        • India
        • ASEAN Countries
        • Australia & New Zealand
        • Rest of South Asia Pacific
      • By Composite Type
      • By Reinforcement Type
      • By Manufacturing Process
      • By End-Use Industry
    • Market Attractiveness Analysis
      • By Country
      • By Composite Type
      • By Reinforcement Type
      • By Manufacturing Process
      • By End-Use Industry
    • Key Takeaways
  16. Eastern Europe Silicon Carbide Composites Market Analysis 2020-2024 and Forecast 2025-2035, By Country
    • Historical Market Size Value (USD Mn) & Volume (Tons) Trend Analysis By Market Taxonomy, 2020-2024
    • Market Size Value (USD Mn) & Volume (Tons) Forecast By Market Taxonomy, 2025-2035
      • By Country
        • Russia
        • Poland
        • Hungary
        • Balkan & Baltics
        • Rest of Eastern Europe
      • By Composite Type
      • By Reinforcement Type
      • By Manufacturing Process
      • By End-Use Industry
    • Market Attractiveness Analysis
      • By Country
      • By Composite Type
      • By Reinforcement Type
      • By Manufacturing Process
      • By End-Use Industry
    • Key Takeaways
  17. Middle East & Africa Silicon Carbide Composites Market Analysis 2020-2024 and Forecast 2025-2035, By Country
    • Historical Market Size Value (USD Mn) & Volume (Tons) Trend Analysis By Market Taxonomy, 2020-2024
    • Market Size Value (USD Mn) & Volume (Tons) Forecast By Market Taxonomy, 2025-2035
      • By Country
        • KSA
        • Other GCC Countries
        • Turkiye
        • South Africa
        • Rest of MEA
      • By Composite Type
      • By Reinforcement Type
      • By Manufacturing Process
      • By End-Use Industry
    • Market Attractiveness Analysis
      • By Country
      • By Composite Type
      • By Reinforcement Type
      • By Manufacturing Process
      • By End-Use Industry
    • Key Takeaways
  18. Key Countries Silicon Carbide Composites Market Analysis
    • Value (USD Mn) & Volume (Tons)ed States
      • Pricing Analysis
      • Market Share Analysis, 2024
        • By Composite Type
        • By Reinforcement Type
        • By Manufacturing Process
        • By End-Use Industry
    • China
      • Pricing Analysis
      • Market Share Analysis, 2024
        • By Composite Type
        • By Reinforcement Type
        • By Manufacturing Process
        • By End-Use Industry
    • Japan
      • Pricing Analysis
      • Market Share Analysis, 2024
        • By Composite Type
        • By Reinforcement Type
        • By Manufacturing Process
        • By End-Use Industry
    • Germany
      • Pricing Analysis
      • Market Share Analysis, 2024
        • By Composite Type
        • By Reinforcement Type
        • By Manufacturing Process
        • By End-Use Industry
  19. Market Structure Analysis
    • Competition Dashboard
    • Competition Benchmarking
    • Market Share Analysis of Top Players
      • By Regional
      • By Composite Type
      • By Reinforcement Type
      • By Manufacturing Process
      • By End-Use Industry
  20. Competition Analysis
    • Competition Deep Dive
      • COI Ceramics
        • Overview
        • Product Portfolio
        • Profitability by Market Segments (Product/Age /Sales Channel/Region)
        • Sales Footprint
        • Strategy Overview
          • Marketing Strategy
          • Product Strategy
          • Channel Strategy
      • General Electric
        • Overview
        • Product Portfolio
        • Profitability by Market Segments (Product/Age /Sales Channel/Region)
        • Sales Footprint
        • Strategy Overview
          • Marketing Strategy
          • Product Strategy
          • Channel Strategy
      • Rolls-Royce
        • Overview
        • Product Portfolio
        • Profitability by Market Segments (Product/Age /Sales Channel/Region)
        • Sales Footprint
        • Strategy Overview
          • Marketing Strategy
          • Product Strategy
          • Channel Strategy
      • SGL Carbon
        • Overview
        • Product Portfolio
        • Profitability by Market Segments (Product/Age /Sales Channel/Region)
        • Sales Footprint
        • Strategy Overview
          • Marketing Strategy
          • Product Strategy
          • Channel Strategy
      • Kyocera
        • Overview
        • Product Portfolio
        • Profitability by Market Segments (Product/Age /Sales Channel/Region)
        • Sales Footprint
        • Strategy Overview
          • Marketing Strategy
          • Product Strategy
          • Channel Strategy
      • Ube Industries
        • Overview
        • Product Portfolio
        • Profitability by Market Segments (Product/Age /Sales Channel/Region)
        • Sales Footprint
        • Strategy Overview
          • Marketing Strategy
          • Product Strategy
          • Channel Strategy
      • NGS Advanced Fibers
        • Overview
        • Product Portfolio
        • Profitability by Market Segments (Product/Age /Sales Channel/Region)
        • Sales Footprint
        • Strategy Overview
          • Marketing Strategy
          • Product Strategy
          • Channel Strategy
      • Suzhou Saifei Group
        • Overview
        • Product Portfolio
        • Profitability by Market Segments (Product/Age /Sales Channel/Region)
        • Sales Footprint
        • Strategy Overview
          • Marketing Strategy
          • Product Strategy
          • Channel Strategy
      • Saint-Gobain
        • Overview
        • Product Portfolio
        • Profitability by Market Segments (Product/Age /Sales Channel/Region)
        • Sales Footprint
        • Strategy Overview
          • Marketing Strategy
          • Product Strategy
          • Channel Strategy
      • Morgan Advanced Materials
        • Overview
        • Product Portfolio
        • Profitability by Market Segments (Product/Age /Sales Channel/Region)
        • Sales Footprint
        • Strategy Overview
          • Marketing Strategy
          • Product Strategy
          • Channel Strategy
      • CoorsTek
        • Overview
        • Product Portfolio
        • Profitability by Market Segments (Product/Age /Sales Channel/Region)
        • Sales Footprint
        • Strategy Overview
          • Marketing Strategy
          • Product Strategy
          • Channel Strategy
      • CeramTec
        • Overview
        • Product Portfolio
        • Profitability by Market Segments (Product/Age /Sales Channel/Region)
        • Sales Footprint
        • Strategy Overview
          • Marketing Strategy
          • Product Strategy
          • Channel Strategy
      • Schunk Group
        • Overview
        • Product Portfolio
        • Profitability by Market Segments (Product/Age /Sales Channel/Region)
        • Sales Footprint
        • Strategy Overview
          • Marketing Strategy
          • Product Strategy
          • Channel Strategy
      • Tokai Carbon
        • Overview
        • Product Portfolio
        • Profitability by Market Segments (Product/Age /Sales Channel/Region)
        • Sales Footprint
        • Strategy Overview
          • Marketing Strategy
          • Product Strategy
          • Channel Strategy
      • Other Market Players
        • Overview
        • Product Portfolio
        • Profitability by Market Segments (Product/Age /Sales Channel/Region)
        • Sales Footprint
        • Strategy Overview
          • Marketing Strategy
          • Product Strategy
          • Channel Strategy
  21. Assumptions & Acronyms Used
  22. Research Methodology

List Of Table

  • Table 1: Global Market Value (USD Million) Forecast by Region, 2025 to 2035
  • Table 2: Global Market Volume (Tons) Forecast by Region, 2025 to 2035
  • Table 3: Global Market Value (USD Million) Forecast by Composite Type, 2025 to 2035
  • Table 4: Global Market Volume (Tons) Forecast by Composite Type, 2025 to 2035
  • Table 5: Global Market Value (USD Million) Forecast by Reinforcement Type, 2025 to 2035
  • Table 6: Global Market Volume (Tons) Forecast by Reinforcement Type, 2025 to 2035
  • Table 7: Global Market Value (USD Million) Forecast by Manufacturing Process, 2025 to 2035
  • Table 8: Global Market Volume (Tons) Forecast by Manufacturing Process, 2025 to 2035
  • Table 9: Global Market Value (USD Million) Forecast by End-Use Industry, 2025 to 2035
  • Table 10: Global Market Volume (Tons) Forecast by End-Use Industry, 2025 to 2035
  • Table 11: North America Market Value (USD Million) Forecast by Country, 2025 to 2035
  • Table 12: North America Market Volume (Tons) Forecast by Country, 2025 to 2035
  • Table 13: North America Market Value (USD Million) Forecast by Composite Type, 2025 to 2035
  • Table 14: North America Market Volume (Tons) Forecast by Composite Type, 2025 to 2035
  • Table 15: North America Market Value (USD Million) Forecast by Reinforcement Type, 2025 to 2035
  • Table 16: North America Market Volume (Tons) Forecast by Reinforcement Type, 2025 to 2035
  • Table 17: North America Market Value (USD Million) Forecast by Manufacturing Process, 2025 to 2035
  • Table 18: North America Market Volume (Tons) Forecast by Manufacturing Process, 2025 to 2035
  • Table 19: North America Market Value (USD Million) Forecast by End-Use Industry, 2025 to 2035
  • Table 20: North America Market Volume (Tons) Forecast by End-Use Industry, 2025 to 2035
  • Table 21: Latin America Market Value (USD Million) Forecast by Country, 2025 to 2035
  • Table 22: Latin America Market Volume (Tons) Forecast by Country, 2025 to 2035
  • Table 23: Latin America Market Value (USD Million) Forecast by Composite Type, 2025 to 2035
  • Table 24: Latin America Market Volume (Tons) Forecast by Composite Type, 2025 to 2035
  • Table 25: Latin America Market Value (USD Million) Forecast by Reinforcement Type, 2025 to 2035
  • Table 26: Latin America Market Volume (Tons) Forecast by Reinforcement Type, 2025 to 2035
  • Table 27: Latin America Market Value (USD Million) Forecast by Manufacturing Process, 2025 to 2035
  • Table 28: Latin America Market Volume (Tons) Forecast by Manufacturing Process, 2025 to 2035
  • Table 29: Latin America Market Value (USD Million) Forecast by End-Use Industry, 2025 to 2035
  • Table 30: Latin America Market Volume (Tons) Forecast by End-Use Industry, 2025 to 2035
  • Table 31: Western Europe Market Value (USD Million) Forecast by Country, 2025 to 2035
  • Table 32: Western Europe Market Volume (Tons) Forecast by Country, 2025 to 2035
  • Table 33: Western Europe Market Value (USD Million) Forecast by Composite Type, 2025 to 2035
  • Table 34: Western Europe Market Volume (Tons) Forecast by Composite Type, 2025 to 2035
  • Table 35: Western Europe Market Value (USD Million) Forecast by Reinforcement Type, 2025 to 2035
  • Table 36: Western Europe Market Volume (Tons) Forecast by Reinforcement Type, 2025 to 2035
  • Table 37: Western Europe Market Value (USD Million) Forecast by Manufacturing Process, 2025 to 2035
  • Table 38: Western Europe Market Volume (Tons) Forecast by Manufacturing Process, 2025 to 2035
  • Table 39: Western Europe Market Value (USD Million) Forecast by End-Use Industry, 2025 to 2035
  • Table 40: Western Europe Market Volume (Tons) Forecast by End-Use Industry, 2025 to 2035
  • Table 41: East Asia Market Value (USD Million) Forecast by Country, 2025 to 2035
  • Table 42: East Asia Market Volume (Tons) Forecast by Country, 2025 to 2035
  • Table 43: East Asia Market Value (USD Million) Forecast by Composite Type, 2025 to 2035
  • Table 44: East Asia Market Volume (Tons) Forecast by Composite Type, 2025 to 2035
  • Table 45: East Asia Market Value (USD Million) Forecast by Reinforcement Type, 2025 to 2035
  • Table 46: East Asia Market Volume (Tons) Forecast by Reinforcement Type, 2025 to 2035
  • Table 47: East Asia Market Value (USD Million) Forecast by Manufacturing Process, 2025 to 2035
  • Table 48: East Asia Market Volume (Tons) Forecast by Manufacturing Process, 2025 to 2035
  • Table 49: East Asia Market Value (USD Million) Forecast by End-Use Industry, 2025 to 2035
  • Table 50: East Asia Market Volume (Tons) Forecast by End-Use Industry, 2025 to 2035
  • Table 51: South Asia Pacific Market Value (USD Million) Forecast by Country, 2025 to 2035
  • Table 52: South Asia Pacific Market Volume (Tons) Forecast by Country, 2025 to 2035
  • Table 53: South Asia Pacific Market Value (USD Million) Forecast by Composite Type, 2025 to 2035
  • Table 54: South Asia Pacific Market Volume (Tons) Forecast by Composite Type, 2025 to 2035
  • Table 55: South Asia Pacific Market Value (USD Million) Forecast by Reinforcement Type, 2025 to 2035
  • Table 56: South Asia Pacific Market Volume (Tons) Forecast by Reinforcement Type, 2025 to 2035
  • Table 57: South Asia Pacific Market Value (USD Million) Forecast by Manufacturing Process, 2025 to 2035
  • Table 58: South Asia Pacific Market Volume (Tons) Forecast by Manufacturing Process, 2025 to 2035
  • Table 59: South Asia Pacific Market Value (USD Million) Forecast by End-Use Industry, 2025 to 2035
  • Table 60: South Asia Pacific Market Volume (Tons) Forecast by End-Use Industry, 2025 to 2035
  • Table 61: Eastern Europe Market Value (USD Million) Forecast by Country, 2025 to 2035
  • Table 62: Eastern Europe Market Volume (Tons) Forecast by Country, 2025 to 2035
  • Table 63: Eastern Europe Market Value (USD Million) Forecast by Composite Type, 2025 to 2035
  • Table 64: Eastern Europe Market Volume (Tons) Forecast by Composite Type, 2025 to 2035
  • Table 65: Eastern Europe Market Value (USD Million) Forecast by Reinforcement Type, 2025 to 2035
  • Table 66: Eastern Europe Market Volume (Tons) Forecast by Reinforcement Type, 2025 to 2035
  • Table 67: Eastern Europe Market Value (USD Million) Forecast by Manufacturing Process, 2025 to 2035
  • Table 68: Eastern Europe Market Volume (Tons) Forecast by Manufacturing Process, 2025 to 2035
  • Table 69: Eastern Europe Market Value (USD Million) Forecast by End-Use Industry, 2025 to 2035
  • Table 70: Eastern Europe Market Volume (Tons) Forecast by End-Use Industry, 2025 to 2035
  • Table 71: Middle East & Africa Market Value (USD Million) Forecast by Country, 2025 to 2035
  • Table 72: Middle East & Africa Market Volume (Tons) Forecast by Country, 2025 to 2035
  • Table 73: Middle East & Africa Market Value (USD Million) Forecast by Composite Type, 2025 to 2035
  • Table 74: Middle East & Africa Market Volume (Tons) Forecast by Composite Type, 2025 to 2035
  • Table 75: Middle East & Africa Market Value (USD Million) Forecast by Reinforcement Type, 2025 to 2035
  • Table 76: Middle East & Africa Market Volume (Tons) Forecast by Reinforcement Type, 2025 to 2035
  • Table 77: Middle East & Africa Market Value (USD Million) Forecast by Manufacturing Process, 2025 to 2035
  • Table 78: Middle East & Africa Market Volume (Tons) Forecast by Manufacturing Process, 2025 to 2035
  • Table 79: Middle East & Africa Market Value (USD Million) Forecast by End-Use Industry, 2025 to 2035
  • Table 80: Middle East & Africa Market Volume (Tons) Forecast by End-Use Industry, 2025 to 2035

List Of Figures

  • Figure 1: Global Market Volume (Tons) Forecast 2020 to 2035
  • Figure 2: Global Market Pricing Analysis
  • Figure 3: Global Market Value (USD Million) Forecast 2020 to 2035
  • Figure 4: Global Market Value Share and BPS Analysis by Composite Type, 2025 and 2035
  • Figure 5: Global Market Y-o-Y Growth Comparison by Composite Type, 2020 to 2035
  • Figure 6: Global Market Attractiveness Analysis by Composite Type
  • Figure 7: Global Market Value Share and BPS Analysis by Reinforcement Type, 2025 and 2035
  • Figure 8: Global Market Y-o-Y Growth Comparison by Reinforcement Type, 2020 to 2035
  • Figure 9: Global Market Attractiveness Analysis by Reinforcement Type
  • Figure 10: Global Market Value Share and BPS Analysis by Manufacturing Process, 2025 and 2035
  • Figure 11: Global Market Y-o-Y Growth Comparison by Manufacturing Process, 2020 to 2035
  • Figure 12: Global Market Attractiveness Analysis by Manufacturing Process
  • Figure 13: Global Market Value Share and BPS Analysis by End-Use Industry, 2025 and 2035
  • Figure 14: Global Market Y-o-Y Growth Comparison by End-Use Industry, 2020 to 2035
  • Figure 15: Global Market Attractiveness Analysis by End-Use Industry
  • Figure 16: Global Market Value (USD Million) Share and BPS Analysis by Region, 2025 and 2035
  • Figure 17: Global Market Y-o-Y Growth Comparison by Region, 2020 to 2035
  • Figure 18: Global Market Attractiveness Analysis by Region
  • Figure 19: North America Market Incremental $ Opportunity, 2020 to 2035
  • Figure 20: Latin America Market Incremental $ Opportunity, 2020 to 2035
  • Figure 21: Western Europe Market Incremental $ Opportunity, 2020 to 2035
  • Figure 22: East Asia Market Incremental $ Opportunity, 2020 to 2035
  • Figure 23: South Asia Pacific Market Incremental $ Opportunity, 2020 to 2035
  • Figure 24: Eastern Europe Market Incremental $ Opportunity, 2020 to 2035
  • Figure 25: Middle East & Africa Market Incremental $ Opportunity, 2020 to 2035
  • Figure 26: North America Market Value Share and BPS Analysis by Country, 2025 and 2035
  • Figure 27: North America Market Value Share and BPS Analysis by Composite Type, 2025 and 2035
  • Figure 28: North America Market Y-o-Y Growth Comparison by Composite Type, 2020 to 2035
  • Figure 29: North America Market Attractiveness Analysis by Composite Type
  • Figure 30: North America Market Value Share and BPS Analysis by Reinforcement Type, 2025 and 2035
  • Figure 31: North America Market Y-o-Y Growth Comparison by Reinforcement Type, 2020 to 2035
  • Figure 32: North America Market Attractiveness Analysis by Reinforcement Type
  • Figure 33: North America Market Value Share and BPS Analysis by Manufacturing Process, 2025 and 2035
  • Figure 34: North America Market Y-o-Y Growth Comparison by Manufacturing Process, 2020 to 2035
  • Figure 35: North America Market Attractiveness Analysis by Manufacturing Process
  • Figure 36: North America Market Value Share and BPS Analysis by End-Use Industry, 2025 and 2035
  • Figure 37: North America Market Y-o-Y Growth Comparison by End-Use Industry, 2020 to 2035
  • Figure 38: North America Market Attractiveness Analysis by End-Use Industry
  • Figure 39: Latin America Market Value Share and BPS Analysis by Country, 2025 and 2035
  • Figure 40: Latin America Market Value Share and BPS Analysis by Composite Type, 2025 and 2035
  • Figure 41: Latin America Market Y-o-Y Growth Comparison by Composite Type, 2020 to 2035
  • Figure 42: Latin America Market Attractiveness Analysis by Composite Type
  • Figure 43: Latin America Market Value Share and BPS Analysis by Reinforcement Type, 2025 and 2035
  • Figure 44: Latin America Market Y-o-Y Growth Comparison by Reinforcement Type, 2020 to 2035
  • Figure 45: Latin America Market Attractiveness Analysis by Reinforcement Type
  • Figure 46: Latin America Market Value Share and BPS Analysis by Manufacturing Process, 2025 and 2035
  • Figure 47: Latin America Market Y-o-Y Growth Comparison by Manufacturing Process, 2020 to 2035
  • Figure 48: Latin America Market Attractiveness Analysis by Manufacturing Process
  • Figure 49: Latin America Market Value Share and BPS Analysis by End-Use Industry, 2025 and 2035
  • Figure 50: Latin America Market Y-o-Y Growth Comparison by End-Use Industry, 2020 to 2035
  • Figure 51: Latin America Market Attractiveness Analysis by End-Use Industry
  • Figure 52: Western Europe Market Value Share and BPS Analysis by Country, 2025 and 2035
  • Figure 53: Western Europe Market Value Share and BPS Analysis by Composite Type, 2025 and 2035
  • Figure 54: Western Europe Market Y-o-Y Growth Comparison by Composite Type, 2020 to 2035
  • Figure 55: Western Europe Market Attractiveness Analysis by Composite Type
  • Figure 56: Western Europe Market Value Share and BPS Analysis by Reinforcement Type, 2025 and 2035
  • Figure 57: Western Europe Market Y-o-Y Growth Comparison by Reinforcement Type, 2020 to 2035
  • Figure 58: Western Europe Market Attractiveness Analysis by Reinforcement Type
  • Figure 59: Western Europe Market Value Share and BPS Analysis by Manufacturing Process, 2025 and 2035
  • Figure 60: Western Europe Market Y-o-Y Growth Comparison by Manufacturing Process, 2020 to 2035
  • Figure 61: Western Europe Market Attractiveness Analysis by Manufacturing Process
  • Figure 62: Western Europe Market Value Share and BPS Analysis by End-Use Industry, 2025 and 2035
  • Figure 63: Western Europe Market Y-o-Y Growth Comparison by End-Use Industry, 2020 to 2035
  • Figure 64: Western Europe Market Attractiveness Analysis by End-Use Industry
  • Figure 65: East Asia Market Value Share and BPS Analysis by Country, 2025 and 2035
  • Figure 66: East Asia Market Value Share and BPS Analysis by Composite Type, 2025 and 2035
  • Figure 67: East Asia Market Y-o-Y Growth Comparison by Composite Type, 2020 to 2035
  • Figure 68: East Asia Market Attractiveness Analysis by Composite Type
  • Figure 69: East Asia Market Value Share and BPS Analysis by Reinforcement Type, 2025 and 2035
  • Figure 70: East Asia Market Y-o-Y Growth Comparison by Reinforcement Type, 2020 to 2035
  • Figure 71: East Asia Market Attractiveness Analysis by Reinforcement Type
  • Figure 72: East Asia Market Value Share and BPS Analysis by Manufacturing Process, 2025 and 2035
  • Figure 73: East Asia Market Y-o-Y Growth Comparison by Manufacturing Process, 2020 to 2035
  • Figure 74: East Asia Market Attractiveness Analysis by Manufacturing Process
  • Figure 75: East Asia Market Value Share and BPS Analysis by End-Use Industry, 2025 and 2035
  • Figure 76: East Asia Market Y-o-Y Growth Comparison by End-Use Industry, 2020 to 2035
  • Figure 77: East Asia Market Attractiveness Analysis by End-Use Industry
  • Figure 78: South Asia Pacific Market Value Share and BPS Analysis by Country, 2025 and 2035
  • Figure 79: South Asia Pacific Market Value Share and BPS Analysis by Composite Type, 2025 and 2035
  • Figure 80: South Asia Pacific Market Y-o-Y Growth Comparison by Composite Type, 2020 to 2035
  • Figure 81: South Asia Pacific Market Attractiveness Analysis by Composite Type
  • Figure 82: South Asia Pacific Market Value Share and BPS Analysis by Reinforcement Type, 2025 and 2035
  • Figure 83: South Asia Pacific Market Y-o-Y Growth Comparison by Reinforcement Type, 2020 to 2035
  • Figure 84: South Asia Pacific Market Attractiveness Analysis by Reinforcement Type
  • Figure 85: South Asia Pacific Market Value Share and BPS Analysis by Manufacturing Process, 2025 and 2035
  • Figure 86: South Asia Pacific Market Y-o-Y Growth Comparison by Manufacturing Process, 2020 to 2035
  • Figure 87: South Asia Pacific Market Attractiveness Analysis by Manufacturing Process
  • Figure 88: South Asia Pacific Market Value Share and BPS Analysis by End-Use Industry, 2025 and 2035
  • Figure 89: South Asia Pacific Market Y-o-Y Growth Comparison by End-Use Industry, 2020 to 2035
  • Figure 90: South Asia Pacific Market Attractiveness Analysis by End-Use Industry
  • Figure 91: Eastern Europe Market Value Share and BPS Analysis by Country, 2025 and 2035
  • Figure 92: Eastern Europe Market Value Share and BPS Analysis by Composite Type, 2025 and 2035
  • Figure 93: Eastern Europe Market Y-o-Y Growth Comparison by Composite Type, 2020 to 2035
  • Figure 94: Eastern Europe Market Attractiveness Analysis by Composite Type
  • Figure 95: Eastern Europe Market Value Share and BPS Analysis by Reinforcement Type, 2025 and 2035
  • Figure 96: Eastern Europe Market Y-o-Y Growth Comparison by Reinforcement Type, 2020 to 2035
  • Figure 97: Eastern Europe Market Attractiveness Analysis by Reinforcement Type
  • Figure 98: Eastern Europe Market Value Share and BPS Analysis by Manufacturing Process, 2025 and 2035
  • Figure 99: Eastern Europe Market Y-o-Y Growth Comparison by Manufacturing Process, 2020 to 2035
  • Figure 100: Eastern Europe Market Attractiveness Analysis by Manufacturing Process
  • Figure 101: Eastern Europe Market Value Share and BPS Analysis by End-Use Industry, 2025 and 2035
  • Figure 102: Eastern Europe Market Y-o-Y Growth Comparison by End-Use Industry, 2020 to 2035
  • Figure 103: Eastern Europe Market Attractiveness Analysis by End-Use Industry
  • Figure 104: Middle East & Africa Market Value Share and BPS Analysis by Country, 2025 and 2035
  • Figure 105: Middle East & Africa Market Value Share and BPS Analysis by Composite Type, 2025 and 2035
  • Figure 106: Middle East & Africa Market Y-o-Y Growth Comparison by Composite Type, 2020 to 2035
  • Figure 107: Middle East & Africa Market Attractiveness Analysis by Composite Type
  • Figure 108: Middle East & Africa Market Value Share and BPS Analysis by Reinforcement Type, 2025 and 2035
  • Figure 109: Middle East & Africa Market Y-o-Y Growth Comparison by Reinforcement Type, 2020 to 2035
  • Figure 110: Middle East & Africa Market Attractiveness Analysis by Reinforcement Type
  • Figure 111: Middle East & Africa Market Value Share and BPS Analysis by Manufacturing Process, 2025 and 2035
  • Figure 112: Middle East & Africa Market Y-o-Y Growth Comparison by Manufacturing Process, 2020 to 2035
  • Figure 113: Middle East & Africa Market Attractiveness Analysis by Manufacturing Process
  • Figure 114: Middle East & Africa Market Value Share and BPS Analysis by End-Use Industry, 2025 and 2035
  • Figure 115: Middle East & Africa Market Y-o-Y Growth Comparison by End-Use Industry, 2020 to 2035
  • Figure 116: Global Market - Tier Structure Analysis
  • Figure 117: Global Market - Company Share Analysis

- FAQs -

What was the Global Silicon Carbide Composites Market Size Reported by Fact.MR for 2025?

The global silicon carbide composites market was valued at USD 1,208.0 Million in 2025.

Who are the Major Players Operating in the Silicon Carbide Composites market?

Prominent players in the market are COI Ceramics, General Electric, Rolls-Royce, SGL Carbon, Kyocera, Ube Industries.

What is the Estimated Valuation of the Silicon Carbide Composites Market in 2035?

The market is expected to reach a valuation of USD 5,708.1 Million in 2035.

What Value CAGR did the Silicon Carbide Composites Market Exhibit over the Last Five Years?

The historic growth rate of the silicon carbide composites market was 16.2% from 2020-2024.

- Also of Interest -

Silicone Release Coatings Market

Silicone Release Coatings Market Analysis, By Release Force, By Type, By End User and Region - Market Insights 2025 to 2035

Silicone Resins Market

Silicone Resins Market is Segmented By Type, By Function, By Form, By Application & By Region - Global Forecast 2025 to 2035

Silicone Coatings Market

Silicone Coatings Market Analysis, By Type, By Application, and Region - Market Insights 2025 to 2035

Silicone Adhesives Market

Silicone Adhesives Market Analysis, By Type (One-Component, Two-Component, and UV-Cured), By Technology (Pressure Sensitive Adhesives (PSA) and Non-Pressure Sensitive Adhesives), By End-Use Industry (Building and Construction, Transportation, Electrical and Electronics, Healthcare, and Packaging), and Region - Market Insights 2025 to 2035

Silicon Carbide Composites Market

Schedule a Call