TMCP Steel Market

TMCP Steel Market Analysis, By Thickness, By Application, By Product Type, and By Region- Market Insights 2025 to 2035

The 5-20 mm segment is projected to grow at a CAGR of 4.2%, whereas another segment 20-50 mm is likely to grow at 6.6%. In terms of countries US is projected to grow at 5.9%, followed by China at 6.4% and India to grow at 6.8%.

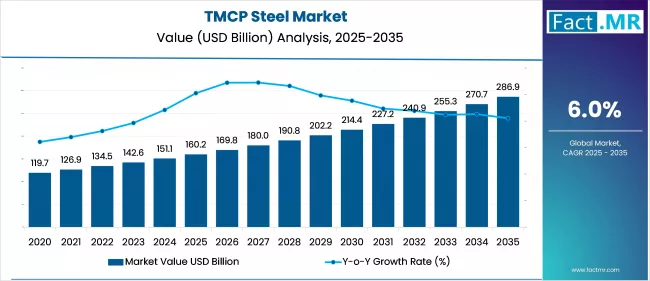
TMCP Steel Market Outlook from 2025 to 2035

The global TMCP steel market is expected to reach USD 286.9 billion by 2035, up from USD 151.1 billion in 2024. During the forecast period 2025 to 2035, the industry is projected to expand at a CAGR of 6.0%.

The market for TMCP (thermo-mechanical control process) steel is supported by growing demand from the shipbuilding and offshore industries, attributed to its strength, weldability and performance at low temperature. Its application in construction is expanding rapidly, particularly in developing economies where thin-gauge but high-strength materials are vital in bridges and buildings.

TMCP Steel Market Value Analysis 2025 To 2035

TMCP steel facilitates sustainability and energy efficiency by allowing for minimized material consumption, lower emissions, and reformulation to meet the standards of green construction and lightweight design.

What are the drivers of the TMCP Steel Market?

The notable mechanical characteristics, such as high strength, excellent weldability, and the ability to work under low temperatures, have made TMCP steel a vital material in both the shipbuilding and offshore industries. These attributes make it suitable for building oil tankers, LNG carriers, container ships, and offshore oil platforms, where structural integrity is essential.

The ongoing expansion in global seaborne trade, combined with the ageing of a significant portion of existing fleets, has led to greater emphasis on building stronger yet lighter vessels. TMCP steel enables marine structures to achieve reduced overall weight without compromising safety, which is cost-effective and ensures maritime safety compliance in global terms.

With an increasing global focus on modernizing infrastructure and advancing urban development, the need to utilize TMCP steel in the construction and civil engineering sector has risen significantly. It is sufficiently strong and tough such that it enables the sections to be smaller without compromising on load-carrying capacity, hence it makes it a suitable material in high-rise buildings, long-span bridges, dams, tunnels, and those that are resistant to earthquakes.

Authorities in Asia, the Middle East, and Latin America are increasing investments in smart cities and transport networks, which also promotes the consumption of steel. The dimensional stability and uniform grain structure of TMCP steel make it safe and durable in structure.

The material also reduces cost of fabrication costs and allows for faster project completion, offering an added benefit that reinforces its adoption in large-scale infrastructure projects.

TMCP steel is increasingly sought after for improving energy efficiency and environmental compatibility within the steel and construction sectors. It enables slimmer and lighter structures, limiting raw material use and reducing carbon emissions associated with steel production and transportation.

These features enable industries to comply with emerging environmental laws and green building standards. Additionally, TMCP's temper strength, as well as its heat-free maintenance, helps reduce energy consumption in the manufacturing process.

Its environmentally compatible properties are reflected in its application across renewable infrastructure, including wind turbine foundations and solar mounting systems. TMCP steel is becoming a material of choice as companies seek to achieve low-carbon operations, aligning with performance, cost efficiency, and meeting their sustainability requirements.

What are the regional trends of the TMCP Steel Market?

The TMCP steel market in Asia Pacific is gaining momentum, supported by infrastructure development, urbanization and shipbuilding in regions such as China, South Korea, and Japan. Steel demand is driven by government mega projects and regional maritime expansion as well as by the preferred use of TMCP grades that provide strength and weldability.

North America is also experiencing an increase in investments in oil and gas pipelines, transport infrastructure, and defense manufacturing facilities, which is driving the adoption of TMCP steel. The U.S. focuses on high-performance materials with environmental and durability standards, reinforcing the use of TMCP.

The European TMCP steel market is necessitated by environmental regulations, sustainable construction initiatives, and advancements in shipbuilding. Support continues for energy-efficient structural steel girders in bridges, wind energy, and marine engineering works.

With ongoing infrastructure reforms, expansion of mining activities and energy projects, Latin America is experiencing a gradual uptake of TMCP steel. Brazil remains a prominent adopter, leveraging TMCP’s mechanical application in the modernization of ports, pipelines and structural systems.

What are the challenges and restraining factors of the TMCP Steel Market?

High cost of production remains a key challenge in the TMCP steel market. Refined thermo-mechanical processing requires enhanced control over quantity and deformation, particularly in temperature regulation, along with highly specialized and skilled labor. This increases the capital and operating cost of steel producers, limiting accessibility for small and medium-sized manufacturers.

Another constraint is the shortage of high-quality raw materials. TMCP steel manufacturing requires a low-impurity slab whose chemical composition is uniform. The fluctuations in the supply of raw materials and inconsistencies in the supply chain have the potential to compromise the steel and hinder its use in large-scale infrastructure and marine applications.

A critical limitation of the TMCP steel market is the limited dissemination of technical knowledge in developing regions. Processing and welding techniques remain unfamiliar to many construction and engineering firms, leading to hesitation in adoption. Insufficient training and lack of supportive industry standards further hinder market entry, particularly in lower-income economies.

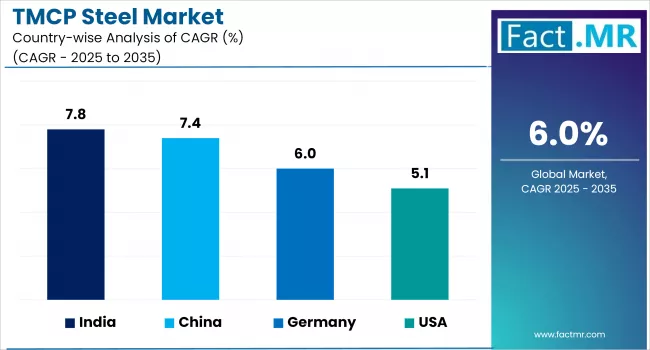
Country-Wise Insights

China’s industrial upgradation and research-driven ecosystem boost TMCP steel market

Tmcp Steel Market Cagr Analysis By Country

This position of the Chinese steel industry in the TMCP steel market is aided by policies made at the national level to enhance the steel capacities and replace imported steel of high strength used in strategic industries such as shipbuilding, defense, and smart infrastructure.

R&D in ultra-low carbon bainitic steels, micro-alloying, and thermomechanical rolling to produce marine-grade is advancing within innovation hubs in Hebei, Jiangsu and Shandong, headlined by entities such as the R&D department of Baosteel and the China Iron & Steel Research Institute. The shift toward lightweight durable and earthquake resistant is reflected in the use of TMCP steel in port infrastructure, LNG vessels, and high-speed railway bridges.

Government-backed procurement incentives and export rebates continue to accelerate domestic production. Electric vehicle chassis and large-scale urban infrastructure projects are now requiring long-term structural stability through weld-able, corrosion-resistant TMCP plates, which until recently were mainly used in marine applications.

Defense priorities and technological standards anchor the USA TMCP steel market

Defense-driven purchasing, high codes of performance and investments in transport and energy infrastructure modernization are some of the advantages the TMCP steel market holds in the United States. R&D centres in Ohio, Pennsylvania, and Texas, under the Department of Energy, and the work of independent labs are developing TMCP formulations optimized in terms of fracture toughness, ballistic resistance, and weld quality, with military applications in shipbuilding and armor.

United States Tmcp Steel Market Value Analysis 2025-2035

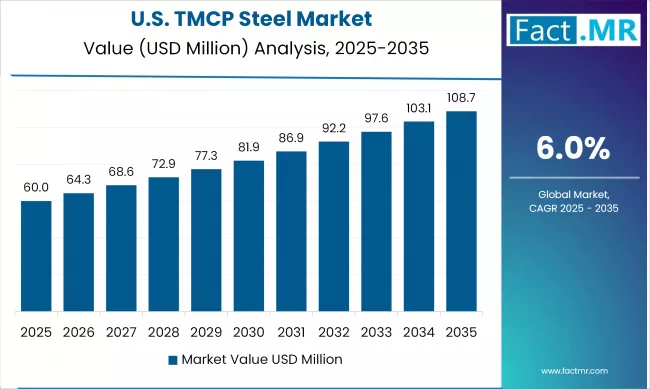
Lightweight strength and stress-resistant reliability are leading to the increasing use of TMCP plates in the U.S. Navy support vessels, in the LNG terminals, and in seismic bridge retrofits. Localized supply chains are further reinforced through infrastructure bills, Buy America requirements, and tax credits to domestic steelmakers. Meanwhile, offshore wind foundation and hydrogen transport pipeline construction support the use of corrosion-resistant TMCP grades with high fatigue lives.

Make in India and infrastructure surge power TMCP steel market growth

The TMCP steel market in India is being driven by policy momentum of the Make in India initiatives and huge investments in transport, energy and marine infrastructure. Odisha and Maharashtra-based innovation centers, including the RDCIS of SAIL and the steel research units of JSW, are optimizing on TMCP plates production through structural bridges, the metro rail and coastal defense applications.

Higher inland waterway volumes, high-rise urban corridors and the growth in ship building in Kochi and Visakhapatnam are growing demand in high-strength, weldable TMCP steels, which are applicable to monsoon conditions and earthquake prone areas.

Government buying directives, import replacement programs, and green steel packages favor domestic manufacturers. City smart schemes and renewable energy technologies address the fatigue resistance, high-temperature tolerance, and lightweight construction capacity of TMCP.

Category-Wise Analysis

High demand for 5-20 mm thickness TMCP plates in compact structural applications

Tmcp Steel Market Analysis By Thickness

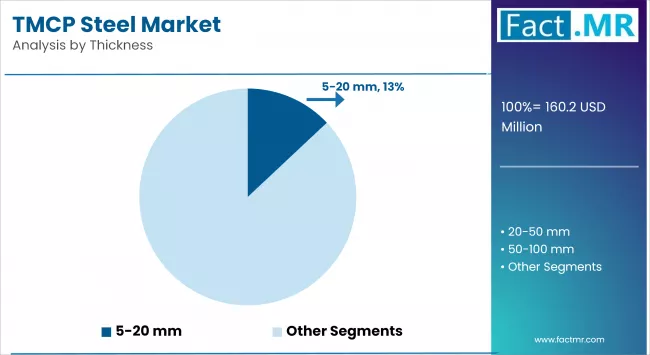
The 5-20mm thick TMCP steel is rapidly being adopted in midweight service where strength-to-weight optimization is important, including ship hull plating, bridgework and metro structures. The band has good weldability, formability, and the surface finish; that is important where the project is critical in regard to aesthetic requirements as well as fatigue effects.

Japan, Korea and Chinese steelmakers are directing R&D at grain refinement and thermo-mechanical rolling in this thickness range, providing improved impact resistance and toughness. Due to the construction scale and the increase of urban density, lighter but high loading frameworks could be constructed using fewer materials with a smaller transportation cost per unit using thinner TMCP plates, and executed by architects and engineers.

Shipbuilding sector drives strategic demand for TMCP steel in marine structures

Tmcp Steel Market Analysis By Application

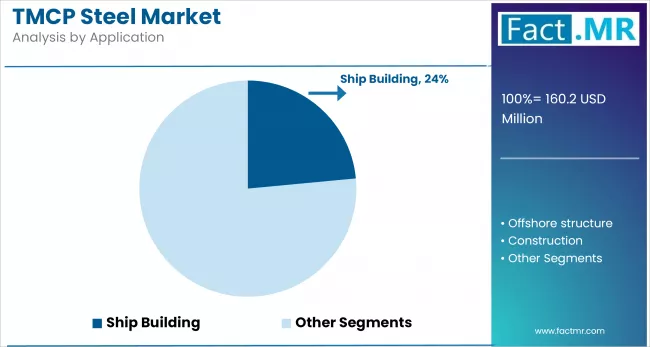
One of the key applications outside the rail sector is shipbuilding, and TMCP steel is being used extensively in liquefied natural gas carriers, naval frigates, containers or cruise vessels all requiring high tensile strength, wear resistance, and enhanced weld performance. TMCP plates normally conform to important marine designations like ABS, DNV and LR making it well suited in the demanding marine environment where cracking and brittle fractures cannot be tolerated.

China, South Korea and the EU shipyards are increasingly utilizing TMCP steel on deck plate, hulls and bulkhead as it has greater fatigue resistance and has the capacity to minimize post-weld heat treatment. TMCP steel enables weight reductions along with increased service life and structural safety that global fleets are targeting as their fleets modernize toward operating with efficiency and sustainability.

Structural steel segment gains momentum with integration of TMCP technology

The structural steel component is adapting to TMCP technology as per the changing construction standards that focus on the structural seismic behavior, fire resistance and greater durability. The TMCP structural steel retains high yield strength, toughness and consistency thus allowing the designer to use thinner, lighter weight material that functions and performs like a thicker conventional plate.

High notch toughness and cold formability of TMCP are applied in the projects of bridges, stadiums, industrial buildings, and wind turbine towers. Asian-Pacific and European governments are requiring higher grades of steel in terms of critical infrastructure as part of the safety code of the country, and they require structural steel producers to use TMCP-treated sections to meet the requirements of performance-based designs and sustainability targets.

Competitive Analysis

TMCP steel market has a mixed character as international makers, national manufacturers with regional focus operate in it and compete by their performance, certification compliance, and the use of contemporary technologies. Companies with integration process and sophisticated progressive technology have an advantage especially where they must meet tight specifications of ship building, offshore engineering and high rise infrastructure.

Certain players have an advantage in the domestic and export markets given their capacity in ensuring uniformity in microstructure, high toughness in notched areas and high weldability. In addition, rolling as well as cooling facilities that can accommodate various end-use requirements are preferred in the contract-driven supply chains.

With government initiatives projects in the infrastructural sector and energy security programs expanding in the area, regional players are emerging with an increase in capacity and partnerships.

The new manufacturers are venturing into the market at providing custom-sized plate and localized tone as service models primarily in the countries with smart urbanization, defense and LNG infrastructure investments. Commercially available certifications on regulatory agencies, as well as understanding on corrosion resistant and seismic grade variants of TMCP are emerging as differentiators.

Competitive rivalry is further intensified by the shift towards reduced weight, low-emission building materials, challenging all stakeholders to increase R&D on alloy chemistry and process automation. Market rivalry is expected to rise as demand for TMCP steel grows in the marine, structural, and renewable energy sectors globally.

Key players in the TMCP steel industry are Hyundai Steel, Nippon Steel Corporation, Victor Steel Co., Baosteel Co. Ltd., Nucor, and others.

Recent Developments

  • In June 2025, EMSTEEL, the only heavy beam and sheet pile producer in the MENA (Middle East and North Africa) region, has partnered with Danieli for a turnkey Thermo-Mechanical Control Process (TMCP) upgrade at its rolling mill 4 in Abu Dhabi.
  • In April 2025, South Korean giants POSCO Holdings Inc. and Hyundai Motor Group are joining forces to implement a large-scale steel project in the United States.

Fact.MR has provided detailed information about the price points of key manufacturers of the TMCP Steel Market positioned across regions, sales growth, production capacity, and speculative technological expansion, in the recently published report.

Methodology and Industry Tracking Approach

The Global TMCP Steel Market 2025 report was generated from feedback of 12,900 people from 35 nations, with about 320 respondents from each regional environment. Structural engineers, metallurgists, steel fabricators, planners of infrastructure projects, safety regulators, and senior R&D professionals from steel innovation centers, and procurement heads and sustainability advisors, were among the key respondents.

Carried out between July 2024 to June 2025, the research entailed a focus on usage behavior, structural reliability in high-stress conditions, compatibility with developing shipbuilding and construction standards, and sustainability-related constraints to TMCP steel uptake using selective and structured questionnaire.

Quantitative observations were taken from weighted statistical models and region-wise adoption indices to provide high precision in market dynamics estimation and segment-level performance. More than 300 reputable sources such as metallurgical research articles, TMCP alloy patent reports, global building codes (ASTM, EN, JIS), and corporate ESG disclosures were analyzed to guide this analysis.

Regression-based modeling and application-centered analysis facilitated the development of strategic strategies advantageous to steel producers, infrastructure developers, marine and energy sector stakeholders, and construction contractors. The report offers advice on the production of high-strength, regulation-approved, and scalable TMCP steel solutions for applications critical in bridges, naval platforms, transport infrastructure, and energy structures focusing on process automation, alloy effectiveness, regulation compliance, and steel lifecycle reliability improvement.

With Fact.MR monitoring consumer behavior, product efficacy, industry trends, and market opportunities since 2018, this report is becoming an authoritative source of information that stakeholders can rely on.

Segmentation of TMCP Steel Market

  • By Thickness :

    • 5 to 20 mm
    • 20-50 mm
    • 50-100 mm
    • 100-120 mm
  • By Application :

    • Ship Building
    • Offshore structure
    • Construction
      • Line pipes
      • Buildings
      • Bridges
      • Penstocks
    • Tanks
      • Cryogenic storage tanks
      • Chemical tanks
    • Commercial Vehicles
      • Earth-moving equipment
      • Cranes
  • By Product Type :

    • Structural Steel
    • Heavy Plates
  • By Region :

    • North America
    • Latin America
    • Western Europe
    • Eastern Europe
    • East Asia
    • South Asia & Pacific
    • Middle East & Africa

Table of Content

  1. Executive Summary
    • Global Market Outlook
    • Demand-side Trends
    • Supply-side Trends
    • Technology Roadmap Analysis
    • Analysis and Recommendations
  2. Market Overview
    • Market Coverage / Taxonomy
    • Market Definition / Scope / Limitations
  3. Market Background
    • Market Dynamics
      • Drivers
      • Restraints
      • Opportunity
      • Trends
    • Scenario Forecast
      • Demand in Optimistic Scenario
      • Demand in Likely Scenario
      • Demand in Conservative Scenario
    • Opportunity Map Analysis
    • Product Life Cycle Analysis
    • Supply Chain Analysis
      • Supply Side Participants and their Roles
        • Producers
        • Mid-Level Participants (Traders/ Agents/ Brokers)
        • Wholesalers and Distributors
      • Value Added and Value Created at Node in the Supply Chain
      • List of Component Suppliers
      • List of Existing and Potential Buyers
    • Investment Feasibility Matrix
    • Value Chain Analysis
      • Profit Margin Analysis
      • Wholesalers and Distributors
      • Retailers
    • PESTLE and Porter’s Analysis
    • Regulatory Landscape
      • By Key Regions
      • By Key Countries
    • Production and Consumption Statistics
    • Import and Export Statistics
  4. Global Market Analysis 2020 to 2024 and Forecast, 2025 to 2035
    • Historical Market Size Value (USD Bn) & Volume (MMT) Analysis, 2020 to 2024
    • Current and Future Market Size Value (USD Bn) & Volume (MMT) Projections, 2025 to 2035
      • Y-o-Y Growth Trend Analysis
      • Absolute $ Opportunity Analysis
  5. Global Market Pricing Analysis 2020 to 2024 and Forecast 2025 to 2035
  6. Global Market Analysis 2020 to 2024 and Forecast 2025 to 2035, By Thickness
    • Introduction / Key Findings
    • Historical Market Size Value (USD Bn) & Volume (MMT) Analysis By Thickness, 2020 to 2024
    • Current and Future Market Size Value (USD Bn) & Volume (MMT) Analysis and Forecast By Thickness, 2025 to 2035
      • 5 to 20 mm
      • 20-50 mm
      • 50-100 mm
      • 100-120 mm
    • Y-o-Y Growth Trend Analysis By Thickness, 2020 to 2024
    • Absolute $ Opportunity Analysis By Thickness, 2025 to 2035
  7. Global Market Analysis 2020 to 2024 and Forecast 2025 to 2035, By Application
    • Introduction / Key Findings
    • Historical Market Size Value (USD Bn) & Volume (MMT) Analysis By Application, 2020 to 2024
    • Current and Future Market Size Value (USD Bn) & Volume (MMT) Analysis and Forecast By Application, 2025 to 2035
      • Ship Building
      • Offshore structure
      • Construction
        • Line pipes
        • Buildings
        • Bridges
        • Penstocks
      • Tanks
        • Cryogenic storage tanks
        • Chemical tanks
      • Commercial Vehicles
        • Earth-moving equipment
        • Cranes
    • Y-o-Y Growth Trend Analysis By Application, 2020 to 2024
    • Absolute $ Opportunity Analysis By Application, 2025 to 2035
  8. Global Market Analysis 2020 to 2024 and Forecast 2025 to 2035, By Product Type
    • Introduction / Key Findings
    • Historical Market Size Value (USD Bn) & Volume (MMT) Analysis By Product Type, 2020 to 2024
    • Current and Future Market Size Value (USD Bn) & Volume (MMT) Analysis and Forecast By Product Type, 2025 to 2035
      • Structural Steel
      • Heavy Plates
    • Y-o-Y Growth Trend Analysis By Product Type, 2020 to 2024
    • Absolute $ Opportunity Analysis By Product Type, 2025 to 2035
  9. Global Market Analysis 2020 to 2024 and Forecast 2025 to 2035, By Region
    • Introduction
    • Historical Market Size Value (USD Bn) & Volume (MMT) Analysis By Region, 2020 to 2024
    • Current Market Size Value (USD Bn) & Volume (MMT) Analysis and Forecast By Region, 2025 to 2035
      • North America
      • Latin America
      • Western Europe
      • East Asia
      • South Asia Pacific
      • Eastern Europe
      • Middle East & Africa
    • Market Attractiveness Analysis By Region
  10. North America Market Analysis 2020 to 2024 and Forecast 2025 to 2035, By Country
    • Historical Market Size Value (USD Bn) & Volume (MMT) Trend Analysis By Market Taxonomy, 2020 to 2024
    • Market Size Value (USD Bn) & Volume (MMT) Forecast By Market Taxonomy, 2025 to 2035
      • By Country
        • U.S.
        • Canada
        • Mexico
      • By Thickness
      • By Application
      • By Product Type
    • Market Attractiveness Analysis
      • By Country
      • By Thickness
      • By Application
      • By Product Type
    • Key Takeaways
  11. Latin America Market Analysis 2020 to 2024 and Forecast 2025 to 2035, By Country
    • Historical Market Size Value (USD Bn) & Volume (MMT) Trend Analysis By Market Taxonomy, 2020 to 2024
    • Market Size Value (USD Bn) & Volume (MMT) Forecast By Market Taxonomy, 2025 to 2035
      • By Country
        • Brazil
        • Chile
        • Rest of Latin America
      • By Thickness
      • By Application
      • By Product Type
    • Market Attractiveness Analysis
      • By Country
      • By Thickness
      • By Application
      • By Product Type
    • Key Takeaways
  12. Western Europe Market Analysis 2020 to 2024 and Forecast 2025 to 2035, By Country
    • Historical Market Size Value (USD Bn) & Volume (MMT) Trend Analysis By Market Taxonomy, 2020 to 2024
    • Market Size Value (USD Bn) & Volume (MMT) Forecast By Market Taxonomy, 2025 to 2035
      • By Country
        • Germany
        • Italy
        • France
        • U.K.
        • Spain
        • Russia
        • BENELUX
        • Rest of Europe
      • By Thickness
      • By Application
      • By Product Type
    • Market Attractiveness Analysis
      • By Country
      • By Thickness
      • By Application
      • By Product Type
    • Key Takeaways
  13. East Asia Market Analysis 2020 to 2024 and Forecast 2025 to 2035, By Country
    • Historical Market Size Value (USD Bn) & Volume (MMT) Trend Analysis By Market Taxonomy, 2020 to 2024
    • Market Size Value (USD Bn) & Volume (MMT) Forecast By Market Taxonomy, 2025 to 2035
      • By Country
        • China
        • Japan
        • South Korea
      • By Thickness
      • By Application
      • By Product Type
    • Market Attractiveness Analysis
      • By Country
      • By Thickness
      • By Application
      • By Product Type
    • Key Takeaways
  14. South Asia Pacific Market Analysis 2020 to 2024 and Forecast 2025 to 2035, By Country
    • Historical Market Size Value (USD Bn) & Volume (MMT) Trend Analysis By Market Taxonomy, 2020 to 2024
    • Market Size Value (USD Bn) & Volume (MMT) Forecast By Market Taxonomy, 2025 to 2035
      • By Country
        • India
        • ASEAN Countries
        • Australia & New Zealand
        • Rest of South Asia Pacific
      • By Thickness
      • By Application
      • By Product Type
    • Market Attractiveness Analysis
      • By Country
      • By Thickness
      • By Application
      • By Product Type
    • Key Takeaways
  15. Eastern Europe Market Analysis 2020 to 2024 and Forecast 2025 to 2035, By Country
    • Historical Market Size Value (USD Bn) & Volume (MMT) Trend Analysis By Market Taxonomy, 2020 to 2024
    • Market Size Value (USD Bn) & Volume (MMT) Forecast By Market Taxonomy, 2025 to 2035
      • By Country
        • Russia
        • Poland
        • Hungary
        • Balkan & Baltics
        • Rest of Eastern Europe
      • By Thickness
      • By Application
      • By Product Type
    • Market Attractiveness Analysis
      • By Country
      • By Thickness
      • By Application
      • By Product Type
    • Key Takeaways
  16. Middle East & Africa Market Analysis 2020 to 2024 and Forecast 2025 to 2035, By Country
    • Historical Market Size Value (USD Bn) & Volume (MMT) Trend Analysis By Market Taxonomy, 2020 to 2024
    • Market Size Value (USD Bn) & Volume (MMT) Forecast By Market Taxonomy, 2025 to 2035
      • By Country
        • KSA
        • Other GCC Countries
        • Turkiye
        • South Africa
        • Rest of MEA
      • By Thickness
      • By Application
      • By Product Type
    • Market Attractiveness Analysis
      • By Country
      • By Thickness
      • By Application
      • By Product Type
    • Key Takeaways
  17. Key Countries Market Analysis
    • China
      • Pricing Analysis
      • Market Share Analysis, 2024
        • By Thickness
        • By Application
        • By Product Type
    • USA
      • Pricing Analysis
      • Market Share Analysis, 2024
        • By Thickness
        • By Application
        • By Product Type
    • India
      • Pricing Analysis
      • Market Share Analysis, 2024
        • By Thickness
        • By Application
        • By Product Type
    • Japan
      • Pricing Analysis
      • Market Share Analysis, 2024
        • By Thickness
        • By Application
        • By Product Type
    • Germany
      • Pricing Analysis
      • Market Share Analysis, 2024
        • By Thickness
        • By Application
        • By Product Type
  18. Market Structure Analysis
    • Competition Dashboard
    • Competition Benchmarking
    • Market Share Analysis of Top Players
      • By Regional
      • By Thickness
      • By Application
      • By Product Type
  19. Competition Analysis
    • Competition Deep Dive
      • JFE Steel
        • Overview
        • Product Portfolio
        • Profitability by Market Segments (Product/Age /Sales Channel/Region)
        • Sales Footprint
        • Strategy Overview
          • Marketing Strategy
          • Product Strategy
          • Channel Strategy
      • Hyundai Steel
        • Overview
        • Product Portfolio
        • Profitability by Market Segments (Product/Age /Sales Channel/Region)
        • Sales Footprint
        • Strategy Overview
          • Marketing Strategy
          • Product Strategy
          • Channel Strategy
      • Nippon Steel Corporation
        • Overview
        • Product Portfolio
        • Profitability by Market Segments (Product/Age /Sales Channel/Region)
        • Sales Footprint
        • Strategy Overview
          • Marketing Strategy
          • Product Strategy
          • Channel Strategy
      • Victor Steel Co.
        • Overview
        • Product Portfolio
        • Profitability by Market Segments (Product/Age /Sales Channel/Region)
        • Sales Footprint
        • Strategy Overview
          • Marketing Strategy
          • Product Strategy
          • Channel Strategy
      • Baosteel Co.,Ltd.
        • Overview
        • Product Portfolio
        • Profitability by Market Segments (Product/Age /Sales Channel/Region)
        • Sales Footprint
        • Strategy Overview
          • Marketing Strategy
          • Product Strategy
          • Channel Strategy
      • Nucor
        • Overview
        • Product Portfolio
        • Profitability by Market Segments (Product/Age /Sales Channel/Region)
        • Sales Footprint
        • Strategy Overview
          • Marketing Strategy
          • Product Strategy
          • Channel Strategy
      • Sumitomo Corporation
        • Overview
        • Product Portfolio
        • Profitability by Market Segments (Product/Age /Sales Channel/Region)
        • Sales Footprint
        • Strategy Overview
          • Marketing Strategy
          • Product Strategy
          • Channel Strategy
      • Primetal Technologies
        • Overview
        • Product Portfolio
        • Profitability by Market Segments (Product/Age /Sales Channel/Region)
        • Sales Footprint
        • Strategy Overview
          • Marketing Strategy
          • Product Strategy
          • Channel Strategy
      • Ansteel Group Corporation
        • Overview
        • Product Portfolio
        • Profitability by Market Segments (Product/Age /Sales Channel/Region)
        • Sales Footprint
        • Strategy Overview
          • Marketing Strategy
          • Product Strategy
          • Channel Strategy
      • Voestalpine Grobblech GmbH
        • Overview
        • Product Portfolio
        • Profitability by Market Segments (Product/Age /Sales Channel/Region)
        • Sales Footprint
        • Strategy Overview
          • Marketing Strategy
          • Product Strategy
          • Channel Strategy
      • DONGKUKCM CO., LTD
        • Overview
        • Product Portfolio
        • Profitability by Market Segments (Product/Age /Sales Channel/Region)
        • Sales Footprint
        • Strategy Overview
          • Marketing Strategy
          • Product Strategy
          • Channel Strategy
      • NLMK
        • Overview
        • Product Portfolio
        • Profitability by Market Segments (Product/Age /Sales Channel/Region)
        • Sales Footprint
        • Strategy Overview
          • Marketing Strategy
          • Product Strategy
          • Channel Strategy
  20. Assumptions & Acronyms Used
  21. Research Methodology

List Of Table

  • Table 1: Global Market Value (USD Bn) Forecast by Region, 2020 to 2035
  • Table 2: Global Market Volume (MMT) Forecast by Region, 2020 to 2035
  • Table 3: Global Market Value (USD Bn) Forecast by Thickness, 2020 to 2035
  • Table 4: Global Market Volume (MMT) Forecast by Thickness, 2020 to 2035
  • Table 5: Global Market Value (USD Bn) Forecast by Application, 2020 to 2035
  • Table 6: Global Market Volume (MMT) Forecast by Application, 2020 to 2035
  • Table 7: Global Market Value (USD Bn) Forecast by Product Type, 2020 to 2035
  • Table 8: Global Market Volume (MMT) Forecast by Product Type, 2020 to 2035
  • Table 9: North America Market Value (USD Bn) Forecast by Country, 2020 to 2035
  • Table 10: North America Market Volume (MMT) Forecast by Country, 2020 to 2035
  • Table 11: North America Market Value (USD Bn) Forecast by Thickness, 2020 to 2035
  • Table 12: North America Market Volume (MMT) Forecast by Thickness, 2020 to 2035
  • Table 13: North America Market Value (USD Bn) Forecast by Application, 2020 to 2035
  • Table 14: North America Market Volume (MMT) Forecast by Application, 2020 to 2035
  • Table 15: North America Market Value (USD Bn) Forecast by Product Type, 2020 to 2035
  • Table 16: North America Market Volume (MMT) Forecast by Product Type, 2020 to 2035
  • Table 17: Latin America Market Value (USD Bn) Forecast by Country, 2020 to 2035
  • Table 18: Latin America Market Volume (MMT) Forecast by Country, 2020 to 2035
  • Table 19: Latin America Market Value (USD Bn) Forecast by Thickness, 2020 to 2035
  • Table 20: Latin America Market Volume (MMT) Forecast by Thickness, 2020 to 2035
  • Table 21: Latin America Market Value (USD Bn) Forecast by Application, 2020 to 2035
  • Table 22: Latin America Market Volume (MMT) Forecast by Application, 2020 to 2035
  • Table 23: Latin America Market Value (USD Bn) Forecast by Product Type, 2020 to 2035
  • Table 24: Latin America Market Volume (MMT) Forecast by Product Type, 2020 to 2035
  • Table 25: Western Europe Market Value (USD Bn) Forecast by Country, 2020 to 2035
  • Table 26: Western Europe Market Volume (MMT) Forecast by Country, 2020 to 2035
  • Table 27: Western Europe Market Value (USD Bn) Forecast by Thickness, 2020 to 2035
  • Table 28: Western Europe Market Volume (MMT) Forecast by Thickness, 2020 to 2035
  • Table 29: Western Europe Market Value (USD Bn) Forecast by Application, 2020 to 2035
  • Table 30: Western Europe Market Volume (MMT) Forecast by Application, 2020 to 2035
  • Table 31: Western Europe Market Value (USD Bn) Forecast by Product Type, 2020 to 2035
  • Table 32: Western Europe Market Volume (MMT) Forecast by Product Type, 2020 to 2035
  • Table 33: East Asia Market Value (USD Bn) Forecast by Country, 2020 to 2035
  • Table 34: East Asia Market Volume (MMT) Forecast by Country, 2020 to 2035
  • Table 35: East Asia Market Value (USD Bn) Forecast by Thickness, 2020 to 2035
  • Table 36: East Asia Market Volume (MMT) Forecast by Thickness, 2020 to 2035
  • Table 37: East Asia Market Value (USD Bn) Forecast by Application, 2020 to 2035
  • Table 38: East Asia Market Volume (MMT) Forecast by Application, 2020 to 2035
  • Table 39: East Asia Market Value (USD Bn) Forecast by Product Type, 2020 to 2035
  • Table 40: East Asia Market Volume (MMT) Forecast by Product Type, 2020 to 2035
  • Table 41: South Asia Pacific Market Value (USD Bn) Forecast by Country, 2020 to 2035
  • Table 42: South Asia Pacific Market Volume (MMT) Forecast by Country, 2020 to 2035
  • Table 43: South Asia Pacific Market Value (USD Bn) Forecast by Thickness, 2020 to 2035
  • Table 44: South Asia Pacific Market Volume (MMT) Forecast by Thickness, 2020 to 2035
  • Table 45: South Asia Pacific Market Value (USD Bn) Forecast by Application, 2020 to 2035
  • Table 46: South Asia Pacific Market Volume (MMT) Forecast by Application, 2020 to 2035
  • Table 47: South Asia Pacific Market Value (USD Bn) Forecast by Product Type, 2020 to 2035
  • Table 48: South Asia Pacific Market Volume (MMT) Forecast by Product Type, 2020 to 2035
  • Table 49: Eastern Europe Market Value (USD Bn) Forecast by Country, 2020 to 2035
  • Table 50: Eastern Europe Market Volume (MMT) Forecast by Country, 2020 to 2035
  • Table 51: Eastern Europe Market Value (USD Bn) Forecast by Thickness, 2020 to 2035
  • Table 52: Eastern Europe Market Volume (MMT) Forecast by Thickness, 2020 to 2035
  • Table 53: Eastern Europe Market Value (USD Bn) Forecast by Application, 2020 to 2035
  • Table 54: Eastern Europe Market Volume (MMT) Forecast by Application, 2020 to 2035
  • Table 55: Eastern Europe Market Value (USD Bn) Forecast by Product Type, 2020 to 2035
  • Table 56: Eastern Europe Market Volume (MMT) Forecast by Product Type, 2020 to 2035
  • Table 57: Middle East & Africa Market Value (USD Bn) Forecast by Country, 2020 to 2035
  • Table 58: Middle East & Africa Market Volume (MMT) Forecast by Country, 2020 to 2035
  • Table 59: Middle East & Africa Market Value (USD Bn) Forecast by Thickness, 2020 to 2035
  • Table 60: Middle East & Africa Market Volume (MMT) Forecast by Thickness, 2020 to 2035
  • Table 61: Middle East & Africa Market Value (USD Bn) Forecast by Application, 2020 to 2035
  • Table 62: Middle East & Africa Market Volume (MMT) Forecast by Application, 2020 to 2035
  • Table 63: Middle East & Africa Market Value (USD Bn) Forecast by Product Type, 2020 to 2035
  • Table 64: Middle East & Africa Market Volume (MMT) Forecast by Product Type, 2020 to 2035

List Of Figures

  • Figure 1: Global Market Volume (MMT) Forecast 2020 to 2035
  • Figure 2: Global Market Pricing Analysis
  • Figure 3: Global Market Value (USD Bn) Forecast 2020 to 2035
  • Figure 4: Global Market Value Share and BPS Analysis by Thickness, 2025 and 2035
  • Figure 5: Global Market Y-o-Y Growth Comparison by Thickness, 2025 to 2035
  • Figure 6: Global Market Attractiveness Analysis by Thickness
  • Figure 7: Global Market Value Share and BPS Analysis by Application, 2025 and 2035
  • Figure 8: Global Market Y-o-Y Growth Comparison by Application, 2025 to 2035
  • Figure 9: Global Market Attractiveness Analysis by Application
  • Figure 10: Global Market Value Share and BPS Analysis by Product Type, 2025 and 2035
  • Figure 11: Global Market Y-o-Y Growth Comparison by Product Type, 2025 to 2035
  • Figure 12: Global Market Attractiveness Analysis by Product Type
  • Figure 13: Global Market Value (USD Bn) Share and BPS Analysis by Region, 2025 and 2035
  • Figure 14: Global Market Y-o-Y Growth Comparison by Region, 2025 to 2035
  • Figure 15: Global Market Attractiveness Analysis by Region
  • Figure 16: North America Market Incremental $ Opportunity, 2025 to 2035
  • Figure 17: Latin America Market Incremental $ Opportunity, 2025 to 2035
  • Figure 18: Western Europe Market Incremental $ Opportunity, 2025 to 2035
  • Figure 19: East Asia Market Incremental $ Opportunity, 2025 to 2035
  • Figure 20: South Asia Pacific Market Incremental $ Opportunity, 2025 to 2035
  • Figure 21: Eastern Europe Market Incremental $ Opportunity, 2025 to 2035
  • Figure 22: Middle East & Africa Market Incremental $ Opportunity, 2025 to 2035
  • Figure 23: North America Market Value Share and BPS Analysis by Country, 2025 and 2035
  • Figure 24: North America Market Value Share and BPS Analysis by Thickness, 2025 and 2035
  • Figure 25: North America Market Y-o-Y Growth Comparison by Thickness, 2025 to 2035
  • Figure 26: North America Market Attractiveness Analysis by Thickness
  • Figure 27: North America Market Value Share and BPS Analysis by Application, 2025 and 2035
  • Figure 28: North America Market Y-o-Y Growth Comparison by Application, 2025 to 2035
  • Figure 29: North America Market Attractiveness Analysis by Application
  • Figure 30: North America Market Value Share and BPS Analysis by Product Type, 2025 and 2035
  • Figure 31: North America Market Y-o-Y Growth Comparison by Product Type, 2025 to 2035
  • Figure 32: North America Market Attractiveness Analysis by Product Type
  • Figure 33: Latin America Market Value Share and BPS Analysis by Country, 2025 and 2035
  • Figure 34: Latin America Market Value Share and BPS Analysis by Thickness, 2025 and 2035
  • Figure 35: Latin America Market Y-o-Y Growth Comparison by Thickness, 2025 to 2035
  • Figure 36: Latin America Market Attractiveness Analysis by Thickness
  • Figure 37: Latin America Market Value Share and BPS Analysis by Application, 2025 and 2035
  • Figure 38: Latin America Market Y-o-Y Growth Comparison by Application, 2025 to 2035
  • Figure 39: Latin America Market Attractiveness Analysis by Application
  • Figure 40: Latin America Market Value Share and BPS Analysis by Product Type, 2025 and 2035
  • Figure 41: Latin America Market Y-o-Y Growth Comparison by Product Type, 2025 to 2035
  • Figure 42: Latin America Market Attractiveness Analysis by Product Type
  • Figure 43: Western Europe Market Value Share and BPS Analysis by Country, 2025 and 2035
  • Figure 44: Western Europe Market Value Share and BPS Analysis by Thickness, 2025 and 2035
  • Figure 45: Western Europe Market Y-o-Y Growth Comparison by Thickness, 2025 to 2035
  • Figure 46: Western Europe Market Attractiveness Analysis by Thickness
  • Figure 47: Western Europe Market Value Share and BPS Analysis by Application, 2025 and 2035
  • Figure 48: Western Europe Market Y-o-Y Growth Comparison by Application, 2025 to 2035
  • Figure 49: Western Europe Market Attractiveness Analysis by Application
  • Figure 50: Western Europe Market Value Share and BPS Analysis by Product Type, 2025 and 2035
  • Figure 51: Western Europe Market Y-o-Y Growth Comparison by Product Type, 2025 to 2035
  • Figure 52: Western Europe Market Attractiveness Analysis by Product Type
  • Figure 53: East Asia Market Value Share and BPS Analysis by Country, 2025 and 2035
  • Figure 54: East Asia Market Value Share and BPS Analysis by Thickness, 2025 and 2035
  • Figure 55: East Asia Market Y-o-Y Growth Comparison by Thickness, 2025 to 2035
  • Figure 56: East Asia Market Attractiveness Analysis by Thickness
  • Figure 57: East Asia Market Value Share and BPS Analysis by Application, 2025 and 2035
  • Figure 58: East Asia Market Y-o-Y Growth Comparison by Application, 2025 to 2035
  • Figure 59: East Asia Market Attractiveness Analysis by Application
  • Figure 60: East Asia Market Value Share and BPS Analysis by Product Type, 2025 and 2035
  • Figure 61: East Asia Market Y-o-Y Growth Comparison by Product Type, 2025 to 2035
  • Figure 62: East Asia Market Attractiveness Analysis by Product Type
  • Figure 63: South Asia Pacific Market Value Share and BPS Analysis by Country, 2025 and 2035
  • Figure 64: South Asia Pacific Market Value Share and BPS Analysis by Thickness, 2025 and 2035
  • Figure 65: South Asia Pacific Market Y-o-Y Growth Comparison by Thickness, 2025 to 2035
  • Figure 66: South Asia Pacific Market Attractiveness Analysis by Thickness
  • Figure 67: South Asia Pacific Market Value Share and BPS Analysis by Application, 2025 and 2035
  • Figure 68: South Asia Pacific Market Y-o-Y Growth Comparison by Application, 2025 to 2035
  • Figure 69: South Asia Pacific Market Attractiveness Analysis by Application
  • Figure 70: South Asia Pacific Market Value Share and BPS Analysis by Product Type, 2025 and 2035
  • Figure 71: South Asia Pacific Market Y-o-Y Growth Comparison by Product Type, 2025 to 2035
  • Figure 72: South Asia Pacific Market Attractiveness Analysis by Product Type
  • Figure 73: Eastern Europe Market Value Share and BPS Analysis by Country, 2025 and 2035
  • Figure 74: Eastern Europe Market Value Share and BPS Analysis by Thickness, 2025 and 2035
  • Figure 75: Eastern Europe Market Y-o-Y Growth Comparison by Thickness, 2025 to 2035
  • Figure 76: Eastern Europe Market Attractiveness Analysis by Thickness
  • Figure 77: Eastern Europe Market Value Share and BPS Analysis by Application, 2025 and 2035
  • Figure 78: Eastern Europe Market Y-o-Y Growth Comparison by Application, 2025 to 2035
  • Figure 79: Eastern Europe Market Attractiveness Analysis by Application
  • Figure 80: Eastern Europe Market Value Share and BPS Analysis by Product Type, 2025 and 2035
  • Figure 81: Eastern Europe Market Y-o-Y Growth Comparison by Product Type, 2025 to 2035
  • Figure 82: Eastern Europe Market Attractiveness Analysis by Product Type
  • Figure 83: Middle East & Africa Market Value Share and BPS Analysis by Country, 2025 and 2035
  • Figure 84: Middle East & Africa Market Value Share and BPS Analysis by Thickness, 2025 and 2035
  • Figure 85: Middle East & Africa Market Y-o-Y Growth Comparison by Thickness, 2025 to 2035
  • Figure 86: Middle East & Africa Market Attractiveness Analysis by Thickness
  • Figure 87: Middle East & Africa Market Value Share and BPS Analysis by Application, 2025 and 2035
  • Figure 88: Middle East & Africa Market Y-o-Y Growth Comparison by Application, 2025 to 2035
  • Figure 89: Middle East & Africa Market Attractiveness Analysis by Application
  • Figure 90: Middle East & Africa Market Value Share and BPS Analysis by Product Type, 2025 and 2035
  • Figure 91: Middle East & Africa Market Y-o-Y Growth Comparison by Product Type, 2025 to 2035
  • Figure 92: Middle East & Africa Market Attractiveness Analysis by Product Type
  • Figure 93: Global Market - Tier Structure Analysis
  • Figure 94: Global Market - Company Share Analysis

- FAQs -

What was the global TMCP steel market size reported by Fact.MR for 2025?

The global TMCP steel market was valued at USD 160.2 billion in 2025.

Who are the major players operating in the TMCP steel market?

Prominent players in the market are Hyundai Steel, Nippon Steel Corporation, Victor Steel Co., Baosteel Co. Ltd., and others.

What is the estimated valuation of the TMCP steel market in 2035?

The market is expected to reach a valuation of USD 286.9 billion in 2035.

What value CAGR did the TMCP steel market exhibit over the last five years?

The historic growth rate of the TMCP steel market was 5.5% from 2020 to 2024.

TMCP Steel Market

Schedule a Call