- Base Value(2025): USD 22.3 Bn
- Estimated Value(2026): USD 26.5 Bn
- Forecast Value (2036): USD 150.9 Bn
- CAGR (2026 - 2036): 19.0%
What is the Traction Inverter Market forecast to be worth by 2036?
USD 26.5 billion in 2026 to USD 150.9 billion by 2036, at 19.0% CAGR.
- The traction inverter market crossed a valuation of USD 22.3 billion in 2025 as electrified platforms moved from limited programs into higher model coverage.
- Demand is projected to increase from USD 26.5 billion in 2026 to USD 150.9 billion by 2036.
- The market is anticipated to record 19.0% CAGR from 2026 to 2036 as automakers shift more powertrain spend toward inverter efficiency and cooling design.
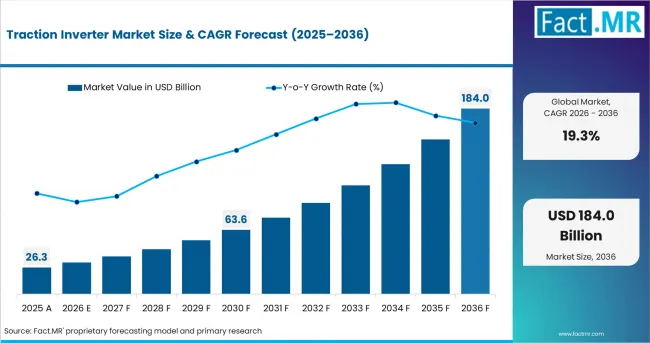
Traction Inverter Market Value Analysis | Source: Fact.MR
What are the defining numbers behind Traction Inverter Market growth?
USD 124.4 billion absolute opportunity by 2036, led by Battery Electric Vehicle, IGBT, Up to 200V and Passenger Cars.
- Demand Drivers in the Market
- Automakers need compact inverter packages because battery-electric vehicle designs leave less room for separate power-control hardware.
- Tier-one system suppliers require stable thermal paths so silicon carbide and IGBT modules keep switching losses under control.
- Fleet operators value durable inverter controls as electrified buses, delivery vans and off-highway vehicles move into heavier duty cycles. The IEA reported in May 2026 that electric truck sales exceeded 400,000 worldwide in 2025 and reached 9% of all truck sales.
- Semiconductor providers are expected to prioritize automotive-qualified devices owing to stricter inverter safety and reliability checks.
- Key Segments Analyzed
- By Propulsion: Battery Electric Vehicle is expected to hold 22.5% share in 2026 due to direct use of traction inverters in all-electric drivetrains.
- By Technology: IGBT is projected to account for 28.7% share in 2026 as silicon-based devices remain qualified in many mass-market platforms.
- By Voltage: Up to 200V is anticipated to capture 38.9% share in 2026 supported by low-voltage urban and light-duty electrified systems.
- By End Use: Passenger Cars is estimated to represent 37.2% share in 2026 because electric car model coverage keeps inverter volumes high.
- Analyst Opinion at Fact.MR
- Shambhu Nath Jha, Senior Consultant at Fact.MR, states, “Traction inverter sourcing is no longer a simple power-rating decision. Vehicle makers are expected to compare switching loss, cooling structure and calibration evidence before approval. Suppliers that combine semiconductor expertise with pack-voltage planning and service reliability are better placed for longer programs.”
- Strategic Implications
- Automakers should align inverter voltage plans with battery pack roadmaps before supplier quotations are locked.
- Semiconductor teams should document device loss, gate-driver behavior and thermal cycling for automotive qualification files.
- Tier-one suppliers should keep inverter, motor and e-axle engineering close enough to shorten validation loops.
- Investors should separate full traction inverter exposure from narrower power-device or rail converter exposure.
The USA is projected to record 19.8% CAGR through 2036 through EV production depth. Japan posts 19.2% as automakers refine inverter efficiency. The UK reaches 17.6% through zero-emission fleet turnover. South Korea advances at 15.2%. France records 12.3%, and Italy reaches 11.9%.
How does the Traction Inverter Market break down by segment?
Battery Electric Vehicle is expected to lead Propulsion at 22.5% share in 2026. Up to 200V is projected to lead Voltage at 38.9% share in 2026.
Which propulsion type dominates?
Battery Electric Vehicle is projected to account for 56.0% share in 2026.
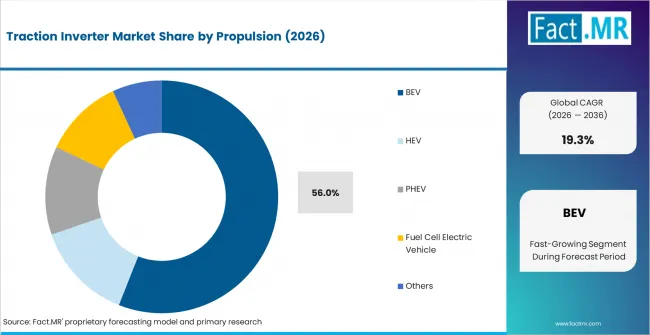
Traction Inverter Market Analysis By Propulsion | Source: Fact.MR
Battery electric vehicles give traction inverters their clearest volume base because each vehicle depends on motor power control. Hybrids need smaller inverter units inside mixed powertrains. Plug-in hybrids add value where battery range and engine assist require torque coordination. The IEA reported in May 2026 that electric car sales exceeded 20 million worldwide in 2025. The IEA also reported in May 2026 that about 5% of the global car stock was electrified in 2025.
What leads the Technology segment?
IGBT is expected to hold 48.0% share in 2026.
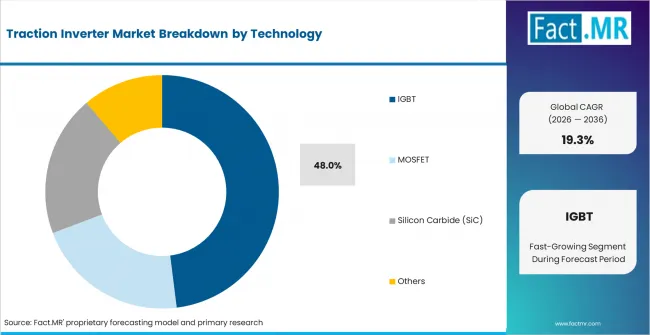
Traction Inverter Market Analysis By Technology | Source: Fact.MR
IGBT technology keeps a material position because many vehicle programs already qualify silicon modules for cost and reliability. MOSFET demand rises where silicon carbide improves switching efficiency. Other power devices remain selective choices. Mitsubishi Electric announced in January 2026 that it would ship trench SiC-MOSFET bare-die samples for EV traction inverters.
How does Voltage shape demand?
Up to 200V is anticipated to lead with 63.0% share in 2026.
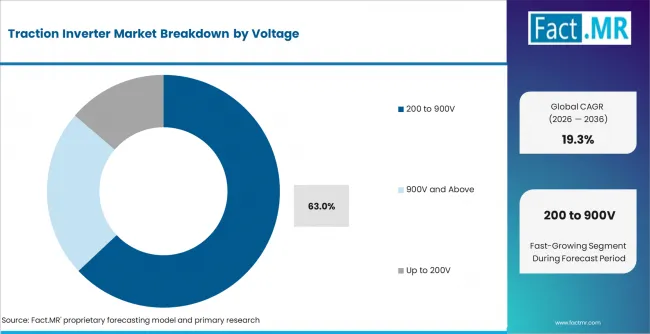
Traction Inverter Market Analysis By Voltage | Source: Fact.MR
Up to 200V systems lead where compact EVs and light-duty platforms need simpler power electronics. The 200 to 900V range gains relevance in higher-output cars. Systems at 900V and above remain selective because insulation and safety add cost. Infineon introduced EiceDRIVER isolated gate-driver ICs in January 2025 for EV traction inverters.
What supports Passenger Cars within End Use?
Passenger Cars are estimated to represent 37.2% share in 2026.
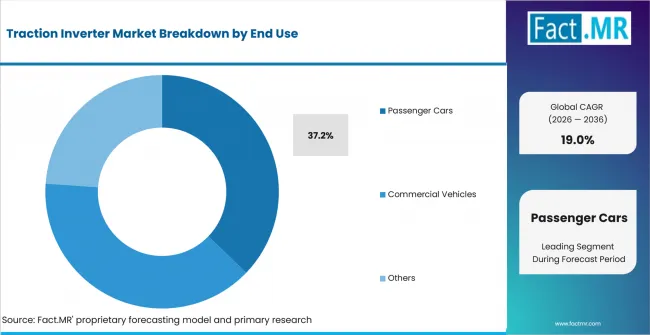
Traction Inverter Market Analysis By End Use | Source: Fact.MR
Passenger cars hold the widest inverter base because electrification reaches sedans, hatchbacks and SUVs. Commercial vehicles use larger inverter ratings where route duty shapes design. Off-highway vehicles require rugged housings and longer service intervals. The IEA reported in May 2026 that large cars and SUVs accounted for nearly 70% of global electric car sales in 2025. Commercial demand also improved as the IEA reported in May 2026 that electric heavy freight truck sales rose from around 84,000 in 2024 to 230,000 in 2025.
What is accelerating Traction Inverter Market adoption, and what is holding it back?
Battery-electric platform scale drives it; thermal design and qualification cost restrain it.
Drivers Impact Analysis
| DRIVER | (~) % IMPACT ON CAGR | GEOGRAPHIC RELEVANCE | IMPACT TIMELINE |
|---|---|---|---|
| Battery-electric vehicle production | +4.2% | USA, Europe, Japan, South Korea | Short term (<= 2 years) |
| Power-device efficiency gains | +3.4% | Japan, South Korea, Europe | Short term (<= 2 years) |
| Compact e-axle packaging | +2.8% | Passenger car platforms | Medium term (2-4 years) |
| Charging and voltage upgrades | +2.1% | USA, UK, France | Medium term (2-4 years) |
| Hybrid program continuity | +1.4% | Japan, Italy, South Korea | Long term (>= 4 years) |
- Battery-electric vehicle production: EV model expansion is expected to raise inverter volumes because every all-electric powertrain needs motor control.
- Power-device efficiency gains: Silicon carbide and improved IGBT modules are expected to reduce losses.
- Compact e-axle packaging: Automakers are anticipated to combine motor, gearbox and inverter functions. Suppliers that validate electrical and cooling behavior together gain an easier route to approval.
- Hybrid program continuity: Hybrid vehicles keep inverter demand visible where full battery-electric adoption moves unevenly. Dual-inverter programs support torque control across engine and motor operation.
Opportunity Impact Analysis
| OPPORTUNITY | (~) % IMPACT ON CAGR | GEOGRAPHIC RELEVANCE | IMPACT TIMELINE |
|---|---|---|---|
| SiC traction inverter modules | +1.8% | Japan, Europe, USA | Short term (<= 2 years) |
| Gate-driver integration | +1.4% | Global EV platforms | Medium term (2-4 years) |
| Heavy-duty traction systems | +1.0% | Europe and industrial fleets | Medium term (2-4 years) |
| Localized inverter assembly | +0.8% | USA and South Korea | Long term (>= 4 years) |
- Heavy-duty traction systems: Rail and specialty traction programs keep a separate route to inverter demand.
- Localized inverter assembly: Local production is expected to reduce supply risk in high-volume programs. Regional engineering support helps automakers solve calibration and thermal issues faster.
Restraints Impact Analysis
| RESTRAINT | (~) % IMPACT ON CAGR | GEOGRAPHIC RELEVANCE | IMPACT TIMELINE |
|---|---|---|---|
| Thermal management burden | -1.7% | High-output EV platforms | Short term (<= 2 years) |
| Long automotive qualification cycles | -1.3% | Global OEM programs | Short term (<= 2 years) |
| Power semiconductor cost | -0.9% | SiC-heavy platforms | Medium term (2-4 years) |
| Charging infrastructure gaps | -0.7% | USA, Italy, rural markets | Long term (>= 4 years) |
- Thermal management burden: Inverter performance depends on heat removal during repeated acceleration and regenerative braking. Poor cooling raises derating risk and extends validation work.
- Long automotive qualification cycles: Vehicle makers require safety, reliability and electromagnetic compatibility proof before platform release. This slows new inverter suppliers even when device performance looks attractive.
- Power semiconductor cost: Silicon carbide remains more expensive than silicon in many designs. Automakers are expected to reserve it for platforms where range or charging benefits justify the cost.
Which countries are scaling Traction Inverter Market fastest?
- The country comparison spans 7.9 percentage points and forms three practical growth bands across the forecast period.
- The USA remains 0.6 percentage point above Japan through EV production and charging investment.
- Japan remains 1.6 percentage points above the UK as hybrid and BEV engineering support inverter programs.
- The UK remains 2.4 percentage points above South Korea through zero-emission vehicle registrations and policy-driven fleet turnover.
- South Korea remains 2.9 percentage points above France as EV registrations and electronics supply support inverter sourcing.
- France remains 0.4 percentage point above Italy through higher electric-car registration share and fleet electrification pressure.
- Italy closes the displayed range through European rules, selective EV uptake and component manufacturing depth.
Comparable CAGRs create different entry conditions because inverter programs depend on vehicle mix and local engineering depth.
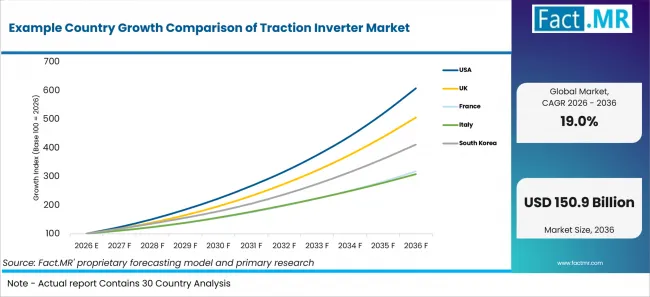
Example Country Growth Comparison Of Traction Inverter Market | Source: Fact.MR
| COUNTRY | CAGR (2026-2036) |
|---|---|
| USA | 19.8% |
| Japan | 19.2% |
| UK | 17.6% |
| South Korea | 15.2% |
| France | 12.3% |
| Italy | 11.9% |
What supports USA adoption?
19.8% CAGR, supported by EV production scale and inverter localization.
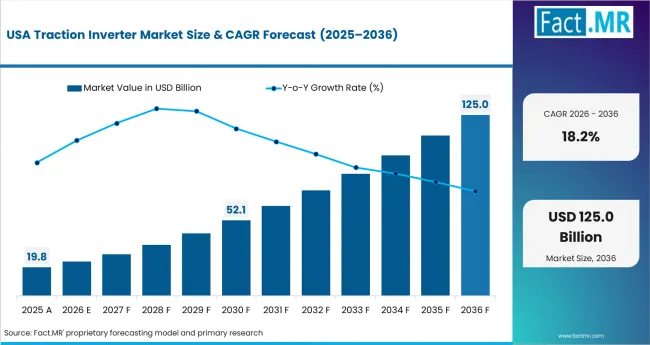
Traction Inverter Market Country Value Analysis | Source: Fact.MR
The USA’s growth reflects rising EV production, domestic vehicle assembly and greater attention to localized power-electronics sourcing. The IEA reported in May 2025 that U.S. electric car sales reached 1.6 million in 2024. Automakers continue to qualify inverter systems near battery and motor programs, while selective credit eligibility, deeper thermal testing and uneven charging access can slow adoption.
How is Japan scaling demand?
19.2% CAGR, backed by hybrid engineering and inverter efficiency work.
Japan’s growth is supported by hybrid engineering, power-device expertise and continued efficiency improvements across EV and hybrid platforms. Japan’s 2035 target calls for 100% electrified new passenger-car sales, keeping inverter design activity active. Local suppliers support SiC and IGBT qualification, while slower BEV uptake, mixed architectures and strict reliability requirements can extend development cycles.
What supports UK growth?
17.6% CAGR, driven by zero-emission registrations and fleet replacement.
The UK’s growth reflects expanding zero-emission registrations and fleet renewal across passenger cars and light commercial vehicles. Vehicle makers continue to align inverter designs with zero-emission rules, while slower overall registrations, charging constraints and financing concerns can limit higher-voltage EV purchases.
How is South Korea developing demand?
15.2% CAGR, supported by EV registrations and electronics supply depth.
South Korea’s growth is supported by rising EV registrations, strong battery and electronics capabilities and export-oriented vehicle platforms. Qualification remains demanding across export markets, while combustion-vehicle dominance and lower EV sales share can restrain near-term replacement demand.
What is driving France’s growth from 2026 to 2036?
12.3% CAGR, supported by electric registrations and fleet electrification.
France’s growth reflects rising electric registrations, stronger fleet electrification and continued pressure to reduce new-car emissions. SDES reported in February 2026 that electric car registrations reached 331,200 in 2025, up from 295,600 in 2024. Fleet programs support inverter demand, while softer private uptake, weaker overall vehicle sales and price sensitivity can limit higher-cost silicon carbide systems.
How does Italy perform?
11.9% CAGR, led by European fleet rules and selective EV uptake.
Italy’s growth is supported by European fleet rules, hybrid adoption and inverter-related validation activity across northern industrial clusters. The IEA reported in May 2026 that European electric car sales reached 4.2 million in 2025, equal to a 28% share. Charging gaps, uneven registrations and small-car cost pressure can still limit higher inverter content.
Who leads the Traction Inverter Market?
BorgWarner, DENSO, Mitsubishi Electric and Infineon show the clearest direct relevance.
BorgWarner has direct inverter exposure through dual-inverter programs. DENSO contributes Toyota platform integration. Mitsubishi Electric and Toshiba Electronic Devices & Storage support power devices. Marelli, Siemens, Hitachi, Voith and Infineon extend the field across vehicle and traction electronics
Which companies are the key providers?
Key companies include BorgWarner Inc., Marelli, Mitsubishi Electric Mobility Corporation, DENSO Corporation, Voith GmbH.
- BorgWarner Inc.
- Marelli
- Mitsubishi Electric Mobility Corporation
- DENSO Corporation
- Voith GmbH
Bibliography
- BorgWarner Inc. (2025, April 29). BorgWarner showcases latest power module technology at the 46th Vienna Motor Symposium.
- BorgWarner Inc. (2025, July 31). BorgWarner secures another dual inverter project with major Chinese OEM.
- DENSO Corporation. (2025, October 10). DENSO’s electrification products adopted for TOYOTA’s new “bZ4X”—Newly developed inverter featuring world-leading power density and new battery management products.
- Department for Transport. (2026, April 29). Vehicle licensing statistics, United Kingdom: 2025.
- International Energy Agency. (2025, May 14). Trends in electric car markets. In Global EV Outlook 2025.
- International Energy Agency. (2026, May 20). Trends in electric cars. In Global EV Outlook 2026.
- Agency for Natural Resources and Energy. (2026, March 10). Report on discussions for the standards subcommittee of the Comprehensive Resources and Energy Survey.
This Report Answers
- The report covers traction inverter choices across Propulsion and Technology.
- Segment analysis covers Battery Electric Vehicle and IGBT as 2026 share leaders.
- Country outlook evaluates the USA, Japan, the UK, South Korea, France and Italy.
- Competitive analysis profiles BorgWarner, DENSO, Mitsubishi Electric, Infineon, Marelli, Siemens, Toshiba, Hitachi and Voith.
- Voltage assessment covers Up to 200V, 200 to 900V and 900V and above systems.
What does the Traction Inverter Market cover?
Traction inverter systems control electrical power between the battery and traction motor. They operate in battery electric, hybrid and plug-in hybrid powertrains.
The Traction Inverter Market covers inverter assemblies, power modules, gate-driver systems and controls tied to traction motor operation. Coverage extends to passenger cars, commercial vehicles and selected off-highway platforms. It includes IGBT, MOSFET and other power-device routes used inside traction inverter designs.
What is included in the scope?
The scope includes propulsion types, technology choices, voltage classes and end uses. It covers BEV, hybrid and plug-in hybrid applications. Coverage includes Up to 200V, 200 to 900V and 900V and above systems. Company coverage includes inverter suppliers and active power-device providers designed for traction inverter use.
Adjacent Fact.MR coverage includes automotive power electronics, 800V inverter modules, automotive semiconductor and e-axle inverter systems tied to inverter sourcing.
What is excluded from the scope?
General industrial inverters that are not used for vehicle or traction motor control remain outside the scope of this market.
The scope excludes solar inverters, stationary grid inverters, consumer motor drives and unrelated power conversion hardware. On-board chargers and DC-DC converters are excluded unless they directly support traction inverter sourcing.
How Was the Analysis Built?
The analysis draws on official registrations, electrification outlooks and supplier review.
| METHOD | DETAILS |
|---|---|
| Primary Research | Interviews with suppliers, automakers, fleets and procurement teams examine sourcing priorities and validation barriers. |
| Desk Research | Desk research covers official statistics, regulation, company announcements, standards and policy. |
| Market Sizing and Forecasting | Market estimates combine historical performance, locked values, segment shares, country CAGRs and adoption barriers. |
| Data Validation and Update Cycle | Findings are validated against public data, launches, registrations, charging trends and commercial adoption. |
What is the report’s scope and coverage?
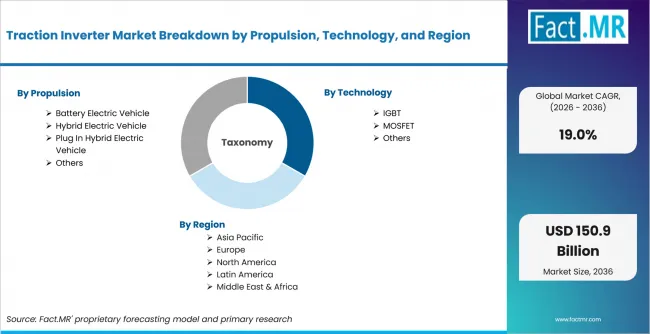
Traction Inverter Market Breakdown By Propulsion, Technology, And Region | Source: Fact.MR
| ATTRIBUTE | DETAILS |
|---|---|
| Quantitative Units | USD 26.5 billion in 2026 to USD 150.9 billion by 2036 at 19.0% CAGR |
| Market Definition | Traction inverters used to convert battery direct current into controlled alternating current for electric traction motors in electrified vehicle and traction platforms |
| Propulsion | Battery Electric Vehicle; Hybrid Electric Vehicle; Plug In Hybrid Electric Vehicle; Others |
| Technology | IGBT; MOSFET; Others |
| Voltage | Up to 200V; 200 to 900V; 900V and above |
| End Use | Passenger Cars; Commercial Vehicles; Others |
| Regions Covered | North America; Latin America; Europe; East Asia; South Asia and Pacific; Middle East and Africa |
| Countries Covered | USA; Japan; UK; South Korea; France; Italy |
| Key Companies Profiled | BorgWarner Inc.; Marelli; Mitsubishi Electric Mobility Corporation; DENSO Corporation; Voith GmbH |
| Forecast Period | 2026 to 2036 |
| Approach | Hybrid top-down and bottom-up approach using EV registrations, inverter programs, semiconductor launches, platform mix, country adoption and company portfolio review |
How is the market segmented?
-
By Propulsion
- Battery Electric Vehicle
- Compact Electric Vehicles
- Mid Size Electric Vehicles
- Premium Electric Vehicles
- Hybrid Electric Vehicle
- Full Hybrid Vehicles
- Mild Hybrid Vehicles
- Power Split Hybrid Vehicles
- Plug In Hybrid Electric Vehicle
- Passenger Plug In Hybrids
- Performance Plug In Hybrids
- Extended Range Hybrids
- Others
- Fuel Cell Electric Vehicles
- Special Purpose Electric Vehicles
- Off Highway Vehicles
-
By Technology
- IGBT
- Silicon Based IGBT
- High Voltage IGBT
- Automotive Grade IGBT
- MOSFET
- Silicon MOSFET
- Silicon Carbide MOSFET
- Automotive MOSFET
- Others
- Gallium Nitride Technology
- Bipolar Power Devices
- Hybrid Semiconductor Systems
-
By Voltage
- Up to 200V
- Low Voltage Systems
- Urban Mobility Platforms
- Light Duty Systems
- 200 to 900V
- Medium Voltage Systems
- High Performance Systems
- Advanced Vehicle Platforms
- 900V and above
- Ultra High Voltage Systems
- Fast Charging Architectures
- Industrial Vehicle Systems
-
By End Use
- Passenger Cars
- Hatchback Vehicles
- Sedan Vehicles
- Sport Utility Vehicles
- Commercial Vehicles
- Light Commercial Vehicles
- Medium Commercial Vehicles
- Heavy Commercial Vehicles
- Others
- Industrial Vehicles
- Off Highway Vehicles
- Special Purpose Vehicles
-
By Region
- North America
- USA
- Europe
- UK
- France
- Italy
- East Asia
- Japan
- South Korea