- Market Value (2025): USD 5334.6 Mn
- Estimated Value (2026): USD 5600.0 Mn
- Forecast Value (2036): USD 9100.0 Mn
- CAGR (2026-2036): 5.0%
What is the Trade Show Displays Market forecast to be worth by 2036?
USD 5,600.0 million in 2026 to USD 9,100.0 million by 2036, at 5.0% CAGR.
- The market stood at USD 5,334.6 million in 2025, reflecting extensive spending on portable kits, fabric systems, modular walls, graphics, digital elements, and managed exhibit assets.
- Revenue is forecast to grow from USD 5,600.0 million in 2026 to USD 9,100.0 million by 2036 as organizations rebuild event calendars and seek display systems that can serve multiple shows.
- The 5.0% CAGR projected for 2026 to 2036 is supported by modular reuse, lighter graphic systems, event-portfolio management, rental flexibility, and continuing demand for face-to-face product presentation.
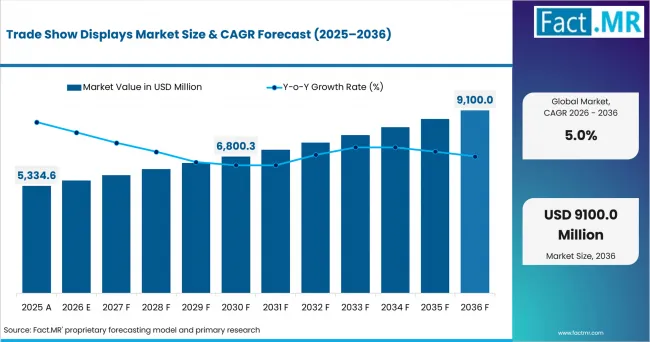
Trade Show Displays Market Value Analysis | Source: Fact.MR
What are the defining numbers behind Trade Show Displays Market growth?
USD 3,500.0 million absolute opportunity by 2036, led by Tension fabric systems and Aluminum extrusion within their respective segments.
- Demand Drivers in the Market
- Exhibitors need a recognizable brand environment that can be rebuilt in different halls and booth footprints.
- Tension fabric and aluminum systems help separate reusable structure from graphics that can be refreshed for a campaign or market.
- Rental and managed-service options allow organizations to participate without storing and transporting every display asset themselves.
- Marketing teams are linking exhibit design more closely to event objectives, attendee interaction, lead capture, and post-show evaluation.
- Key Segments Analyzed
- By Display Format: Tension Fabric Systems are expected to hold 29.0% share in 2026, supported by broad visual coverage, lightweight graphics, simple replacement, and compatibility with reusable frames.
- By Frame System: Aluminum Extrusion is projected to account for 36.0% share in 2026 due to its lightweight structure and ability to support panels, fabric, lighting, shelving, and modular connectors.
- By Graphic Material: Fabric Graphics are anticipated to capture 34.0% share in 2026 owing to their large printable surface, easy transport, simple replacement, and suitability for illuminated display systems.
- By Event Size: Regional Trade Shows are estimated to represent 34.0% share in 2026, driven by frequent event schedules, manageable logistics, and strong participation from small and mid-sized exhibitors.
- By Ownership Model: Owned Display Kits are forecast to account for 42.0% share in 2026 as frequent exhibitors seek consistent branding, predictable availability, and repeated use across established event calendars.
- Analyst Opinion at Fact.MR
- Shambhu Nath Jha, Senior Analyst at Fact.MR, states, "A display earns its value across an event calendar rather than only during the hours it stands on one show floor. Providers that can connect modular design, graphics, logistics, installation, storage, and measurement will influence both the purchase decision and the client's future event plan."
- Strategic Implications
- Exhibitors should choose the ownership model after mapping show frequency, booth-size variation, storage, transport, installation, and graphic-change requirements.
- Display manufacturers can improve lifetime value through frames that accept new layouts, accessories, and graphics without major rework.
- Rental providers need a sufficiently versatile asset pool to give each client a branded result rather than a visibly generic booth.
- Event marketers should specify the commercial objective before selecting digital features, counters, meeting areas, demonstrations, or lead-capture points.
Skyline's modular product range and Nimlok's standardized building-block systems illustrate how suppliers are designing exhibits to be reconfigured and reused across different event needs. That approach shifts competition from a one-time structure toward a combination of adaptable assets and ongoing program services.
United States 5.4% CAGR. Germany 5.9% CAGR.United Kingdom 5.2% CAGR. Japan 4.6% CAGR. South Korea 4.3% CAGR.
How does the Trade Show Displays Market break down by segment?
The leading shares are Aluminum Extrusion at 36.0% by Frame System and Owned Display Kits at 42.0% by Ownership Model.
Why do tension fabric systems lead display-format demand?
Tension Fabric Systems hold 29.0% share in 2026.
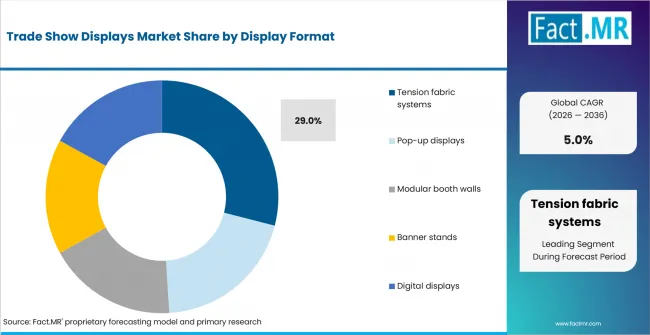
Trade Show Displays Market Analysis By Display Format | Source: Fact.MR
Tension fabric systems provide large visual surfaces without adding excessive weight to the display structure. Their graphics are easy to replace and install across backwalls and illuminated features. Exhibitors can retain the same frame while updating the artwork for new products, campaigns, or events. This balance of visual impact and repeated use keeps tension fabric sytems ahead of pop-up displays, and digital displays.
What keeps aluminum extrusion at the front of the frame-system market?
Aluminum Extrusion accounts for 36.0% share in 2026.
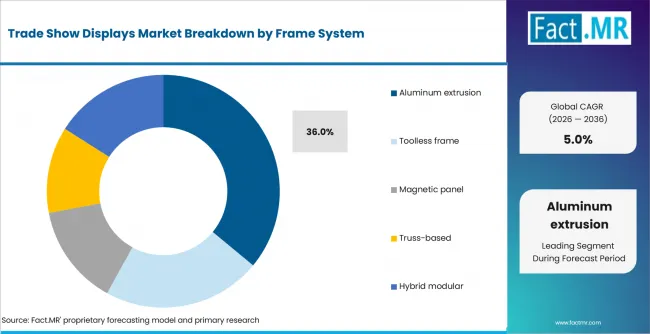
Trade Show Displays Market Analysis By Frame System | Source: Fact.MR
Aluminum extrusion leads and forms the backbone of many reusable modular programs. Toolless frames follow, reducing the equipment and skill needed for smaller installations. Hybrid modular systems, magnetic panels, and truss-based structures address buyers requiring mixed construction, quick surface changes, or greater open-span presence.
Why are fabric graphics the largest material category?
Fabric Graphics represent 34.0% share in 2026.
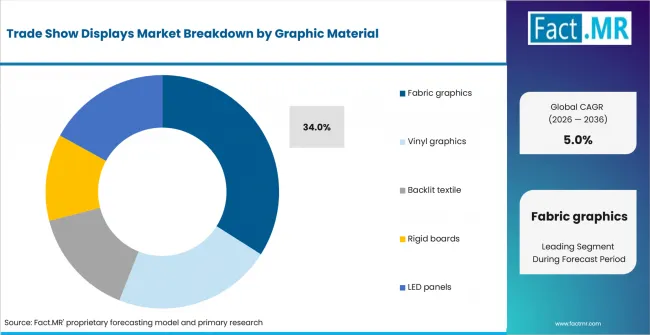
Trade Show Displays Market Analysis By Graphic Material | Source: Fact.MR
Fabric graphics lead demand and align closely with tensioned and modular display systems. Vinyl graphics follow, serving banners, applied surfaces, and economical promotional changes. LED panels, backlit textile, and rigid boards offer dynamic content, illuminated color, or firm planar presentation.
Why do regional trade shows generate the largest display demand?
Regional Trade Shows capture 34.0% share in 2026.
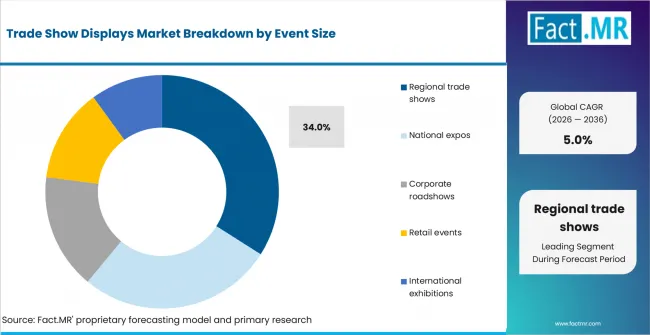
Trade Show Displays Market Analysis By Event Size | Source: Fact.MR
Regional trade shows lead demand and support repeatable inline booths, portable kits, and rental packages. National expos follow, often requiring larger footprints, stronger brand presence, and more service coordination. Corporate roadshows, retail events, and international exhibitions differ sharply in mobility, audience, venue rules, and asset-management needs.
Why do owned display kits remain the leading ownership model?
Owned Display Kits hold 42.0% share in 2026.
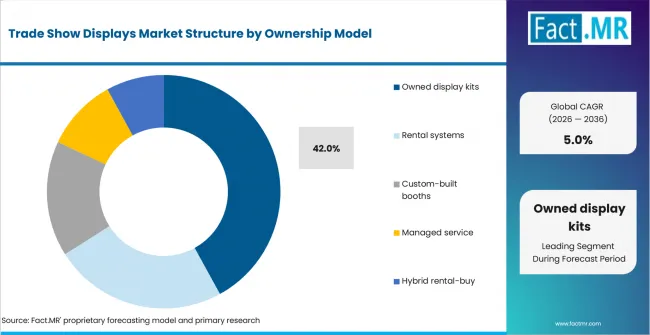
Trade Show Displays Market Analysis By Ownership Model | Source: Fact.MR
Owned display kits lead the market and appeal when reuse, brand control, and predictable availability justify the commitment. Rental systems follow, giving exhibitors flexibility when footprint, location, or event frequency varies. Custom-built booths, managed service, and hybrid rental-buy serve programs seeking greater distinction, outsourced coordination, or selective ownership.
What is accelerating Trade Show Displays Market adoption, and what is holding it back?
The strongest accelerator is the ability to reuse a branded system while changing its footprint, message, and event configuration. Adoption is restrained by total program complexity, since storage, shipping, venue rules, installation, graphics, and asset condition can outweigh the initial display price.
Drivers Impact Analysis
| DRIVER | (~) % IMPACT ON CAGR | GEOGRAPHIC RELEVANCE | IMPACT TIMELINE |
|---|---|---|---|
| Return of event portfolios | +0.7% | Germany, United States, United Kingdom, and France | Short term (<= 2 years) |
| Modular footprint changes | +0.6% | Global | Medium term (2-4 years) |
| Fabric graphic replacement | +0.5% | North America, Europe, and Asia | Short term (<= 2 years) |
| Rental flexibility | +0.4% | International exhibition destinations | Medium term (2-4 years) |
| Event outcome measurement | +0.3% | Mature corporate-marketing markets | Long term (>= 4 years) |
Source: Fact.MR analysis. Updated Jul 22, 2026
- Return of event portfolios: Organizations planning several exhibitions need assets and suppliers that work across a calendar rather than one isolated booking. This favors reusable kits, common components, and centralized program oversight.
- Modular footprint changes: A brand may occupy different spaces at regional, national, and international events. Modular frames let the exhibitor carry recognizable elements forward while adjusting walls, storage, meeting space, and graphics.
- Fabric graphic replacement: Campaigns and product messages change faster than many display structures wear out. Replaceable fabric allows the physical system to remain in service while the visible communication changes.
Opportunity Impact Analysis
| OPPORTUNITY | (~) % IMPACT ON CAGR | GEOGRAPHIC RELEVANCE | IMPACT TIMELINE |
|---|---|---|---|
| Hybrid rental-own programs | +0.4% | Multi-country exhibitors | Medium term (2-4 years) |
| Asset tracking and storage | +0.3% | United States, Germany, and United Kingdom | Short term (<= 2 years) |
| Toolless regional kits | +0.3% | Growing regional event markets | Medium term (2-4 years) |
| Integrated digital layers | +0.2% | National and international exhibitions | Long term (>= 4 years) |
Source: Fact.MR analysis. Updated Jul 22, 2026
- Hybrid rental-own programs: A client can own signature graphics and brand elements while renting frames, furniture, or larger structures locally. This model balances consistency with footprint and geography flexibility.
- Asset tracking and storage: Frequent exhibitors need to know which frames, graphics, cases, and accessories are ready for the next show. Providers can build recurring relationships through inspection, repair, inventory records, and coordinated dispatch.
- Toolless regional kits: Small teams benefit from display kits that can be assembled with limited equipment and packed into manageable cases. Clear instructions and replaceable connectors can make the product more dependable across repeated use.
Restraints Impact Analysis
| RESTRAINT | (~) % IMPACT ON CAGR | GEOGRAPHIC RELEVANCE | IMPACT TIMELINE |
|---|---|---|---|
| Logistics cost volatility | -0.3% | Cross-border event programs | Short term (<= 2 years) |
| Venue and labor complexity | -0.3% | Major convention destinations | Short term (<= 2 years) |
| Irregular event participation | -0.2% | Small and mid-sized enterprises | Medium term (2-4 years) |
| Asset damage and obsolescence | -0.2% | Global | Long term (>= 4 years) |
Source: Fact.MR analysis. Updated Jul 22, 2026
- Logistics cost volatility: Freight, drayage, storage, and last-mile handling can materially affect the economics of a display plan. Bulky or fragile systems are especially exposed when the event schedule spans distant venues.
- Venue and labor complexity: Installation rules, access times, electrical requirements, safety review, and approved labor practices vary by venue. A design that ignores these constraints may cost more to deploy than expected.
- Irregular event participation: Companies with an uncertain show calendar can struggle to justify a large owned system. Portable products and rental options compete for these budgets and reduce full-custom demand.
Where is trade show display spending concentrated?
United States 5.4% CAGR. Germany 5.9% CAGR. United Kingdom 5.2% CAGR. Japan 4.6% CAGR. South Korea 4.3% CAGR.
Regional analysis covers country chapters on United States, Germany, United Kingdom, Japan, and South Korea. Analysis on more than 30 countries is included in the full report.
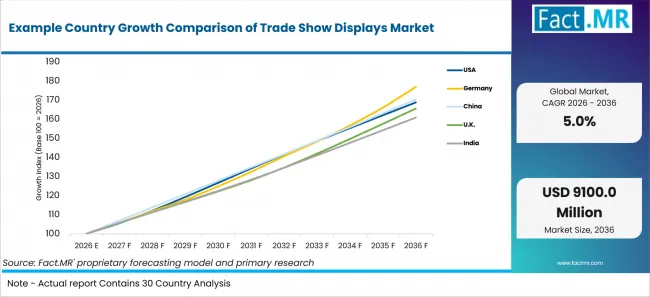
Example Country Growth Comparison Of Trade Show Displays Market | Source: Fact.MR
| COUNTRY | CAGR |
|---|---|
| United States | 5.4% |
| Germany | 5.9% |
| United Kingdom | 5.2% |
| Japan | 4.6% |
| South Korea | 4.3% |
Source: Fact.MR analysis. Updated Jul 22, 2026
What is supporting demand in the United States?
A 5.4% CAGR is projected for United States during 2026-2036.
The United States market benefits from a large exhibition calendar, broad corporate marketing spending, and strong demand for reusable display programs. Frequent exhibitors often prefer modular systems that can move between regional shows, national expos, and corporate events while keeping the same brand identity. Portable structures, replaceable graphics, and managed logistics help companies control the cost of repeated participation. Demand therefore centres on display systems that are easy to transport, quick to assemble, and flexible enough to fit different booth sizes.
How is the Germany market likely to develop?
A 5.9% CAGR is projected for Germany during 2026-2036.
Germany is expected to record the strongest growth among the five countries reviewed, supported by its established exhibition industry and regular schedule of industrial and business events. Exhibitors place strong value on durable frames and professional installation. Modular systems are especially useful where companies attend several events with different floor-space and layout requirements. Local service, storage, and compliance with venue rules also influence display selection.
What is keeping the United Kingdom market active?
A 5.2% CAGR is projected for United Kingdom during 2026-2036.
The United Kingdom market is supported by regular business exhibitions and corporate roadshows. Companies often seek compact display systems that suit limited booth areas, changing event schedules, and shorter setup periods. Rental and hybrid ownership arrangements remain useful for exhibitors that require flexibility without maintaining a large inventory of frames and accessories. Reliable turnaround, graphic replacement, and coordinated venue delivery strengthen demand among repeat event participants.
How is the Japan market likely to develop?
A 4.6% CAGR is projected for Japan during 2026-2036.
Japan’s trade show display market reflects a strong focus on presentation quality, space efficiency, and careful event execution. Exhibitors often require compact systems that deliver a polished brand appearance within tightly planned booth layouts. Lightweight frames, fabric graphics, clean finishing, and dependable installation support suit companies participating in technology, manufacturing, consumer, and professional exhibitions. Demand also favours display formats that are easy to store, maintain, and reuse without reducing visual quality.
How is the South Korea market likely to develop?
A 4.3% CAGR is projected for South Korea during 2026-2036.
South Korea’s export-focused business environment supports continued participation in technology and consumer-product exhibitions. Companies require display systems that accommodate frequent product launches, changing campaign graphics, and short preparation cycles. Modular frames and replaceable visual materials help exhibitors update their message without rebuilding the complete booth. Quick installation and consistent presentation across domestic and international shows remain important purchasing factors.
Who leads the Trade Show Displays Market?
Expo Exhibition Stands, Displays2go, Skyline Exhibits, Nimlok, and Freeman compete across portable products, modular systems, custom builds, rentals, logistics, and managed event delivery.
Expo Exhibition Stands leads the company group, followed by Displays2go and Skyline Exhibits. Their positions span different purchasing modes, from online product selection to designed modular programs and custom exhibition delivery.
Nimlok and Freeman are also active in the space. Competition extends beyond the frame and graphic into design, rental inventory, fabrication, installation, storage, asset management, and the ability to execute consistently across a client's show calendar.
Which companies are the key providers?
The company set includes Expo Exhibition Stands, Displays2go, Skyline Exhibits, Nimlok, and Freeman.
- Expo Exhibition Stands
- Displays2go
- Skyline Exhibits
- Nimlok
- Freeman
Bibliography
- UFI, The Global Association of the Exhibition Industry. (2025, May). Global exhibition industry statistics.
- Freeman. (2025). Unpacking XLNC: The future of commerce for trade shows and conferences.
- Displays2go. (2025, January 27). Plan, prepare, succeed: Your comprehensive trade show planning timeline.
- Skyline Exhibits. (2025, October 14). Skyline Exhibits unveils interactive digital design tool for trade show booths.
This Report Addresses
- The report establishes the 2025 global baseline and forecasts trade show display revenue through 2036.
- It reviews United States, Germany, China, United Kingdom, India, Japan, and South Korea, within coverage that reaches more than 30 countries.
- It assesses Expo Exhibition Stands, Displays2go, Skyline Exhibits, Nimlok, and Freeman.
- It separates tension fabric, pop-up, modular wall, banner, and digital display formats.
- It examines regional shows, national expos, roadshows, retail events, and international exhibitions.
- It validates growth against event portfolios, ownership choices, rental use, graphics, logistics, reuse, and outcome measurement.
What does the Trade Show Displays Market cover?
The study follows the physical display system and directly associated deployment value across owned, rental, custom, and managed exhibit models.
Revenue includes complete portable kits, frame systems, booth walls, integrated counters and hardware, graphics, digital-display elements, covered rental charges, and display-specific managed services. Owned, rented, custom-built, managed, and hybrid programs are modeled separately.
Demand is segmented by display format, frame, graphic material, event size, and ownership. Country estimates reflect exhibition activity, exhibitor mix, local supply, event infrastructure, cross-border logistics, and program-management maturity.
What is included in the scope?
Included products and services must form or directly deploy the branded exhibit environment on the event floor.
Tension fabric systems, pop-ups, modular walls, banner stands, digital displays, aluminum extrusion, toolless frames, magnetic panels, truss systems, and hybrid structures are included. Fabric, vinyl, backlit textile, rigid, and LED graphic surfaces are counted when delivered with or for a covered display.
Purchase, rental, custom fabrication, installation allocation, refurbishment, and managed-display fees enter scope when tied directly to the covered system. Regional, national, international, corporate, and retail-event use is included.
What is excluded from the scope?
The wider cost of attending or producing an event is not treated as display-market revenue.
Venue rental, floor-space charges, sponsorship, travel, accommodation, catering, entertainment, registration, general event staffing, and stand-alone logistics are excluded. Audio-visual equipment without an integrated display role, permanent store fixtures, conventional office signage, and used-display resale are also outside scope.
How Was the Analysis Built?
The analysis draws on 120+ sources, 35+ company portfolios, 25+ countries, and more than 20 industry interviews.
- Primary Research: Primary research includes discussions with manufacturers, service providers, technology developers, distributors, end users, procurement teams, and subject-matter experts. These conversations examine purchasing priorities, product adoption, operational challenges, approval requirements, competitive positioning, and the factors that influence wider market acceptance.
- Desk Research: Desk research covers government statistics, regulatory publications, company filings, trade data, technical studies, industry associations, standards, public policy, and other authoritative sources. Every source used in the analysis is documented in the bibliography.
- Market Sizing and Forecasting: Market estimates combine historical performance, demand indicators, pricing and volume trends, segment shares, company participation, country-level growth, adoption patterns, investment activity, and barriers to market expansion.
- Data Validation and Update Cycle: Findings are validated by comparing primary interviews with public data, company activity, regulatory changes, trade patterns, and industry developments. Regular updates review new product launches, capacity changes, partnerships, approvals, procurement trends, and shifts in commercial adoption.
Segmentation
What is the report's scope and coverage?
| ATTRIBUTE | DETAILS |
|---|---|
| Quantitative Units | USD Million in 2026 to USD Million by 2036 at CAGR |
| Market Definition | The market covers portable, modular, custom, digital, owned, and rental display systems used to create branded physical environments at trade shows, exhibitions, expos, roadshows, and related business events. |
| Display Format | Tension fabric systems; Pop-up displays; Modular booth walls; Banner stands; Digital displays |
| Frame System | Aluminum extrusion; Toolless frame; Magnetic panel; Truss-based; Hybrid modular |
| Graphic Material | Fabric graphics; Vinyl graphics; Backlit textile; Rigid boards; LED panels |
| Event Size | Regional trade shows; National expos; Corporate roadshows; Retail events; International exhibitions |
| Ownership Model | Owned display kits; Rental systems; Custom-built booths; Managed service; Hybrid rental-buy |
| Regions Covered | North America; Europe |
| Countries Covered | United States; Germany; United Kingdom; Japan; South Korea (analysis extends to 30+ countries) |
| Key Companies Profiled | Expo Exhibition Stands; Displays2go; Skyline Exhibits; Nimlok; Freeman |
| Forecast Period | 2026 to 2036 |
| Approach | Demand is evaluated using exhibitor participation, event frequency, booth size, replacement cycles, logistics costs, and spending by corporate marketing teams, exhibit houses, and event-service companies. |
Source: Fact.MR analysis. Updated Jul 22, 2026
How is the market segmented?
-
By Display Format:
- Tension fabric systems
- Pop-up displays
- Modular booth walls
- Banner stands
- Digital displays
-
By Frame System:
- Aluminum extrusion
- Toolless frame
- Magnetic panel
- Truss-based
- Hybrid modular
-
By Graphic Material:
- Fabric graphics
- Vinyl graphics
- Backlit textile
- Rigid boards
- LED panels
-
By Event Size:
- Regional trade shows
- National expos
- Corporate roadshows
- Retail events
- International exhibitions
-
By Ownership Model:
- Owned display kits
- Rental systems
- Custom-built booths
- Managed service
- Hybrid rental-buy
-
By Region:
- North America
- United States
- Latin America
- Brazil
- Europe
- Germany
- Italy
- United Kingdom
- Russia
- East Asia
- China
- Japan
- South Korea
- South Asia
- India
- Middle East and Africa
- Morocco
- Saudi Arabia
- United Arab Emirates
- North America
Frequently Asked Questions
How large is the trade show displays market in 2026?
What value is forecast for 2036?
What CAGR is projected for trade show displays?
Which display format leads?
Which frame system has the largest share?
Which graphic material leads?
Which event size generates the most demand?
Which ownership model is largest?
Who worked on this report


Preview the report firsthand - request a free sample
Free SampleGet the brochure for pricing and purchase details
Download PDF