


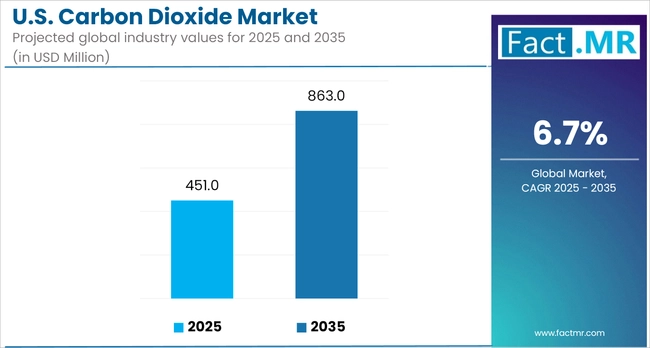
- Base Value(2025): 451.5 Mn
- Forecast Value (2035): 863.6 Mn
- CAGR (2035): 6.7%
U.S. Carbon Dioxide Market Outlook (2025 to 2035)
The U.S. carbon dioxide market is forecast to reach USD 863.6 million by 2035, up from USD 451.5 million in 2025. During the forecast period, the industry is projected to register a CAGR of 6.7%, driven by rising demand across key sectors, including food and beverages, oil and gas, chemicals, and healthcare.
Food-grade CO₂ continues to experience strong demand in carbonation, chilling, and modified atmosphere packaging, as the need for processed and packaged foods increases. In the oil and gas sector, enhanced oil recovery (EOR) remains an application, with increased deployment in states like Texas and New Mexico. Meanwhile, the push toward decarbonization and clean energy transition is prompting investment in carbon capture and utilization (CCU) infrastructure.
What are the Drivers of U.S. Carbon Dioxide Market?
The U.S. carbon dioxide (CO₂) market is experiencing steady growth, driven by rising demand across several industries and supportive policy measures. A significant contributor to this growth is the food and beverage industry, where CO₂ plays a vital role in carbonation, refrigeration, and modified atmosphere packaging. As the consumption of ready-to-eat meals, soft drinks, and packaged foods continues to rise in urban areas, the demand for food-grade CO₂ is also increasing.
In the energy sector, enhanced oil recovery (EOR) is a key application, particularly in regions such as Texas, Wyoming, and New Mexico. CO₂ injection methods are used to extract more oil from aging fields, making it a highly valuable resource. With over 400,000 barrels of crude oil produced daily using CO₂-based EOR, this sector is a significant driver of product demand.
The healthcare industry is further fueling the growth of the U.S. CO₂ market. Medical-grade CO₂ is essential for various surgical procedures, diagnostic testing, and respiratory therapies. With an aging population and a growing number of hospital admissions, the need for CO₂ in clinical settings continues to rise.
Moreover, the focus on carbon capture, utilization, and storage (CCUS) has gained momentum. Federal incentives, including the 45Q tax credit, and increased support for decarbonization efforts are pushing forward the widespread adoption of CO₂ capture technologies at power plants and industrial sites. These advancements are not only helping to reduce emissions but also creating new commercial opportunities for recycled CO₂ in products like construction materials, fuels, and chemicals.
What are the Country Trends of the U.S. Carbon Dioxide Market?
The U.S. carbon dioxide (CO₂) market exhibits distinct regional patterns influenced by factors such as industrial concentration, infrastructure, and shifting sustainability goals. Texas and the Gulf Coast lead the market, driven by their heavy reliance on CO₂ for enhanced oil recovery (EOR) and strong petrochemical industries. The area's well-established pipeline systems and favorable geological conditions for carbon storage further solidify its dominant position.
In the Midwest, in states like Illinois, Ohio, and Indiana, the food and beverage sector plays a central role in CO₂ consumption, with high demand for carbonation, packaging, and cold chain logistics. Meanwhile, the Western U.S., including California and Arizona, is experiencing growth due to its greenhouse agriculture, beverage production, and the development of carbon capture and storage (CCS) projects.
Mountain states such as Wyoming and New Mexico are emerging as key areas for CO₂ capture related to fossil fuel operations, benefiting from federal incentives like the 45Q tax credit. In the Northeast, states like New York and Pennsylvania are seeing an uptick in demand for high-purity CO₂ in the medical and pharmaceutical sectors, along with growing interest in early-stage CCS initiatives.
This regional variation ensures that, while EOR remains a core application, the demand for CO₂ is increasingly driven by diverse sectors, including food, healthcare, and sustainability, across the U.S.
What are the Challenges and Restraining Factors of the U.S. Carbon Dioxide Market?
The U.S. carbon dioxide (CO₂) market is facing several structural and operational challenges that could affect its future growth. One of the key limitations is the vulnerability of CO₂ supply chains, which are often reliant on ethanol and ammonia production and are subject to seasonal variations and unexpected plant shutdowns. For example, during the COVID-19 pandemic and the subsequent shutdowns of fertilizer plants, the U.S. faced CO₂ shortages that disrupted supply to the food and beverage sector.
Environmental regulations also create obstacles. Although carbon capture and storage (CCS) technologies are gaining momentum, the permitting process remains slow and complicated, especially at the state level.
These regulatory delays impede the development of the infrastructure necessary for large-scale CO₂ collection, transportation, and storage systems. Additionally, public opposition to underground storage projects, driven by concerns about groundwater contamination and seismic activity, creates uncertainty for project developers.
Rising energy, labor, and transportation costs are further driving up the operational expenses associated with CO₂ production for liquefaction and distribution. The logistics involved in handling and transporting pressurized CO₂ cylinders and bulk deliveries also add to the costs in remote or underserved areas.
Technological hurdles persist as well in scaling up direct air capture (DAC) and other low-emission CO₂ generation methods, which remain costly and capital-intensive. These challenges make it difficult for smaller companies to adopt newer technologies or compete, slowing down broader market transformation.
Taken together, these issues highlight the need for coordinated policy efforts, increased investment in infrastructure, and continued innovation to address the structural inefficiencies within the U.S. carbon dioxide market.
Category-wise Analysis
Combustion Method Leading Share Among Product Type for U.S. Carbon Dioxide
The combustion-based CO₂ production method remains the dominant approach in the U.S. carbon dioxide market. This method remains the leading approach due to its seamless integration with established industrial processes, particularly in power generation and chemical manufacturing, where capturing CO₂ from flue gases is both effective and cost-efficient.
Its widespread use is further supported by continuous advancements in carbon capture technology and favorable regulatory policies, which help it maintain a competitive advantage over other CO₂ production methods, such as direct air capture or fermentation-based processes.
Trucks/Bulk by Delivery Mode: Continue Accounting for the largest Contributor for U.S. Carbon Dioxide
In the U.S. carbon dioxide market, truck and bulk delivery systems continue to dominate as the primary method of distribution, holding the largest share of the market. This preference is driven by their flexibility, cost-effectiveness, and ability to serve a broad range of industries, including food and beverage, chemicals, and water treatment, in both urban and rural areas.
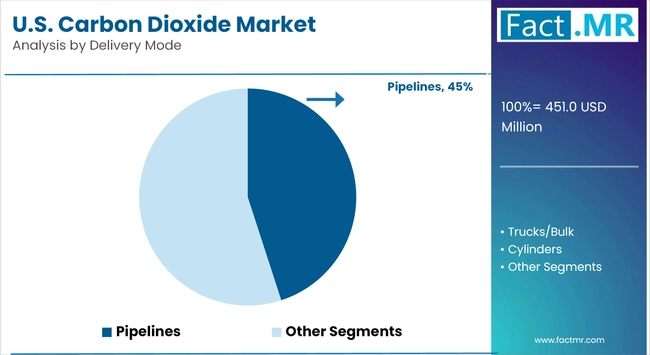
Bulk deliveries using insulated tanks ensure a steady supply for facilities with moderate to high CO₂ demand, eliminating the need for on-site production. Industry data shows that more than 60% of CO₂ deliveries to medium-sized commercial users are made through bulk systems, reinforcing the strong position of this delivery method.
Additionally, advancements in cryogenic storage and transportation technology have enhanced the reliability and safety of truck-based delivery, making it the go-to solution for businesses that need to maintain uninterrupted operations.
Food & Beverages by End-use Industry Continue Accounting for the largest Contributor to U.S. Carbon Dioxide
The food and beverage industry remains the leading end-use sector for carbon dioxide in the U.S. carbon dioxide market. CO₂ plays a critical role in multiple applications across the industry, including carbonating soft drinks, preserving packaged foods, maintaining controlled atmospheres in food storage, and aiding in the quick-freezing process for perishable products. According to the Compressed Gas Association, more than 40% of commercially supplied CO₂ in the U.S. is used by food and beverage companies.
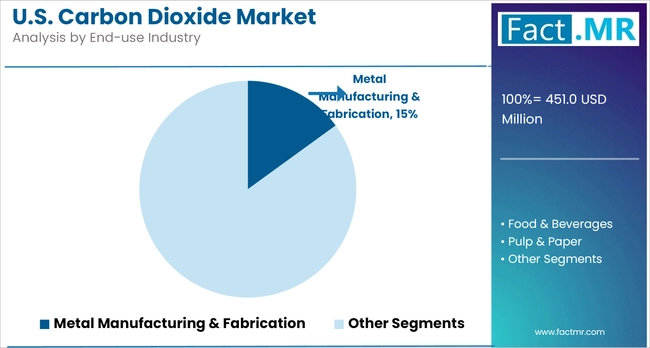
The sector’s continued dominance is driven by consistent consumer demand for carbonated beverages, frozen foods, and packaged products requiring extended shelf life. In addition, the rise in demand for ready-to-eat meals and the expansion of cold chain logistics have further intensified the need for a reliable CO₂ supply. As beverage giants and food processors continue to scale up production, the segment is expected to remain the top contributor to the U.S. carbon dioxide market.
West U.S. continues Accounting for the largest Contributor to U.S. Carbon Dioxide
The Western U.S. remains the dominant region in the carbon dioxide market, largely due to its concentration of key CO₂ consumers, including the food and beverage, oil and gas, and chemical processing industries. States like California, Texas, and Colorado host extensive beverage carbonation plants, enhanced oil recovery operations, and advanced industrial complexes that ensure high CO₂ demand.
The region's infrastructure strength, including well-established distribution networks and storage facilities, further reinforces its leading position. Continued expansion in sectors such as cold-chain logistics and enhanced oil recovery is expected to support sustained CO₂ consumption in the West.
Competitive Analysis
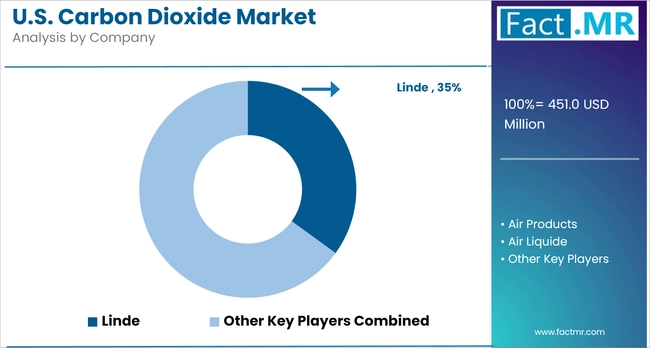
Key players in the U.S. carbon dioxide industry include Air Products and Chemicals, Inc., Praxair, Inc., Matheson Tri-Gas, Inc., and Linde Plc, each holding influence across multiple sectors such as industrial manufacturing, food processing, and healthcare. These companies operate extensive production, distribution, and storage networks that support a reliable CO₂ supply across the country.
Airgas, Inc. and Indiana Oxygen serve as critical suppliers for regional and specialty U.S. carbon dioxide markets, for medical-grade and food-grade carbon dioxide. Their tailored offerings help meet stringent purity standards required by hospitals, laboratories, and beverage manufacturers.
Meanwhile, companies like Sutton-Garten Co., Linden Cylinders & Welding Supply Inc., and Medical-Technical Gases, Inc. focus on niche applications, including welding, anesthesia delivery, and research use. These firms provide custom gas solutions and localized support, enhancing service reliability in industrial zones and academic institutions.
With increasing demand from end-use sectors like beverages, enhanced oil recovery, and cold-chain logistics, these manufacturers are investing in production efficiency, CO₂ recovery technologies, and low-emission infrastructure to maintain competitiveness in a highly regulated environment.
Recent Development
- In June 2025, Linde announced plans for a second liquefied carbon dioxide production facility in Freeport, Texas, set to be operational by 2027. The plant will capture CO₂ from a nearby ethylene glycol facility and meet rising regional demand for food, beverage carbonation, and dry ice. It supports environmental goals by reusing industrial CO₂ instead of releasing it into the atmosphere.
- In November 2024, the North Dakota Public Service Commission approved a key section of a multi-state CO₂ pipeline by Summit Carbon Solutions. The project will transport captured CO₂ from ethanol plants across five Midwestern states to storage sites, marking a significant step forward in scalable carbon capture infrastructure.
Segmentation of the U.S. Carbon Dioxide Market
-
By Production Method :
- Combustion
- Biological
-
By Delivery Mode :
- Centralized
- Pipelines
- Trucks/Bulk
- Cylinders
- Onsite
- Centralized
-
By End-use Industry :
- Metal Manufacturing & Fabrication
- Food & Beverages
- Pulp & Paper
- Oil & Gas
- Healthcare
- Chemicals
- Other Industrial Uses
-
By Region :
- West U.S.
- Southwest U.S.
- Midwest U.S.
- North-East U.S.
- South-East U.S.
- Frequently Asked Questions -
What is the U.S. Carbon Dioxide Market Size in 2025?
The U.S. carbon dioxide market is valued at USD 451.5 million in 2025.
Who are the Major Players Operating in the U.S. Carbon Dioxide Market?
Prominent players in the U.S. carbon dioxide market include Praxiar, Inc., Matheson Tri-Gas, Inc., Sutton-Garten Co., Hibrett Puratex, Linden Cylinders & Welding Supply Inc., Indiana Oxygen, and others.
What is the Estimated Valuation of the U.S. Carbon Dioxide Market by 2035?
The U.S. carbon dioxide market is expected to reach a valuation of USD 863.6 million by 2035.
What Value CAGR Did the U.S. Carbon Dioxide Market Exhibit over the Last Five Years?
The historic growth rate of the U.S. carbon dioxide market was 4.7% from 2020 to 2024.