U.S. Vacuum Pumps Market

U.S. Vacuum Pumps Market Analysis, By Pump Type, By Mechanism, By Pressure, By Lubrication, By Flow, By Application, By End-Use Vertical, and Region - Market Insights 2025 to 2035

The Centrifugal Pumps segment is projected to grow at a CAGR of 7.2%, whereas another segment Momentum Transfer is likely to grow at 7.1%. In terms of regions West U.S. is projected to grow at 7.6%, followed by Southwest U.S. at 7.3% and Midwest U.S. to grow at 6.4%.

U.S. Vacuum Pumps Market Outlook (2025 to 2035)

The U.S. vacuum pumps market is expected to reach USD 4,139 million by 2035, up from USD 2,036 million in 2024. During the forecast period 2025 to 2035, the industry is projected to grow at a CAGR of 6.7%.

Driven by surging demand in semiconductor fabrication and lithium-ion battery production, the U.S. vacuum pumps market thrives on the precision manufacturing needs, electrification trends, and biotech innovations that require ultra-clean, digitally monitored vacuum environments.

Metric Value
Estimated Size in 2025 USD 2,164 Million
Projected Size in 2035 USD 4,139 million
CAGR (2025 to 2035) 6.7%

What are the drivers of the vacuum pumps market in U.S.?

The U.S. vacuum pump market is gaining momentum due to the active development of industrial production in areas of high precision and the growth of industries that utilize vacuum performance. The semiconductor industry also represents one of the key drivers of growth, with vacuum systems playing a critical role in etching, deposition and lithography applications. Capital developments of chip production plants on a large scale are resulting in prolonged purchases of turbomolecular and dry vacuum pumps, which serve ultra-clean and high-vacuum conditions.

The subject of electrification is also driving the market dynamics. Lithium-ion battery factories are increasing, especially in electric vehicles and grid storage, which is generating a powerful pull in vacuum-based degassing, electrolyte filling, and electrode drying technology. The applications require the containment of a vacuum that should be uniform to maintain the integrity of materials and allow efficient energy use.

Another high-impact opportunity is the biopharmaceutical and life sciences industry. More advanced treatments, such as cell-based and gene-based therapies and mRNA platforms, require sterile and particle-free conditions. Vacuum pumps are used in various processes, including lyophilization, vacuum filtration, and sterile packaging; hence, they have become a must-have equipment in both research and production phases.

Moreover, the demand for vacuum systems integrated with digital technologies is aggravated by the implementation of smart manufacturing technologies. Real-time sensors installed in pumps to diagnose in progress, track energy usage, and perform predictive maintenance are becoming a popular choice, with manufacturers wanting greater operational visibility and lower unplanned downtimes.

What are the regional trends of the vacuum pumps market in U.S.?

The U.S. market for vacuum pumps is characterized by high regional differentiation due to regional sector specialization and investment trends. The demand in the West is technology-driven, with semiconductor R&D labs in California, EV battery startups, and clean manufacturing establishments spearheading it. High-vacuum systems used in plasma processing, thin-film deposition and in analytical instrumentation are particularly preferred in this region and is increasingly being used in pilot-scale manufacturing. Southwest, especially Arizona and Texas, will be transformed into a semiconductor manufacturing hub.

The Midwest employs most people with an interest in industrial-scale vacuum pumps, as it is rich in heavy industry, food processing, and metalworking. Rotary vane and liquid ring pumps are the most prevailing, but improvements in low-maintenance and energy-efficient systems are gaining popularity. The Northeast has a concentrated demand for vacuum pumps in the life sciences and biopharmaceutical markets. Both Massachusetts and New Jersey have large biotech clusters that engage oil-free vacuum systems in lyophilization, sterile processing, and laboratory use activities that are highly regulated.

The Southeast is also emerging as a high-growth area, driven by the development of the automotive, aerospace, and chemical industries. States such as Georgia and the Carolinas are considering vacuum technologies in molding, composites, and surface treatments, whereas pump systems are moving toward digitally integrated applications regarding advanced manufacturing systems.

What are the challenges and restraining factors of the vacuum pumps market in U.S.?

The vacuum pumps market in the U.S. faces several underlying complexities that restrain seamless growth. A major constraint lies in the technical mismatch between advanced vacuum systems and existing legacy infrastructure. Most industries prefer to use old automation modules, and therefore, it is hard to introduce newer, digital-ready pumps that depend upon built-in control units and downtime tracking.

The next important issue is adherence to the changing regulatory frameworks, particularly in comparison to industries such as biopharma, food processing, and aerospace. Pumps have high standards associated with hygienic quality, noise emissions, leakage tightness, and energy usage. Such requirements lengthen product approval cycles and necessitate significant engineering adaptation, which drives late market adaptation.

The additional pressure is caused by supply chain rigidity. The ecosystem of the vacuum pump industry depends on highly precise target components (vacuum) seals, rotors, and intelligent sensors, which are usually imported. Backlogs in the global supply chain or geopolitical dislocation interrupt the availability and drive up longer lead times, both in the OEM and aftermarket channels.

There is also a lack of domain-specific skills being encountered in the industry. An advanced vacuum system needs not only mechanical expertise but also a great understanding of fluid dynamics, materials science, and application engineering. A shortage of qualified personnel limits customization and the quality of field services, as well as innovation cycles.

Region-Wise Insights

Regions CAGR (2025 to 2035)
West 7.6%
Southwest 7.3%
Midwest 6.4%

Semiconductors and Sustainability Drive Vacuum Pump Growth in West

The vacuum pump market in the West is experiencing strong growth, driven by advanced semiconductor manufacturing and increasing sustainability standards. High-performance dry and turbomolecular pumps are in high demand as they are essential in chip production, plasma etching, and deposition processes. Industry giants are increasing their investments in smart vacuum systems with real-time tracking capabilities, achieving a higher uptime and process accuracy.

Sustainability targets also influence procurement, as end-users are moving towards energy-efficient, oil-free technologies in response to increasingly stringent emissions legislation. The market is further favored by the fact that more vacuum solutions are being used in the manufacturing of lithium batteries and photovoltaic cells. Strong private sector R&D investment is fueling innovations in corrosion-resistant and ultra-clean vacuum systems, while OEMs are expanding service-based models to improve lifecycle performance and operational efficiency.

Energy Sector and Chemical Processing Propel Southwest Market

The Southwest has been experiencing increased demand for vacuum pumps, with much of it being driven by the oil and gas as well as chemical processing industries. Rotary vane and liquid ring pumps continue to be common in the areas of vacuum distillation, vapor recovery, and solvent reclamation. The growth in the mid-stream infrastructure and petrochemical refinery has augmented the demand for strong, high-capacity vacuum units that are to be applied to corrosive and flammable gases.

The response of manufacturers is focusing on modular, explosion-proof systems, customized to regional compliance with safety and environmental regulations. Such applications of vacuum technologies as polymer and specialty chemical manufacturing are attracting attention since the moisture-sensitive nature of their processes requires high vacuum quality.

The price-conscious customers are opting for either a hybrid or low-maintenance pump variant, which gives efficiency in operations without compromising on the throughput amount. The emergence of digital service platforms is also driving aftermarket growth as users seek predictive maintenance and remote diagnostics.

EV Manufacturing and Food Processing Boost Midwest Vacuum Demand

The Midwest vacuum pump market is growing at a steady pace, driven by increasing demand in EV battery manufacturing, food processing, and pharmaceuticals. To achieve compliance with cleanrooms and high process reliability, dry screw and scroll pump are being used in electrode coating, electrolyte filling and cell assembly. As new EV manufacturing lines enter into use, precision and scale via vacuum system integration are emerging as equalizers.

Simultaneously, the trend on the food and pharma side towards vacuum sealing and freeze-drying (including sterile packaging) is driving the requirement for small size, low-noise, and high-moisture tolerance applications. Purchasers are increasingly opting for long-life, low-energy vacuum systems to achieve cost efficiency and sustainability goals. Increasing modernization, supported by the government and facility upgrades, is facilitating quicker tech adoption. OEMs are also building up local inventory and service centers to sustain the growing demand for equipment.

Category-Wise Analysis

Centrifugal Pump Adoption Accelerates in Low to Medium Vacuum Processes

Centrifugal pumps are witnessing increased deployment in the U.S. vacuum pump market, particularly for applications that operate within low to medium vacuum ranges and require high flow rates. These pumps can provide velocity to gases by use of kinetic energy, which is why they are appropriate in any work requiring continuous and large-volume gas-handling challenges like HVAC industries, power generation, and wastewater treatment. As industries become more energy efficient and focus on their lifecycle costs, there is a resurgence in the use of centrifugal pumps, which are simple to build, require minimal maintenance, and have scalable performance.

Infrastructure modernization, upgrade of municipal utilities, and retrofitting of industrial corners are a boon in the U.S. and are driving the demand for these pumps. Their usage has also been subjected to the push to decarbonize with their adoption of renewable energy systems, such as biogas recovery and handling of hydrogen. Although centrifugal pumps are not ideally proposed to use in ultra-high vacuum, they can be suited as a strategic solution in processes that are critical in throughput and reliability.

Wet-Lubricated Pumps Maintain Relevance in Heavy-Duty Industrial Applications

Us Vacuum Pumps Market Analysis By Lubrication

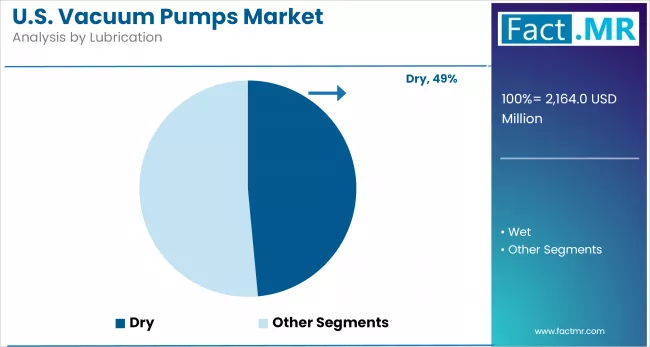
Wet-lubricated vacuum pumps continue to play a vital role in U.S. industries that demand high sealing efficiency and heat dissipation, especially in processes involving harsh gases or particulates. These systems are based on oil or liquid sealants to lubricate the moving parts of the system and manage thermal loads, thereby increasing performance in intense industrial zones such as petrochemical processing, metallurgy, and pharmaceuticals. Although dry pumps are gaining interest in clean applications, wet-lubricated systems are still favored where rugged operating conditions and deep vacuum levels are required.

The chemical and manufacturing industries in the U.S. continue to use pumps based purely on their strength and the reduced initial investment cost, combined with the ability to handle corrosive gases or even any condensable gas that is poisonous to human life.

New developments in oil filtration, automatic fluid recycling and vapor minimization are alleviating the environmental image of wet-lubricated systems. With the industry competing between performance and regulatory requirements, wet pumps will continue to take market share in those rigorous applications where vacuum strength and thermal control are of paramount concern.

Kinetic Pumps Gain Momentum in High-Speed Manufacturing

Kinetic-based vacuum pumps are experiencing an upward trend in advanced manufacturing industries in the U.S., particularly in processes that require rapid movement of gases at high flow rates. Such pumps accept momentum from the rapid mechanical parts and transfer it to gas matter, making them well-suited for applications such as semiconductor manufacture, thin-film, and vacuum metallurgy. The kinetic approach offers the following benefits: an oil-free environment, low backstreaming, and compatibility with cleanrooms.

Due to the increased use of automation and precision equipment in industries, kinetic pumps are becoming part of system design, especially turbo-molecular type pumps. The increased need for space-grade electronics and biotechnology to have compact, high-performance vacuum systems is also extending to augment their importance.

Performance is being set by new innovations in rotor balancing, magnetic levitation and digital controls. With the U.S. expanding domestic semiconductor and aerospace capabilities, kinetic vacuum mechanisms are positioned for long-term growth in high-purity, high-speed manufacturing.

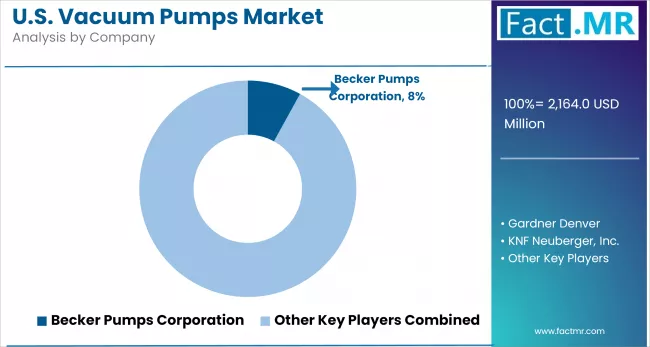
Competitive Analysis

Key players in the U.S. vacuum pumps industry include Becker Pumps Corporation, Gardner Denver, KNF Neuberger, Inc., Tuthill Corporation, Vooner FloGard Corporation, Wintek Corporation, Lyco Wausau, Inc., DEKKER Vacuum Technologies, Busch Vacuum Solutions, and Ingersoll Rand Inc.

Us Vacuum Pumps Market Analysis By Company

The market is growing due to rising demand for energy-efficient, oil-free, and application-specific vacuum systems in industries such as chemical processing, power generation, and pharmaceuticals. Competition is being pushed by the growing emphasis on reliability in processes, lower costs and longer life of equipments.

Technological innovations, including dry-running systems, smart pump monitoring, and modular design, are transforming the industry. The companies are focusing on sustainability through low emissions, oil-free products, and the improvement of service models to minimize downtime, lifecycle performance, and operational efficiency in end-use industries.

Recent Development

  • In November 2024, ULVAC introduced the Gv135 oil rotary vacuum pump, designed for analytical environments that require minimal noise and contamination. Its ultra-quiet design (46 dB) and non-contact magnetic coupling eliminate oil leaks, while dual-block valves prevent backflow, enhancing equipment protection and reducing maintenance in laboratory and office settings.
  • In February 2024, JB Industries introduced the Platinum PRO series, a line of American-made vacuum pumps specifically designed for HVAC professionals. Featuring a robust ½ HP motor and innovative 2-stage direct drive design, the pumps ensure faster evacuation, improved durability, and quieter operation, advancing performance standards in HVAC servicing and maintenance.

Fact.MR has provided detailed information about the price points of key manufacturers in the U.S. Vacuum Pumps Market, positioned across regions, including sales growth, production capacity, and speculative technological expansion, as recently published in the report.

Methodology and Industry Tracking Approach

Fact.MR’s 2025 U.S. vacuum pumps market report is built on comprehensive research involving over 9,800 respondents across 27 countries, with at least 300 participants representing each national market. Sixty-two percent of respondents were end users or equipment manufacturers, including companies in the pharmaceuticals, semiconductor, and industrial production sectors. The remaining 38% consisted of industry professionals, including procurement managers, engineers, and logistics experts.

The data collection period spanned from June 2024 to May 2025, focusing on identifying growth drivers, investment patterns, technological needs, and supply chain challenges. To ensure representative results, responses were weighted based on regional economic contributions and market composition.

More than 250 information sources were analyzed, including patent filings, technical journals, financial statements, and compliance records. Advanced methods such as statistical modeling and comparative assessment supported the analysis. Since 2018, Fact.MR has continuously monitored industry developments, providing valuable insights into product trends, end-use behavior, and market opportunities.

Segmentation of U.S. Vacuum Pumps Market

  • By Pump Type :

    • Positive Displacement
      • Liquid Ring
      • Rotary Screw Pumps
      • Rotary Root Pumps
    • Dry
      • Dry Screw
      • Dry Scroll
      • Dry Diaphragm Pump
      • Dry Clan & Hook Pump
      • Others
    • Centrifugal Pumps
    • Momentum Transfer
      • Rotary Vane
      • Turbo Molecular
    • Regenerative
  • By Mechanism :

    • Gas Transfer
      • Gas Displacement
      • Kinetic
    • Gas Binding
  • By Pressure :

    • Rough Vacuum (from 10.3 mbar-1 mbar)
    • Mediums (1 mbar - 10-3 mbar)
    • High Vacuum (10-3 mbar to 10-7 mbar)
    • Ultra-high Vacuum (10-7 mbar to 10-12 mbar)
    • Extreme High Vacuum (less than 10-12 mbar)
  • By Lubrication :

    • Dry
    • Wet
  • By Flow :

    • Up to 85 ACFM
    • Up to 150 ACFM
    • Up to 550 ACFM
    • Up to 1,500 ACFM
    • Up to 4,500 ACFM
    • Up to 8,500 ACFM
    • Up to 15,000 ACFM
    • Up to 17,000 ACFM
  • By Application :

    • Assembly
    • Conveying
    • Dehydration/Drying
    • Engine Testing
    • Evaporation & Distillation
    • Filling
    • Holding/Chucking
    • Manufacturing
    • Material Handling
    • Thermoforming
    • Others
  • By End-Use Vertical :

    • Aerospace & Defense
    • Automotive
    • Chemical & Petrochemical
    • Electronics & Semiconductor
    • Food & Beverage
    • Healthcare & Pharmaceuticals
    • Industrial Manufacturing
    • Mining & Construction
    • Oil & Gas
    • Packaging
    • Power Generation
    • Semiconductor and Electronics
    • Others
  • By Region :

    • West U.S.
    • Southwest U.S.
    • Midwest U.S.
    • Northeast U.S.
    • Southeast U.S.

Table of Content

  1. Executive Summary
    • U.S. Market Outlook
    • Demand-side Trends
    • Supply-side Trends
    • Technology Roadmap Analysis
    • Analysis and Recommendations
  2. Market Overview
    • Market Coverage / Taxonomy
    • Market Definition / Scope / Limitations
  3. Market Background
    • Market Dynamics
      • Drivers
      • Restraints
      • Opportunity
      • Trends
    • Scenario Forecast
      • Demand in Optimistic Scenario
      • Demand in Likely Scenario
      • Demand in Conservative Scenario
    • Opportunity Map Analysis
    • Product Life Cycle Analysis
    • Supply Chain Analysis
      • Supply Side Participants and their Roles
        • Producers
        • Mid-Level Participants (Traders/ Agents/ Brokers)
        • Wholesalers and Distributors
      • Value Added and Value Created at Node in the Supply Chain
      • List of Raw Material Suppliers
      • List of Existing and Potential Buyers
    • Investment Feasibility Matrix
    • Value Chain Analysis
      • Profit Margin Analysis
      • Wholesalers and Distributors
    • PESTLE and Porter’s Analysis
    • Regulatory Landscape
      • By Key Regions
      • By Key Countries
    • Production and Consumption Statistics
    • Import and Export Statistics
  4. Market Analysis 2020 to 2024 and Forecast, 2025 to 2035
    • Historical Market Size Value (USD Mn) & Volume (Units) Analysis, 2020 to 2024
    • Current and Future Market Size Value (USD Mn) & Volume (Units) Projections, 2025 to 2035
      • Y-o-Y Growth Trend Analysis
      • Absolute $ Opportunity Analysis
  5. Market Pricing Analysis 2020 to 2024 and Forecast 2025 to 2035
  6. Market Analysis 2020 to 2024 and Forecast 2025 to 2035, By Pump Type
    • Introduction / Key Findings
    • Historical Market Size Value (USD Mn) & Volume (Units) Analysis By Pump Type, 2020 to 2024
    • Current and Future Market Size Value (USD Mn) & Volume (Units) Analysis and Forecast By Pump Type, 2025 to 2035
      • Positive Displacement
        • Liquid Ring
        • Rotary Screw Pumps
        • Rotary Root Pumps
      • Dry
        • Dry Screw
        • Dry Scroll
        • Dry Diaphragm Pump
        • Dry Clan & Hook Pump
        • Others
      • Centrifugal Pumps
      • Momentum Transfer
        • Rotary Vane
        • Turbo Molecular
      • Regenerative
    • Y-o-Y Growth Trend Analysis By Pump Type, 2020 to 2024
    • Absolute $ Opportunity Analysis By Pump Type, 2025 to 2035
  7. Market Analysis 2020 to 2024 and Forecast 2025 to 2035, By Mechanism
    • Introduction / Key Findings
    • Historical Market Size Value (USD Mn) & Volume (Units) Analysis By Mechanism, 2020 to 2024
    • Current and Future Market Size Value (USD Mn) & Volume (Units) Analysis and Forecast By Mechanism, 2025 to 2035
      • Gas Transfer
        • Gas Displacement
        • Kinetic
      • Gas Binding
    • Y-o-Y Growth Trend Analysis By Mechanism, 2020 to 2024
    • Absolute $ Opportunity Analysis By Mechanism, 2025 to 2035
  8. Market Analysis 2020 to 2024 and Forecast 2025 to 2035, By Pressure
    • Introduction / Key Findings
    • Historical Market Size Value (USD Mn) & Volume (Units) Analysis By Pressure, 2020 to 2024
    • Current and Future Market Size Value (USD Mn) & Volume (Units) Analysis and Forecast By Pressure, 2025 to 2035
      • Rough Vacuum (from 10.3 mbar-1 mbar)
      • Mediums (1 mbar - 10-3 mbar)
      • High Vacuum (10-3 mbar to 10-7 mbar)
      • Ultra-high Vacuum (10-7 mbar to 10-12 mbar)
      • Extreme High Vacuum (less than 10-12 mbar)
    • Y-o-Y Growth Trend Analysis By Pressure, 2020 to 2024
    • Absolute $ Opportunity Analysis By Pressure, 2025 to 2035
  9. Market Analysis 2020 to 2024 and Forecast 2025 to 2035, By Lubrication
    • Introduction / Key Findings
    • Historical Market Size Value (USD Mn) & Volume (Units) Analysis By Lubrication, 2020 to 2024
    • Current and Future Market Size Value (USD Mn) & Volume (Units) Analysis and Forecast By Lubrication, 2025 to 2035
      • Dry
      • Wet
    • Y-o-Y Growth Trend Analysis By Lubrication, 2020 to 2024
    • Absolute $ Opportunity Analysis By Lubrication, 2025 to 2035
  10. Market Analysis 2020 to 2024 and Forecast 2025 to 2035, By Flow
    • Introduction / Key Findings
    • Historical Market Size Value (USD Mn) & Volume (Units) Analysis By Flow, 2020 to 2024
    • Current and Future Market Size Value (USD Mn) & Volume (Units) Analysis and Forecast By Flow, 2025 to 2035
      • Up to 85 ACFM
      • Up to 150 ACFM
      • Up to 550 ACFM
      • Up to 1,500 ACFM
      • Up to 4,500 ACFM
      • Up to 8,500 ACFM
      • Up to 15,000 ACFM
      • Up to 17,000 ACFM
    • Y-o-Y Growth Trend Analysis By Flow, 2020 to 2024
    • Absolute $ Opportunity Analysis By Flow, 2025 to 2035
  11. Market Analysis 2020 to 2024 and Forecast 2025 to 2035, By Application
    • Introduction / Key Findings
    • Historical Market Size Value (USD Mn) & Volume (Units) Analysis By Application, 2020 to 2024
    • Current and Future Market Size Value (USD Mn) & Volume (Units) Analysis and Forecast By Application, 2025 to 2035
      • Assembly
      • Conveying
      • Dehydration/Drying
      • Engine Testing
      • Evaporation & Distillation
      • Filling
      • Holding/Chucking
      • Manufacturing
      • Material Handling
      • Thermoforming
      • Others
    • Y-o-Y Growth Trend Analysis By Application, 2020 to 2024
    • Absolute $ Opportunity Analysis By Application, 2025 to 2035
  12. Market Analysis 2020 to 2024 and Forecast 2025 to 2035, By End-Use Vertical
    • Introduction / Key Findings
    • Historical Market Size Value (USD Mn) & Volume (Units) Analysis By End-Use Vertical, 2020 to 2024
    • Current and Future Market Size Value (USD Mn) & Volume (Units) Analysis and Forecast By End-Use Vertical, 2025 to 2035
      • Aerospace & Defense
      • Automotive
      • Chemical & Petrochemical
      • Electronics & Semiconductor
      • Food & Beverage
      • Industrial Manufacturing
      • Mining & Construction
      • Oil & Gas
      • Packaging
      • Power Generation
      • Semiconductor and Electronics
      • Others
    • Y-o-Y Growth Trend Analysis By End-Use Vertical, 2020 to 2024
    • Absolute $ Opportunity Analysis By End-Use Vertical, 2025 to 2035
  13. Market Analysis 2020 to 2024 and Forecast 2025 to 2035, By Region
    • Introduction
    • Historical Market Size Value (USD Mn) & Volume (Units) Analysis By Region, 2020 to 2024
    • Current Market Size Value (USD Mn) & Volume (Units) Analysis and Forecast By Region, 2025 to 2035
      • West U.S.
      • Southwest U.S.
      • Midwest U.S.
      • Northeast U.S.
      • Southeast U.S.
    • Market Attractiveness Analysis By Region
  14. West Market Analysis 2020 to 2024 and Forecast 2025 to 2035, By States
    • Historical Market Size Value (USD Mn) & Volume (Units) Trend Analysis By Market Taxonomy, 2020 to 2024
    • Market Size Value (USD Mn) & Volume (Units) Forecast By Market Taxonomy, 2025 to 2035
      • By States
      • By Pump Type
      • By Mechanism
      • By Pressure
      • By Lubrication
      • By Flow
      • By Application
      • By End-Use Vertical
    • Market Attractiveness Analysis
      • By States
      • By Pump Type
      • By Mechanism
      • By Pressure
      • By Lubrication
      • By Flow
      • By Application
      • By End-Use Vertical
    • Key Takeaways
  15. Southwest Market Analysis 2020 to 2024 and Forecast 2025 to 2035, By States
    • Historical Market Size Value (USD Mn) & Volume (Units) Trend Analysis By Market Taxonomy, 2020 to 2024
    • Market Size Value (USD Mn) & Volume (Units) Forecast By Market Taxonomy, 2025 to 2035
      • By States
      • By Pump Type
      • By Mechanism
      • By Pressure
      • By Lubrication
      • By Flow
      • By Application
      • By End-Use Vertical
    • Market Attractiveness Analysis
      • By States
      • By Pump Type
      • By Mechanism
      • By Pressure
      • By Lubrication
      • By Flow
      • By Application
      • By End-Use Vertical
    • Key Takeaways
  16. Midwest Market Analysis 2020 to 2024 and Forecast 2025 to 2035, By States
    • Historical Market Size Value (USD Mn) & Volume (Units) Trend Analysis By Market Taxonomy, 2020 to 2024
    • Market Size Value (USD Mn) & Volume (Units) Forecast By Market Taxonomy, 2025 to 2035
      • By States
      • By Pump Type
      • By Mechanism
      • By Pressure
      • By Lubrication
      • By Flow
      • By Application
      • By End-Use Vertical
    • Market Attractiveness Analysis
      • By States
      • By Pump Type
      • By Mechanism
      • By Pressure
      • By Lubrication
      • By Flow
      • By Application
      • By End-Use Vertical
    • Key Takeaways
  17. Northeast Market Analysis 2020 to 2024 and Forecast 2025 to 2035, By States
    • Historical Market Size Value (USD Mn) & Volume (Units) Trend Analysis By Market Taxonomy, 2020 to 2024
    • Market Size Value (USD Mn) & Volume (Units) Forecast By Market Taxonomy, 2025 to 2035
      • By States
      • By Pump Type
      • By Mechanism
      • By Pressure
      • By Lubrication
      • By Flow
      • By Application
      • By End-Use Vertical
    • Market Attractiveness Analysis
      • By States
      • By Pump Type
      • By Mechanism
      • By Pressure
      • By Lubrication
      • By Flow
      • By Application
      • By End-Use Vertical
    • Key Takeaways
  18. Southeast Market Analysis 2020 to 2024 and Forecast 2025 to 2035, By States
    • Historical Market Size Value (USD Mn) & Volume (Units) Trend Analysis By Market Taxonomy, 2020 to 2024
    • Market Size Value (USD Mn) & Volume (Units) Forecast By Market Taxonomy, 2025 to 2035
      • By States
      • By Pump Type
      • By Mechanism
      • By Pressure
      • By Lubrication
      • By Flow
      • By Application
      • By End-Use Vertical
    • Market Attractiveness Analysis
      • By States
      • By Pump Type
      • By Mechanism
      • By Pressure
      • By Lubrication
      • By Flow
      • By Application
      • By End-Use Vertical
    • Key Takeaways
  19. Key Countries Market Analysis
    • West U.S.
      • Pricing Analysis
      • Market Share Analysis, 2024
        • By Pump Type
        • By Mechanism
        • By Pressure
        • By Lubrication
        • By Flow
        • By Application
        • By End-Use Vertical
    • Southwest U.S.
      • Pricing Analysis
      • Market Share Analysis, 2024
        • By Pump Type
        • By Mechanism
        • By Pressure
        • By Lubrication
        • By Flow
        • By Application
        • By End-Use Vertical
    • Midwest U.S.
      • Pricing Analysis
      • Market Share Analysis, 2024
        • By Pump Type
        • By Mechanism
        • By Pressure
        • By Lubrication
        • By Flow
        • By Application
        • By End-Use Vertical
    • Northeast U.S.
      • Pricing Analysis
      • Market Share Analysis, 2024
        • By Pump Type
        • By Mechanism
        • By Pressure
        • By Lubrication
        • By Flow
        • By Application
        • By End-Use Vertical
    • Southeast U.S.
      • Pricing Analysis
      • Market Share Analysis, 2024
        • By Pump Type
        • By Mechanism
        • By Pressure
        • By Lubrication
        • By Flow
        • By Application
        • By End-Use Vertical
  20. Market Structure Analysis
    • Competition Dashboard
    • Competition Benchmarking
    • Market Share Analysis of Top Players
      • By Regional
      • By Pump Type
      • By Mechanism
      • By Pressure
      • By Lubrication
      • By Flow
      • By Application
      • By End-Use Vertical
  21. Competition Analysis
    • Competition Deep Dive
      • Becker Pumps Corporation
        • Overview
        • Product Portfolio
        • Profitability by Market Segments (Product/Age /Sales Channel/Region)
        • Sales Footprint
        • Strategy Overview
          • Marketing Strategy
          • Product Strategy
          • Channel Strategy
      • Gardner Denver
        • Overview
        • Product Portfolio
        • Profitability by Market Segments (Product/Age /Sales Channel/Region)
        • Sales Footprint
        • Strategy Overview
          • Marketing Strategy
          • Product Strategy
          • Channel Strategy
      • KNF Neuberger, Inc.
        • Overview
        • Product Portfolio
        • Profitability by Market Segments (Product/Age /Sales Channel/Region)
        • Sales Footprint
        • Strategy Overview
          • Marketing Strategy
          • Product Strategy
          • Channel Strategy
      • Tuthill Corporation
        • Overview
        • Product Portfolio
        • Profitability by Market Segments (Product/Age /Sales Channel/Region)
        • Sales Footprint
        • Strategy Overview
          • Marketing Strategy
          • Product Strategy
          • Channel Strategy
      • Vooner FloGard Corporation
        • Overview
        • Product Portfolio
        • Profitability by Market Segments (Product/Age /Sales Channel/Region)
        • Sales Footprint
        • Strategy Overview
          • Marketing Strategy
          • Product Strategy
          • Channel Strategy
      • Wintek Corporation
        • Overview
        • Product Portfolio
        • Profitability by Market Segments (Product/Age /Sales Channel/Region)
        • Sales Footprint
        • Strategy Overview
          • Marketing Strategy
          • Product Strategy
          • Channel Strategy
      • Lyco Wausau, Inc.
        • Overview
        • Product Portfolio
        • Profitability by Market Segments (Product/Age /Sales Channel/Region)
        • Sales Footprint
        • Strategy Overview
          • Marketing Strategy
          • Product Strategy
          • Channel Strategy
      • DEKKER Vacuum Technologies
        • Overview
        • Product Portfolio
        • Profitability by Market Segments (Product/Age /Sales Channel/Region)
        • Sales Footprint
        • Strategy Overview
          • Marketing Strategy
          • Product Strategy
          • Channel Strategy
      • Busch Vacuum Solutions
        • Overview
        • Product Portfolio
        • Profitability by Market Segments (Product/Age /Sales Channel/Region)
        • Sales Footprint
        • Strategy Overview
          • Marketing Strategy
          • Product Strategy
          • Channel Strategy
      • Ingersoll Rand Inc.
        • Overview
        • Product Portfolio
        • Profitability by Market Segments (Product/Age /Sales Channel/Region)
        • Sales Footprint
        • Strategy Overview
          • Marketing Strategy
          • Product Strategy
          • Channel Strategy
  22. Assumptions & Acronyms Used
  23. Research Methodology

List Of Table

  • Table 1: Market Value (USD Mn) Forecast by Region, 2020 to 2035
  • Table 2: Market Volume (Units) Forecast by Region, 2020 to 2035
  • Table 3: Market Value (USD Mn) Forecast by Pump Type, 2020 to 2035
  • Table 4: Market Volume (Units) Forecast by Pump Type, 2020 to 2035
  • Table 5: Market Value (USD Mn) Forecast by Mechanism, 2020 to 2035
  • Table 6: Market Volume (Units) Forecast by Mechanism, 2020 to 2035
  • Table 7: Market Value (USD Mn) Forecast by Pressure, 2020 to 2035
  • Table 8: Market Volume (Units) Forecast by Pressure, 2020 to 2035
  • Table 9: Market Value (USD Mn) Forecast by Lubrication, 2020 to 2035
  • Table 10: Market Volume (Units) Forecast by Lubrication, 2020 to 2035
  • Table 11: Market Value (USD Mn) Forecast by Flow, 2020 to 2035
  • Table 12: Market Volume (Units) Forecast by Flow, 2020 to 2035
  • Table 13: Market Value (USD Mn) Forecast by Application, 2020 to 2035
  • Table 14: Market Volume (Units) Forecast by Application, 2020 to 2035
  • Table 15: Market Value (USD Mn) Forecast by End-Use Vertical, 2020 to 2035
  • Table 16: Market Volume (Units) Forecast by End-Use Vertical, 2020 to 2035
  • Table 17: West Market Value (USD Mn) Forecast by States, 2020 to 2035
  • Table 18: West Market Volume (Units) Forecast by States, 2020 to 2035
  • Table 19: West Market Value (USD Mn) Forecast by Pump Type, 2020 to 2035
  • Table 20: West Market Volume (Units) Forecast by Pump Type, 2020 to 2035
  • Table 21: West Market Value (USD Mn) Forecast by Mechanism, 2020 to 2035
  • Table 22: West Market Volume (Units) Forecast by Mechanism, 2020 to 2035
  • Table 23: West Market Value (USD Mn) Forecast by Pressure, 2020 to 2035
  • Table 24: West Market Volume (Units) Forecast by Pressure, 2020 to 2035
  • Table 25: West Market Value (USD Mn) Forecast by Lubrication, 2020 to 2035
  • Table 26: West Market Volume (Units) Forecast by Lubrication, 2020 to 2035
  • Table 27: West Market Value (USD Mn) Forecast by Flow, 2020 to 2035
  • Table 28: West Market Volume (Units) Forecast by Flow, 2020 to 2035
  • Table 29: West Market Value (USD Mn) Forecast by Application, 2020 to 2035
  • Table 30: West Market Volume (Units) Forecast by Application, 2020 to 2035
  • Table 31: West Market Value (USD Mn) Forecast by End-Use Vertical, 2020 to 2035
  • Table 32: West Market Volume (Units) Forecast by End-Use Vertical, 2020 to 2035
  • Table 33: Southwest Market Value (USD Mn) Forecast by States, 2020 to 2035
  • Table 34: Southwest Market Volume (Units) Forecast by States, 2020 to 2035
  • Table 35: Southwest Market Value (USD Mn) Forecast by Pump Type, 2020 to 2035
  • Table 36: Southwest Market Volume (Units) Forecast by Pump Type, 2020 to 2035
  • Table 37: Southwest Market Value (USD Mn) Forecast by Mechanism, 2020 to 2035
  • Table 38: Southwest Market Volume (Units) Forecast by Mechanism, 2020 to 2035
  • Table 39: Southwest Market Value (USD Mn) Forecast by Pressure, 2020 to 2035
  • Table 40: Southwest Market Volume (Units) Forecast by Pressure, 2020 to 2035
  • Table 41: Southwest Market Value (USD Mn) Forecast by Lubrication, 2020 to 2035
  • Table 42: Southwest Market Volume (Units) Forecast by Lubrication, 2020 to 2035
  • Table 43: Southwest Market Value (USD Mn) Forecast by Flow, 2020 to 2035
  • Table 44: Southwest Market Volume (Units) Forecast by Flow, 2020 to 2035
  • Table 45: Southwest Market Value (USD Mn) Forecast by Application, 2020 to 2035
  • Table 46: Southwest Market Volume (Units) Forecast by Application, 2020 to 2035
  • Table 47: Southwest Market Value (USD Mn) Forecast by End-Use Vertical, 2020 to 2035
  • Table 48: Southwest Market Volume (Units) Forecast by End-Use Vertical, 2020 to 2035
  • Table 49: Midwest Market Value (USD Mn) Forecast by States, 2020 to 2035
  • Table 50: Midwest Market Volume (Units) Forecast by States, 2020 to 2035
  • Table 51: Midwest Market Value (USD Mn) Forecast by Pump Type, 2020 to 2035
  • Table 52: Midwest Market Volume (Units) Forecast by Pump Type, 2020 to 2035
  • Table 53: Midwest Market Value (USD Mn) Forecast by Mechanism, 2020 to 2035
  • Table 54: Midwest Market Volume (Units) Forecast by Mechanism, 2020 to 2035
  • Table 55: Midwest Market Value (USD Mn) Forecast by Pressure, 2020 to 2035
  • Table 56: Midwest Market Volume (Units) Forecast by Pressure, 2020 to 2035
  • Table 57: Midwest Market Value (USD Mn) Forecast by Lubrication, 2020 to 2035
  • Table 58: Midwest Market Volume (Units) Forecast by Lubrication, 2020 to 2035
  • Table 59: Midwest Market Value (USD Mn) Forecast by Flow, 2020 to 2035
  • Table 60: Midwest Market Volume (Units) Forecast by Flow, 2020 to 2035
  • Table 61: Midwest Market Value (USD Mn) Forecast by Application, 2020 to 2035
  • Table 62: Midwest Market Volume (Units) Forecast by Application, 2020 to 2035
  • Table 63: Midwest Market Value (USD Mn) Forecast by End-Use Vertical, 2020 to 2035
  • Table 64: Midwest Market Volume (Units) Forecast by End-Use Vertical, 2020 to 2035
  • Table 65: Northeast Market Value (USD Mn) Forecast by States, 2020 to 2035
  • Table 66: Northeast Market Volume (Units) Forecast by States, 2020 to 2035
  • Table 67: Northeast Market Value (USD Mn) Forecast by Pump Type, 2020 to 2035
  • Table 68: Northeast Market Volume (Units) Forecast by Pump Type, 2020 to 2035
  • Table 69: Northeast Market Value (USD Mn) Forecast by Mechanism, 2020 to 2035
  • Table 70: Northeast Market Volume (Units) Forecast by Mechanism, 2020 to 2035
  • Table 71: Northeast Market Value (USD Mn) Forecast by Pressure, 2020 to 2035
  • Table 72: Northeast Market Volume (Units) Forecast by Pressure, 2020 to 2035
  • Table 73: Northeast Market Value (USD Mn) Forecast by Lubrication, 2020 to 2035
  • Table 74: Northeast Market Volume (Units) Forecast by Lubrication, 2020 to 2035
  • Table 75: Northeast Market Value (USD Mn) Forecast by Flow, 2020 to 2035
  • Table 76: Northeast Market Volume (Units) Forecast by Flow, 2020 to 2035
  • Table 77: Northeast Market Value (USD Mn) Forecast by Application, 2020 to 2035
  • Table 78: Northeast Market Volume (Units) Forecast by Application, 2020 to 2035
  • Table 79: Northeast Market Value (USD Mn) Forecast by End-Use Vertical, 2020 to 2035
  • Table 80: Northeast Market Volume (Units) Forecast by End-Use Vertical, 2020 to 2035
  • Table 81: Southeast Market Value (USD Mn) Forecast by States, 2020 to 2035
  • Table 82: Southeast Market Volume (Units) Forecast by States, 2020 to 2035
  • Table 83: Southeast Market Value (USD Mn) Forecast by Pump Type, 2020 to 2035
  • Table 84: Southeast Market Volume (Units) Forecast by Pump Type, 2020 to 2035
  • Table 85: Southeast Market Value (USD Mn) Forecast by Mechanism, 2020 to 2035
  • Table 86: Southeast Market Volume (Units) Forecast by Mechanism, 2020 to 2035
  • Table 87: Southeast Market Value (USD Mn) Forecast by Pressure, 2020 to 2035
  • Table 88: Southeast Market Volume (Units) Forecast by Pressure, 2020 to 2035
  • Table 89: Southeast Market Value (USD Mn) Forecast by Lubrication, 2020 to 2035
  • Table 90: Southeast Market Volume (Units) Forecast by Lubrication, 2020 to 2035
  • Table 91: Southeast Market Value (USD Mn) Forecast by Flow, 2020 to 2035
  • Table 92: Southeast Market Volume (Units) Forecast by Flow, 2020 to 2035
  • Table 93: Southeast Market Value (USD Mn) Forecast by Application, 2020 to 2035
  • Table 94: Southeast Market Volume (Units) Forecast by Application, 2020 to 2035
  • Table 95: Southeast Market Value (USD Mn) Forecast by End-Use Vertical, 2020 to 2035
  • Table 96: Southeast Market Volume (Units) Forecast by End-Use Vertical, 2020 to 2035

List Of Figures

  • Figure 1: Market Volume (Units) Forecast 2020 to 2035
  • Figure 2: Market Pricing Analysis
  • Figure 3: Market Value (USD Mn) Forecast 2020 to 2035
  • Figure 4: Market Value Share and BPS Analysis by Pump Type, 2025 and 2035
  • Figure 5: Market Y-o-Y Growth Comparison by Pump Type, 2025 to 2035
  • Figure 6: Market Attractiveness Analysis by Pump Type
  • Figure 7: Market Value Share and BPS Analysis by Mechanism, 2025 and 2035
  • Figure 8: Market Y-o-Y Growth Comparison by Mechanism, 2025 to 2035
  • Figure 9: Market Attractiveness Analysis by Mechanism
  • Figure 10: Market Value Share and BPS Analysis by Pressure, 2025 and 2035
  • Figure 11: Market Y-o-Y Growth Comparison by Pressure, 2025 to 2035
  • Figure 12: Market Attractiveness Analysis by Pressure
  • Figure 13: Market Value Share and BPS Analysis by Lubrication, 2025 and 2035
  • Figure 14: Market Y-o-Y Growth Comparison by Lubrication, 2025 to 2035
  • Figure 15: Market Attractiveness Analysis by Lubrication
  • Figure 16: Market Value Share and BPS Analysis by Flow, 2025 and 2035
  • Figure 17: Market Y-o-Y Growth Comparison by Flow, 2025 to 2035
  • Figure 18: Market Attractiveness Analysis by Flow
  • Figure 19: Market Value Share and BPS Analysis by Application, 2025 and 2035
  • Figure 20: Market Y-o-Y Growth Comparison by Application, 2025 to 2035
  • Figure 21: Market Attractiveness Analysis by Application
  • Figure 22: Market Value Share and BPS Analysis by End-Use Vertical, 2025 and 2035
  • Figure 23: Market Y-o-Y Growth Comparison by End-Use Vertical, 2025 to 2035
  • Figure 24: Market Attractiveness Analysis by End-Use Vertical
  • Figure 25: Market Value (USD Mn) Share and BPS Analysis by Region, 2025 and 2035
  • Figure 26: Market Y-o-Y Growth Comparison by Region, 2025 to 2035
  • Figure 27: Market Attractiveness Analysis by Region
  • Figure 28: West Market Incremental $ Opportunity, 2025 to 2035
  • Figure 29: Southwest Market Incremental $ Opportunity, 2025 to 2035
  • Figure 30: Midwest Market Incremental $ Opportunity, 2025 to 2035
  • Figure 31: Northeast Market Incremental $ Opportunity, 2025 to 2035
  • Figure 32: Southeast Market Incremental $ Opportunity, 2025 to 2035
  • Figure 33: West Market Value Share and BPS Analysis by States, 2025 and 2035
  • Figure 34: West Market Value Share and BPS Analysis by Pump Type, 2025 and 2035
  • Figure 35: West Market Y-o-Y Growth Comparison by Pump Type, 2025 to 2035
  • Figure 36: West Market Attractiveness Analysis by Pump Type
  • Figure 37: West Market Value Share and BPS Analysis by Mechanism, 2025 and 2035
  • Figure 38: West Market Y-o-Y Growth Comparison by Mechanism, 2025 to 2035
  • Figure 39: West Market Attractiveness Analysis by Mechanism
  • Figure 40: West Market Value Share and BPS Analysis by Pressure, 2025 and 2035
  • Figure 41: West Market Y-o-Y Growth Comparison by Pressure, 2025 to 2035
  • Figure 42: West Market Attractiveness Analysis by Pressure
  • Figure 43: West Market Value Share and BPS Analysis by Lubrication, 2025 and 2035
  • Figure 44: West Market Y-o-Y Growth Comparison by Lubrication, 2025 to 2035
  • Figure 45: West Market Attractiveness Analysis by Lubrication
  • Figure 46: West Market Value Share and BPS Analysis by Flow, 2025 and 2035
  • Figure 47: West Market Y-o-Y Growth Comparison by Flow, 2025 to 2035
  • Figure 48: West Market Attractiveness Analysis by Flow
  • Figure 49: West Market Value Share and BPS Analysis by Application, 2025 and 2035
  • Figure 50: West Market Y-o-Y Growth Comparison by Application, 2025 to 2035
  • Figure 51: West Market Attractiveness Analysis by Application
  • Figure 52: West Market Value Share and BPS Analysis by End-Use Vertical, 2025 and 2035
  • Figure 53: West Market Y-o-Y Growth Comparison by End-Use Vertical, 2025 to 2035
  • Figure 54: West Market Attractiveness Analysis by End-Use Vertical
  • Figure 55: Southwest Market Value Share and BPS Analysis by States, 2025 and 2035
  • Figure 56: Southwest Market Value Share and BPS Analysis by Pump Type, 2025 and 2035
  • Figure 57: Southwest Market Y-o-Y Growth Comparison by Pump Type, 2025 to 2035
  • Figure 58: Southwest Market Attractiveness Analysis by Pump Type
  • Figure 59: Southwest Market Value Share and BPS Analysis by Mechanism, 2025 and 2035
  • Figure 60: Southwest Market Y-o-Y Growth Comparison by Mechanism, 2025 to 2035
  • Figure 61: Southwest Market Attractiveness Analysis by Mechanism
  • Figure 62: Southwest Market Value Share and BPS Analysis by Pressure, 2025 and 2035
  • Figure 63: Southwest Market Y-o-Y Growth Comparison by Pressure, 2025 to 2035
  • Figure 64: Southwest Market Attractiveness Analysis by Pressure
  • Figure 65: Southwest Market Value Share and BPS Analysis by Lubrication, 2025 and 2035
  • Figure 66: Southwest Market Y-o-Y Growth Comparison by Lubrication, 2025 to 2035
  • Figure 67: Southwest Market Attractiveness Analysis by Lubrication
  • Figure 68: Southwest Market Value Share and BPS Analysis by Flow, 2025 and 2035
  • Figure 69: Southwest Market Y-o-Y Growth Comparison by Flow, 2025 to 2035
  • Figure 70: Southwest Market Attractiveness Analysis by Flow
  • Figure 71: Southwest Market Value Share and BPS Analysis by Application, 2025 and 2035
  • Figure 72: Southwest Market Y-o-Y Growth Comparison by Application, 2025 to 2035
  • Figure 73: Southwest Market Attractiveness Analysis by Application
  • Figure 74: Southwest Market Value Share and BPS Analysis by End-Use Vertical, 2025 and 2035
  • Figure 75: Southwest Market Y-o-Y Growth Comparison by End-Use Vertical, 2025 to 2035
  • Figure 76: Southwest Market Attractiveness Analysis by End-Use Vertical
  • Figure 77: Midwest Market Value Share and BPS Analysis by States, 2025 and 2035
  • Figure 78: Midwest Market Value Share and BPS Analysis by Pump Type, 2025 and 2035
  • Figure 79: Midwest Market Y-o-Y Growth Comparison by Pump Type, 2025 to 2035
  • Figure 80: Midwest Market Attractiveness Analysis by Pump Type
  • Figure 81: Midwest Market Value Share and BPS Analysis by Mechanism, 2025 and 2035
  • Figure 82: Midwest Market Y-o-Y Growth Comparison by Mechanism, 2025 to 2035
  • Figure 83: Midwest Market Attractiveness Analysis by Mechanism
  • Figure 84: Midwest Market Value Share and BPS Analysis by Pressure, 2025 and 2035
  • Figure 85: Midwest Market Y-o-Y Growth Comparison by Pressure, 2025 to 2035
  • Figure 86: Midwest Market Attractiveness Analysis by Pressure
  • Figure 87: Midwest Market Value Share and BPS Analysis by Lubrication, 2025 and 2035
  • Figure 88: Midwest Market Y-o-Y Growth Comparison by Lubrication, 2025 to 2035
  • Figure 89: Midwest Market Attractiveness Analysis by Lubrication
  • Figure 90: Midwest Market Value Share and BPS Analysis by Flow, 2025 and 2035
  • Figure 91: Midwest Market Y-o-Y Growth Comparison by Flow, 2025 to 2035
  • Figure 92: Midwest Market Attractiveness Analysis by Flow
  • Figure 93: Midwest Market Value Share and BPS Analysis by Application, 2025 and 2035
  • Figure 94: Midwest Market Y-o-Y Growth Comparison by Application, 2025 to 2035
  • Figure 95: Midwest Market Attractiveness Analysis by Application
  • Figure 96: Midwest Market Value Share and BPS Analysis by End-Use Vertical, 2025 and 2035
  • Figure 97: Midwest Market Y-o-Y Growth Comparison by End-Use Vertical, 2025 to 2035
  • Figure 98: Midwest Market Attractiveness Analysis by End-Use Vertical
  • Figure 99: Northeast Market Value Share and BPS Analysis by States, 2025 and 2035
  • Figure 100: Northeast Market Value Share and BPS Analysis by Pump Type, 2025 and 2035
  • Figure 101: Northeast Market Y-o-Y Growth Comparison by Pump Type, 2025 to 2035
  • Figure 102: Northeast Market Attractiveness Analysis by Pump Type
  • Figure 103: Northeast Market Value Share and BPS Analysis by Mechanism, 2025 and 2035
  • Figure 104: Northeast Market Y-o-Y Growth Comparison by Mechanism, 2025 to 2035
  • Figure 105: Northeast Market Attractiveness Analysis by Mechanism
  • Figure 106: Northeast Market Value Share and BPS Analysis by Pressure, 2025 and 2035
  • Figure 107: Northeast Market Y-o-Y Growth Comparison by Pressure, 2025 to 2035
  • Figure 108: Northeast Market Attractiveness Analysis by Pressure
  • Figure 109: Northeast Market Value Share and BPS Analysis by Lubrication, 2025 and 2035
  • Figure 110: Northeast Market Y-o-Y Growth Comparison by Lubrication, 2025 to 2035
  • Figure 111: Northeast Market Attractiveness Analysis by Lubrication
  • Figure 112: Northeast Market Value Share and BPS Analysis by Flow, 2025 and 2035
  • Figure 113: Northeast Market Y-o-Y Growth Comparison by Flow, 2025 to 2035
  • Figure 114: Northeast Market Attractiveness Analysis by Flow
  • Figure 115: Northeast Market Value Share and BPS Analysis by Application, 2025 and 2035
  • Figure 116: Northeast Market Y-o-Y Growth Comparison by Application, 2025 to 2035
  • Figure 117: Northeast Market Attractiveness Analysis by Application
  • Figure 118: Northeast Market Value Share and BPS Analysis by End-Use Vertical, 2025 and 2035
  • Figure 119: Northeast Market Y-o-Y Growth Comparison by End-Use Vertical, 2025 to 2035
  • Figure 120: Northeast Market Attractiveness Analysis by End-Use Vertical
  • Figure 121: Southeast Market Value Share and BPS Analysis by States, 2025 and 2035
  • Figure 122: Southeast Market Value Share and BPS Analysis by Pump Type, 2025 and 2035
  • Figure 123: Southeast Market Y-o-Y Growth Comparison by Pump Type, 2025 to 2035
  • Figure 124: Southeast Market Attractiveness Analysis by Pump Type
  • Figure 125: Southeast Market Value Share and BPS Analysis by Mechanism, 2025 and 2035
  • Figure 126: Southeast Market Y-o-Y Growth Comparison by Mechanism, 2025 to 2035
  • Figure 127: Southeast Market Attractiveness Analysis by Mechanism
  • Figure 128: Southeast Market Value Share and BPS Analysis by Pressure, 2025 and 2035
  • Figure 129: Southeast Market Y-o-Y Growth Comparison by Pressure, 2025 to 2035
  • Figure 130: Southeast Market Attractiveness Analysis by Pressure
  • Figure 131: Southeast Market Value Share and BPS Analysis by Lubrication, 2025 and 2035
  • Figure 132: Southeast Market Y-o-Y Growth Comparison by Lubrication, 2025 to 2035
  • Figure 133: Southeast Market Attractiveness Analysis by Lubrication
  • Figure 134: Southeast Market Value Share and BPS Analysis by Flow, 2025 and 2035
  • Figure 135: Southeast Market Y-o-Y Growth Comparison by Flow, 2025 to 2035
  • Figure 136: Southeast Market Attractiveness Analysis by Flow
  • Figure 137: Southeast Market Value Share and BPS Analysis by Application, 2025 and 2035
  • Figure 138: Market - Tier Structure Analysis
  • Figure 139: Market - Company Share Analysis

- FAQs -

What was the U.S. Vacuum Pumps Market Size Reported by Fact.MR for 2025?

The U.S. Vacuum Pumps Market was valued at USD 2,164 Million in 2025.

Who are the Major Players Operating in the U.S. Vacuum Pumps Market?

Prominent players in the market are Becker Pumps Corporation, Gardner Denver, KNF Neuberger, Inc., Tuthill Corporation, Vooner FloGard Corporation, among others.

What is the Estimated Valuation of the U.S. Vacuum Pumps Market in 2035?

The market is expected to reach a valuation of USD 4,139 Million in 2035.

What Value CAGR did the U.S. Vacuum Pumps Market Exhibit Over the Last Five Years?

The historic growth rate of the U.S. Vacuum Pumps Market was 5.9% from 2020 to 2024.

- Also of Interest -

Vacuum Pump Market

Vacuum Pump Market Study by Positive Displacement, Dry, Centrifugal, Momentum Transfer, and Regenerative Application Vacuum Pumps from 2024 to 2034

Vacuum Degreaser Industry Analysis in Middle East & Africa

Study on Vacuum Degreasers in Middle East & Africa by Use in Aerospace, Automotive, Industrial Machining, Casting & Metal Working, Semiconductors & Electronics, and Medical from 2024 to 2034

Vacuum Degreaser Industry Analysis in East Asia

Study on Vacuum Degreasers in East Asia by Use in Aerospace, Automotive, Industrial Machining, Casting & Metal Working, Semiconductors & Electronics, and Medical from 2024 to 2034

Vacuum Degreaser Industry Analysis in Europe

Study on Vacuum Degreasers in Europe by Use in Aerospace, Automotive, Industrial Machining, Casting & Metal Working, Semiconductors & Electronics, and Medical from 2024 to 2034

U.S. Vacuum Pumps Market

Schedule a Call