- Market Value (2025): USD 20.1 Bn
- Estimated Value (2026): USD 23.8 Bn
- Forecast Value (2036): USD 128.9 Bn
- CAGR (2026-2036): 18.4%
What is the API Marketplace Market forecast to be worth by 2036?
USD 23.8 billion in 2026 to USD 128.9 billion by 2036, at 18.4% CAGR.
- The API marketplace market crossed a valuation of USD 20.1 billion in 2025 as enterprise API programs expanded beyond internal gateway management.
- Demand is projected to increase from USD 23.8 billion in 2026 to USD 128.9 billion by 2036.
- The market is forecast to record an 18.4% CAGR from 2026 to 2036 as platform teams and API publishers build governed distribution channels.
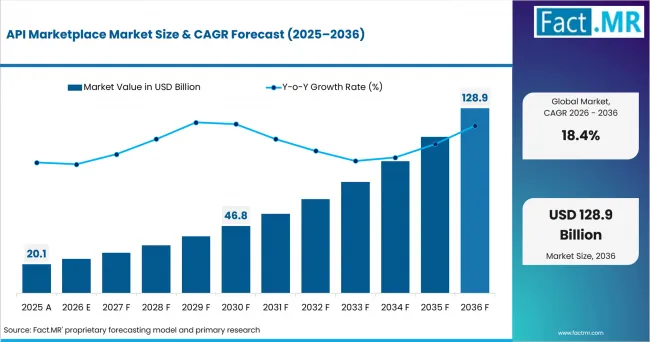
Api Marketplace Market Market Value Analysis | Source: Fact.MR
What are the defining numbers behind API Marketplace Market growth?
USD 105.1 billion absolute opportunity by 2036 led by Cloud and SMEs alongside BFSI demand.
- Demand Drivers in the Market
- API product managers need reliable metering and subscription controls because commercial API programs depend on usage visibility before revenue sharing becomes practical.
- Platform engineering teams need federated discovery supported by shared metadata that exposes services across several gateways without forcing complete platform replacement.
- Fintech product teams need reusable payment and account interfaces owing to high transaction frequency across regulated payment channels and partner ecosystems.
- Integration architects need tested connectors attributable to pressure for shorter deployment cycles across workflows that join cloud services with existing enterprise systems.
- Key Segments Analyzed
- By Component: Software is expected to garner 31% share in 2026, driven by catalog governance and subscription workflows inside reusable platform environments.
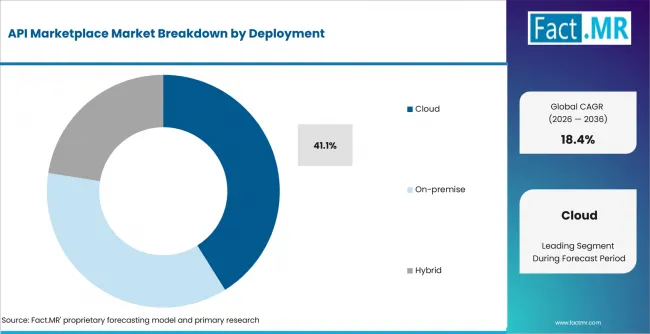
- By Deployment: Cloud is projected to account for 41.1% share in 2026, supported by faster publication and consumption across distributed developer teams.
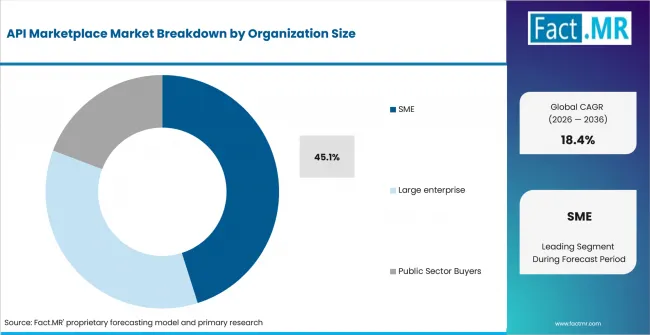
- By Organization Size: SMEs are anticipated to capture 45.1% share in 2026, owing to lower entry barriers for specialist API consumption and monetization.
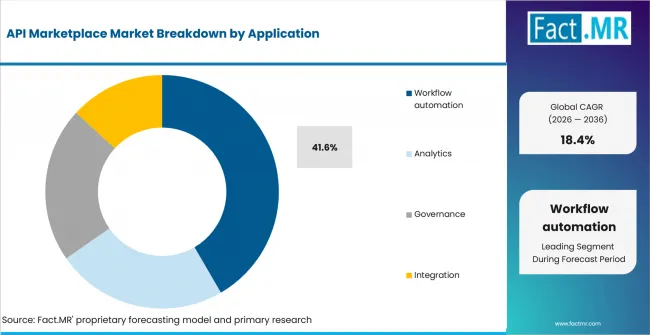
- By Application: Workflow Automation is estimated to represent 41.6% share in 2026, attributable to reusable interfaces that reduce repeated point-to-point integration work.
- By End Use: BFSI is forecast to record 25.5% share in 2026, shaped by payment connectivity and consent-based financial data exchange.
- Analyst Opinion at Fact.MR
- Shambhu Nath Jha, Senior Analyst at Fact.MR states: “The commercial bottleneck is no longer simple API publication. Enterprise teams need trust signals across documentation and access control before they approve external consumption. Adoption is expected to favor providers that combine discovery with metering and policy enforcement inside one governed route to consumption.”
- Strategic Implications
- API publishers should standardize documentation and support policies before attaching paid plans to endpoints across public or partner-facing marketplaces.
- Platform engineering teams should federate discovery across existing gateways so internal teams reuse approved services before commissioning duplicate interfaces.
- Procurement leaders should review usage tiers and data rights before approving multi-year marketplace contracts whose costs shift with transaction volume.
- Security leaders should pair scoped credentials with continuous policy checks so marketplace access does not weaken identity controls at service boundaries.
Nokia placed Quality of Service on Demand and Number Verification APIs on Google Cloud Marketplace in July 2025. Device Location Verification joined the same marketplace release and added a transaction-authentication use case for application teams. The arrangement gave developers a cloud procurement route into standardized network capabilities exposed through Nokia’s Network as Code platform. The move reflects a wider shift toward API distribution channels that join discovery with trusted commercial access.
India is expected to record 20.2% CAGR during the forecast period, driven by interoperable payment rails and broader digital public infrastructure use. China is projected to post 19.5% CAGR between 2026 and 2036, supported by platform commerce and large online service ecosystems. Australia is anticipated to advance at 18.2% CAGR over the assessment period, owing to business software adoption and rising experimentation with artificial intelligence. The United Kingdom is estimated to record 17.9% CAGR from 2026 to 2036, attributable to open banking traffic and regulated third-party access models. The United States is forecast to post 17.7% CAGR across the forecast, shaped by e-commerce scale and enterprise API product programs.
How does the API Marketplace Market break down by segment?
Cloud accounts for 41.1% share; SMEs hold 45.1% share.
Which Component dominates?
Software accounts for 31% share in 2026.
Software is expected to account for 31% share in 2026, driven by the need to publish catalogs and control access inside one operational layer. Services remain relevant for architecture work and migration support during marketplace launches that span several gateway environments. API Tools support design and testing activities before publication reaches commercial channels used by external developer communities. API Connectors shorten integration work for common enterprise applications and data sources used across repeatable business workflows. WSO2’s November 2025 API Manager release added federated gateway discovery and deeper monetization support for organizations managing APIs across several gateway environments.
Which Deployment model accounts for the largest share?
Cloud holds 41.1% share in 2026.
Api Marketplace Market Analysis By Deployment | Source: Fact.MR
Cloud is projected to account for 41.1% share in 2026, supported by distributed developer access and faster catalog publication across partner ecosystems. On-premise deployment remains relevant for organizations that keep policy control and sensitive service metadata inside private infrastructure. Hybrid deployment links internal services with external consumers while preserving selected gateway controls near protected systems. In February 2026, Eurostat reported that 53% of European Union enterprises used paid cloud services during 2025. That installed cloud base lowers the operational distance between marketplace discovery and service consumption across distributed enterprise teams.
How does Organization Size shape demand?
SMEs lead with 45.1% share in 2026.
Api Marketplace Market Analysis By Organization Size | Source: Fact.MR
SMEs are anticipated to capture 45.1% share in 2026, owing to easier access to specialist services without building every capability internally. Large enterprises invest in private catalogs that expose approved APIs across business units and internal developer communities. Public sector buyers use shared standards to connect registries and online public services under formal governance rules. The OECD reported in June 2025 that data-sharing systems were available in 85% of the 33 countries covered by its digital public infrastructure assessment. That institutional foundation expands the addressable base for governed API discovery programs across public service networks.
What supports Workflow Automation within Application?
Workflow Automation holds 41.6% share in 2026.
Api Marketplace Market Analysis By Application | Source: Fact.MR
Workflow Automation is estimated to represent 41.6% share in 2026, attributable to repeatable interfaces that connect business tasks across several software systems. Analytics follows where teams consume external data or model services inside reporting pipelines that support recurring business decisions. Governance applications organize ownership and policy checks before APIs reach wider audiences across partner and customer environments. Integration remains central where catalog assets connect older systems with cloud services across mixed enterprise application estates. Gravitee introduced API Products in April 2026, so platform teams bundled several related APIs under one subscription. The release reflects demand for packaging reusable service groups around a single commercial relationship with consistent subscription terms.
Which End Use category records the largest share?
BFSI captures 25.5% share in 2026.
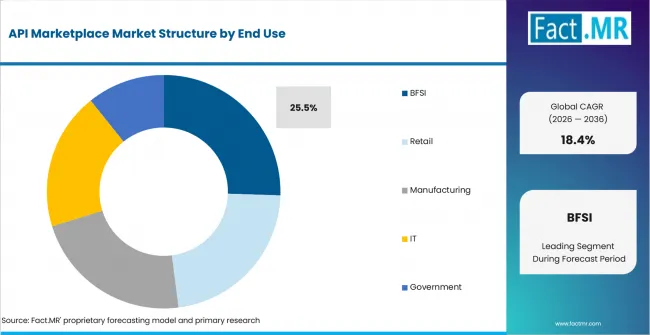
Api Marketplace Market Analysis By End Use | Source: Fact.MR
BFSI is forecast to account for 25.5% share in 2026, shaped by payment connectivity and regulated exchange of account information. Retail uses API marketplaces for payments and logistics services across online commerce platforms that support high transaction volumes. Manufacturing teams consume supplier and equipment interfaces when integrating production applications with planning and maintenance systems. IT providers distribute infrastructure services while governments use shared interfaces for online public services across several agencies. In March 2026, India’s Press Information Bureau reported that UPI processed 21.70 billion transactions during January 2026. Broad institutional participation creates recurring demand for governed financial interfaces and partner onboarding across regulated payment ecosystems.
What is accelerating API Marketplace Market adoption, and what is holding it back?
API productization and cloud distribution drive market expansion; security and quality gaps restrain it.
Drivers Impact Analysis
| DRIVER | (~) % IMPACT ON CAGR | GEOGRAPHIC RELEVANCE | IMPACT TIMELINE |
|---|---|---|---|
| Enterprise API productization | +2.2% | North America and Europe | Medium term (2-4 years) |
| Cloud-native distribution | +1.8% | Global enterprise accounts | Medium term (2-4 years) |
| Open finance and payment interfaces | +1.5% | India and United Kingdom | Short term (<= 2 years) |
| Agent tool consumption | +1.2% | United States and Australia | Medium term (2-4 years) |
| Data-sharing frameworks | +0.9% | Europe and OECD economies | Long term (>= 4 years) |
Source: Fact.MR analysis. Updated Jul 8, 2026
- Enterprise API productization
- Enterprises are treating APIs as products with named owners and documented consumption paths across internal and external channels. Postman reported in June 2025 that its API Network contained more than 100 thousand APIs from 18 thousand publishers. Catalog scale raises the value of search quality and onboarding design because consumers need clearer routes from discovery to successful first calls. Adoption is expected to favor platforms that connect publication with access controls and commercial terms inside one workflow.
- Cloud-native distribution
- Cloud procurement shortens the path between discovering a service and using it inside an application. Marketplace operators connect subscriptions and credentials to environments that development teams already use for testing and production deployment. Enterprise teams also reduce manual vendor onboarding when approved services share common purchasing routes and reusable access policies. Demand is projected to expand as private catalogs and public distribution channels converge around shared metadata and policy controls.
- Open finance and payment interfaces
- High-frequency payment systems make reusable interfaces commercially valuable for banks and fintech application teams serving large transaction networks. In April 2026, India’s Press Information Bureau reported about approximately 220 billion UPI transactions during calendar year 2025. Transaction volume creates repeated needs for identity and payment APIs across partner ecosystems that serve merchants and account holders. Marketplace demand is anticipated to increase where regulated participants need controlled onboarding and clear service contracts.
- Agent tool consumption
- Software agents are creating a second class of API consumer that depends on machine-readable discovery and tighter permissions. The Australian Bureau of Statistics reported in June 2026 that 12% of businesses used artificial intelligence during 2024-25. Agent deployments are expected to increase pressure for catalogs that expose trusted tools and usage limits to automated consumers. Providers also need observability that separates human traffic from agent activity across shared interfaces and subscription plans.
- Data-sharing frameworks
- Data access rules are giving enterprises clearer reasons to package governed interfaces for external use. The European Union Data Act became applicable in September 2025 and established access rights around data from connected products. Marketplace providers are likely to become more relevant where publishers need consent records and policy controls around shared data services. Compliance depth is therefore becoming part of API product design instead of a final review task.
Opportunity Impact Analysis
| OPPORTUNITY | (~) % IMPACT ON CAGR | GEOGRAPHIC RELEVANCE | IMPACT TIMELINE |
|---|---|---|---|
| Federated enterprise catalogs | +1.2% | Europe and North America | Medium term (2-4 years) |
| Usage-based API monetization | +1.0% | Global software ecosystems | Medium term (2-4 years) |
| Agent tool directories | +0.8% | United States and Australia | Short term (<= 2 years) |
| Regional fintech API catalogs | +0.6% | India and China | Long term (>= 4 years) |
Source: Fact.MR analysis. Updated Jul 8, 2026
- Federated enterprise catalogs
- Large organizations often operate several gateways that hide reusable services behind separate discovery experiences for different technical teams. The OECD reported in June 2025 that API standards were adopted across 67% of the 33 countries in its assessment. Shared interface standards provide a base for catalog federation across departments and partner networks that use different gateway products. Opportunity is estimated to widen for platforms that discover assets without forcing an immediate gateway migration.
- Usage-based API monetization
- Publishers need billing models that match actual transaction volume and service value across customer groups. WSO2’s November 2025, API Manager release expanded monetization support while connecting analytics with broader gateway federation. That combination gives product owners a route to price usage after observing consumption patterns across customer groups and service tiers. Commercial opportunity is forecast to expand where entitlement and billing data remain connected to the same subscription record.
- Agent tool directories
- AI agents need trusted tool inventories because unrestricted service discovery creates permission and quality risks. MuleSoft’s January 2026 roadmap introduced catalog support for public MCP servers inside its Agent Registry. The shift extends marketplace logic from human developer discovery to machine-consumable tool selection inside governed enterprise environments. Opportunity is projected to favor providers that combine verified metadata with scoped identity and policy enforcement for agent actions.
- Regional fintech API catalogs
- Local service ecosystems create room for catalogs tailored to domestic payment and commerce requirements across regulated partner networks. In April 2026 China’s National Bureau of Statistics reported that online service retail sales increased 8.8% during the first quarter. Higher service activity increases the range of payment and verification interfaces needed by platform operators. Regional marketplace demand is anticipated to broaden where local documentation and support shorten partner integration work.
Restraints Impact Analysis
| RESTRAINT | (~) % IMPACT ON CAGR | GEOGRAPHIC RELEVANCE | IMPACT TIMELINE |
|---|---|---|---|
| Security and access-control burden | -1.2% | Global regulated sectors | Short term (<= 2 years) |
| Documentation and quality inconsistency | -0.9% | Public API ecosystems | Medium term (2-4 years) |
| Billing economics and platform fees | -0.7% | Independent publishers | Medium term (2-4 years) |
| Legacy integration and procurement friction | -0.6% | Large enterprises | Long term (>= 4 years) |
Source: Fact.MR analysis. Updated Jul 8, 2026
- Security and access-control burden
- Marketplace distribution widens the number of consumers that reach an interface and raises the cost of weak identity controls. Open Banking Limited recorded 10.6 million failed API calls across its reporting network during May 2026. Even low failure rates create operational work when transaction volumes reach billions of calls across a regulated service network. Adoption is estimated to remain selective where providers lack scoped credentials and clear incident handling processes.
- Documentation and quality inconsistency
- A searchable listing does not guarantee that an API is stable or understandable for production use. Consumers lose time when examples are outdated and error behavior remains undocumented across service versions and developer environments. Marketplace operators also face trust problems when publisher quality varies sharply across a single catalog. Adoption is forecast to concentrate around providers that verify ownership and keep version information visible before subscription decisions are made.
- Billing economics and platform fees
- Small publishers struggle to price APIs when demand is volatile and infrastructure costs rise with successful usage. Flat subscription tiers also create poor economics for services with expensive downstream data calls and volatile usage patterns. Marketplace commissions add another variable to customer acquisition costs and renewal planning for independent API publishers. Commercial participation is projected to remain uneven until publishers gain better usage forecasts and clearer control over pricing tiers.
- Legacy integration and procurement friction
- Enterprise catalogs often sit above older systems that were never designed for external subscription or usage measurement. Security reviews and vendor onboarding therefore outlast the technical integration itself across many large enterprise procurement programs. Teams also face duplicated ownership records when gateway inventories do not match procurement systems or internal service catalogs. Adoption is expected to progress more slowly where catalog publication is separated from service ownership and contract approval workflows.
Which countries are scaling API Marketplace Market fastest?
India 20.2% CAGR; China 19.5% CAGR; Australia 18.2% CAGR; United Kingdom 17.9% CAGR; United States 17.7% CAGR.
| COUNTRY | CAGR |
|---|---|
| India | 20.2% |
| China | 19.5% |
| Australia | 18.2% |
| United Kingdom | 17.9% |
| United States | 17.7% |
| Germany | 17.4% |
| Japan | 17.1% |
Source: Fact.MR analysis. Updated Jul 8, 2026
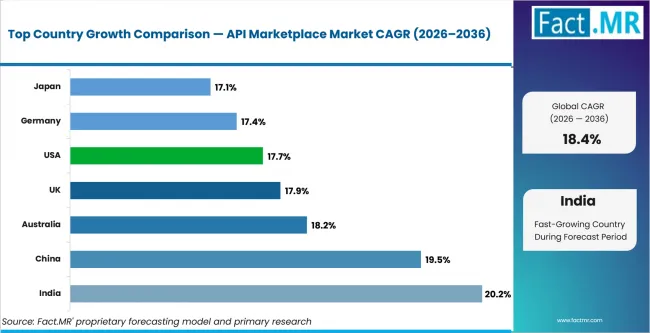
Api Marketplace Market Cagr Analysis By Country | Source: Fact.MR
What is driving India's expansion?
20.2% CAGR, driven by interoperable payment rails and digital public infrastructure.
India’s payment ecosystem gives API publishers a large base of institutions that already depend on interoperable payment and identity services. The market is expected to record 20.2% CAGR over the assessment period and the Press Information Bureau reported 691 banks live on UPI in January 2026. Local providers can improve market access when documentation and onboarding support match domestic compliance and payment workflows.
How is China scaling API Marketplace demand?
19.5% CAGR, supported by platform commerce and expanding online service ecosystems.
China combines platform commerce scale with a dense base of software and payment services that exchange data across applications. The market is projected to post 19.5% CAGR between 2026 and 2036 as domestic teams package payment and identity functions for repeatable partner consumption.
What supports the Australia outlook?
18.2% CAGR, owing to business innovation activity and broader software experimentation.
Australian enterprises are testing new software models across finance and professional services while keeping governance requirements visible during procurement. The Australian Bureau of Statistics reported in June 2026 that 46% of businesses were innovation-active during 2024-25. Demand is anticipated to advance at 18.2% CAGR during the forecast period as platform teams seek governed routes to external data and automation services.
What underpins United Kingdom growth?
17.9% CAGR, backed by open banking traffic and regulated third-party access models.
The United Kingdom has a working open banking ecosystem where high API traffic gives providers a direct view of reliability and access requirements. Open Banking Limited reported 24 billion API calls during 2025 across the United Kingdom ecosystem and regulated provider network. The market is estimated to record 17.9% CAGR across the forecast period as fintech teams extend proven subscription and consent patterns into wider commercial API programs.
How is the United States developing API Marketplace demand?
17.7% CAGR, supported by e-commerce scale and enterprise API product programs.
United States online commerce creates a broad base of firms that already purchase software services and integrate external data. The market is forecast to post 17.7% CAGR over the 2026 to 2036 period and the Census Bureau estimated USD 326.7 billion in seasonally adjusted e-commerce sales during the first quarter of 2026. API marketplaces gain channel value when procurement and technical onboarding move through the same approved environment.
Who leads the API Marketplace Market?
Nokia and Postman lead direct API discovery coverage, while MuleSoft and IBM strengthen enterprise catalog and subscription workflows.
Companies in the industry such as Nokia combine the former Rapid API Hub with Network as Code exposure for telecom interfaces and partner distribution. Postman operates a public and partner API Network that supports discovery and publisher onboarding across verified teams and developers. APILayer adds a curated catalog of data APIs across areas such as geolocation and finance. These providers compete on catalog reach and developer onboarding while commercial controls determine whether discovery converts into recurring usage.
MuleSoft uses Anypoint Exchange for reusable enterprise assets while IBM API Connect combines developer portal discovery with API lifecycle management. WSO2 supports federated gateway discovery and monetization workflows across API environments managed by different enterprise platform teams. Gravitee added API Products in April 2026 so several APIs sit under one subscription and commercial relationship. Competition during the forecast period is expected to be shaped by gateway federation and usage metering alongside machine-readable tool discovery.
Which companies are the key providers?
Nokia, Postman, MuleSoft, IBM, WSO2, Gravitee, APILayer
- Nokia
- Postman
- MuleSoft
- IBM
- WSO2
- Gravitee
- APILayer
Bibliography
- APILayer. (2025, December 16). APIs without AI are just dead endpoints. APILayer.
- Australian Bureau of Statistics. (2026, June 25). Characteristics of Australian business, 2024–25 financial year. Australian Bureau of Statistics.
- European Commission. (2025, September 12). EU Data Act gives users control over data from connected devices. European Commission.
- Eurostat. (2026, February 3). 53% of EU enterprises used paid cloud services in 2025. European Commission.
- Gravitee. (2026, April 7). API Products: Bundle multiple APIs under a single subscription. Gravitee.
- IBM. (2026, June 27). IBM API Connect v10.0.8.10 is now available. IBM Support.
- MuleSoft. (2026, January 30). What’s next for MuleSoft: Q1 2026 product roadmap. MuleSoft.
- National Bureau of Statistics of China. (2026, February 28). Statistical communiqué of the People’s Republic of China on the 2025 national economic and social development. National Bureau of Statistics of China.
- National Bureau of Statistics of China. (2026, April 16). National economy got off to a good start in the first quarter. National Bureau of Statistics of China.
- Nokia. (2024, November 13). Nokia acquires Rapid technology and R&D unit to strengthen development of network API solutions and ecosystem. Nokia.
- Nokia. (2025, July 13). Nokia network APIs now available on Google Cloud Marketplace, making it even easier for developers to utilize. Nokia.
- OECD. (2025, June 19). Digital public infrastructure: Government at a Glance 2025. OECD.
- Open Banking Limited. (2026, January 29). Open Banking in 2025: Now part of the UK’s everyday financial life. Open Banking Limited.
- Open Banking Limited. (2026, May). API performance stats. Open Banking Limited.
- Postman. (2025, June 4). POST/CON 25 keynote recap. Postman.
- Press Information Bureau. (2026, March 6). India’s digital public infrastructure. Government of India.
- Press Information Bureau. (2026, April 30). UPI completes 10 glorious years, emerges as world’s largest real-time payment system by transaction volume. Government of India.
- U.S. Census Bureau. (2026, May 18). Quarterly retail e-commerce sales report: First quarter 2026. U.S. Department of Commerce.
- WSO2. (2025, November 4). WSO2 API Manager November 2025 release: Powering agentic applications through APIs. WSO2.
This Report Addresses
- The report provides strategic intelligence on API marketplace software and cloud deployment choices that shape commercial distribution and enterprise discovery programs.
- Segment analysis identifies Cloud and SMEs as the two leading segments within the 2026 market structure.
- Regional outlook evaluates India and China alongside Australia while the United Kingdom and United States complete the country comparison.
- Competitive analysis profiles Nokia and Postman alongside MuleSoft and IBM while WSO2 and Gravitee join APILayer in the provider set.
- Component assessment covers Software and Services alongside API Tools and API Connectors used across marketplace publication and consumption workflows.
- Application assessment covers Workflow Automation and Analytics alongside Governance and Integration needs across enterprise API programs.
What does the API Marketplace Market cover?
Software, Services, API Tools and API Connectors used for discovering and consuming reusable interfaces.
The API Marketplace Market covers platforms and supporting services that let publishers list reusable interfaces while consumers discover and subscribe to them. Coverage includes public and private catalogs where access terms and documentation are organized around repeatable API consumption.
The market differs from general API management because commercial scope requires a discovery or exchange layer that connects publishers with consumers. Gateway products remain outside the boundary when they only secure runtime traffic without catalog publication or subscription workflows. General cloud marketplaces are included only when APIs are sold or distributed as named service products.
What is included in the scope?
API marketplace systems used across enterprise integration and external developer distribution environments.
The scope includes Software and Services alongside API Tools and API Connectors used across publication and consumption workflows. It covers Cloud and On-premise deployments as well as Hybrid environments used by SMEs and large enterprises. Public sector buyers are included when they operate catalog or exchange functions for reusable interfaces. Workflow Automation and Analytics applications sit beside Governance and Integration use cases across enterprise service operations. BFSI and Retail are covered alongside Manufacturing and IT providers that consume or distribute reusable interfaces. Government programs are also included when service access depends on governed API discovery across agencies and public platforms. Adjacent data as a service research informs data-product exchange patterns across commercial and enterprise delivery models. Coverage of cloud orchestration platforms provides deployment context while integration and orchestration middleware supports interpretation of downstream workflow use.
What is excluded from the scope?
Standalone API gateways and general cloud catalogs without API exchange functions are outside the scope.
The scope excludes gateway products used only for traffic control and security when no marketplace or catalog exchange function is present. Developer portals tied to a single provider are excluded unless they support reusable subscription workflows across several API products or partner publishers. General application stores and data brokers are outside the boundary when the purchased object is not an API-based service.
How was the analysis built?
130+ sources, 45+ company portfolios, 30+ countries, 25+ interviews.
- Primary Research
- Primary research includes interviews with API product managers, platform engineering leaders, integration architects and procurement heads. It also covers input from developer relations teams, API publishers, enterprise technology buyers, security specialists and cloud platform stakeholders involved in commercial API marketplace ecosystems.
- Desk Research
- Desk research reviews official digital economy statistics, cloud adoption indicators, API management developments, developer portal resources and provider product portfolios. Company announcements, API marketplace catalogs, pricing models, platform documentation and technology publications are also assessed to evaluate market trends and competitive positioning.
- Market-Sizing and Forecasting
- Forecasting uses API publication activity, cloud adoption trends, enterprise integration demand, subscription-based monetization models, marketplace participation rates and platform investment patterns across major countries. Analysis also considers developer ecosystem growth, API consumption trends, digital transformation initiatives and commercialization of enterprise integration services.
- Data Validation and Update Cycle
- Forecasts are validated through provider checks and industry interviews that test assumptions on API demand, platform adoption and marketplace participation. Portfolio mapping, developer ecosystem assessment and stakeholder feedback help confirm market direction, while ongoing reviews of product launches, pricing developments and cloud platform investments support forecast updates.
Segmentation
What is the report’s scope and coverage?
| Attribute | Details |
|---|---|
| Quantitative Units | USD Billion |
| Market Definition | Platforms and supporting services that let API publishers list reusable interfaces while consumers discover, subscribe to and consume them through governed public or private catalogs |
| Component | Software; Services; API Tools; API Connectors |
| Deployment | Cloud; On-premise; Hybrid |
| Organization Size | SMEs; Large Enterprises; Public Sector Buyers |
| Application | Workflow Automation; Analytics; Governance; Integration |
| End Use | BFSI; Retail; Manufacturing; IT Providers; Government |
| Regions Covered | North America; Europe; Asia Pacific; Latin America; Middle East & Africa |
| Countries Covered | India; China; Australia; United Kingdom; United States |
| Key Companies Profiled | Nokia; Postman; MuleSoft; IBM; WSO2; Gravitee; APILayer |
| Forecast Period | 2026 to 2036 |
| Approach | Hybrid top-down and bottom-up approach using API publication activity; cloud adoption trends; enterprise integration demand; subscription monetization models; marketplace participation rates; developer ecosystem growth; API consumption trends; platform investment and supplier validation |
Source: Fact.MR analysis. Updated Jul 8, 2026
How is the market segmented?
-
By Component
- Software
- Services
- API Tools
- API Connectors
-
By Deployment
- Cloud
- On-premise
- Hybrid
-
By Organization Size
- SMEs
- Large Enterprises
- Public Sector Buyers
-
By Application
- Workflow Automation
- Analytics
- Governance
- Integration
-
By End Use
- BFSI
- Retail
- Manufacturing
- IT Providers
- Government
-
By Region
- North America
- United States
- Canada
- Europe
- Germany
- United Kingdom
- France
- Italy
- Spain
- Asia Pacific
- India
- China
- Japan
- South Korea
- Australia
- Latin America
- Brazil
- Argentina
- Mexico
- Chile
- Middle East & Africa
- UAE
- Saudi Arabia
- South Africa
- North America
Frequently Asked Questions
What share is Software estimated to account for in 2026?
What share is Cloud projected to hold in 2026?
What market share are SMEs forecast to record in 2026?
What share is Workflow Automation anticipated to hold?
How much share is BFSI expected to capture in 2026?
Which country is projected to grow fastest?
What CAGR is China anticipated to post?
What CAGR is projected for Australia?
What growth rate is forecast for the United Kingdom?
How fast is the United States expected to grow?
What factor is estimated to drive market expansion?
What restraint is projected to limit broader adoption?
Who worked on this report


Preview the report firsthand - request a free sample
Free SampleGet the brochure for pricing and purchase details
Download PDF