Automotive Switches Market
Automotive Switches Market Analysis, By Vehicle, By Switch, By Sales Channel, and Region - Market Insights 2025 to 2035
Analysis Of Automotive Switches Market Covering 30+ Countries Including Analysis Of Us, Canada, Uk, Germany, France, Nordics, Gcc Countries, Japan, Korea And Many More
Automotive Switches Market Outlook (2025 to 2035)
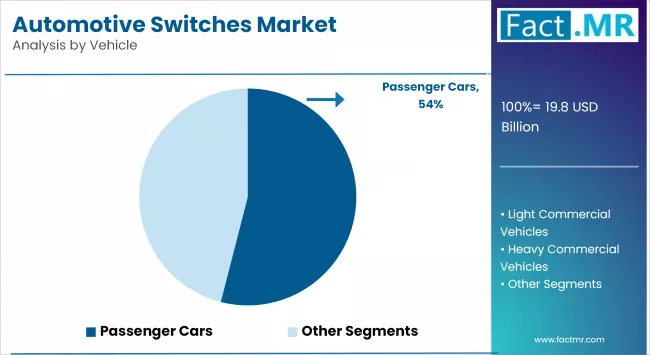
The global automotive switches market is projected to increase from USD 19.8 billion in 2025 to USD 38.2 billion by 2035, with a CAGR of 6.8% during the forecast period. Growth is driven by rising vehicle production, demand for advanced driver assistance systems (ADAS), and consumer preference for improved in-vehicle experience.
Integrated smart touch and haptic switches are emerging trends that, along with the growth of connected car ecosystems and electric vehicles, are creating significant new opportunities in the automotive switches market.
Quick Facts about Automotive Switches Market
- Industry Value (2025): USD 19.8 Billion
- Projected Value (2035): USD 38.2 Billion
- Forecast CAGR (2025 to 2035): 6.8%
- Leading Segment (2025): Automotive Interior Control Switches (64% Market Share)
- Country Growth Rate (2025 to 2035): Germany (8% CAGR)
- Top Key Players: Tokai Rika Co, Ltd., LS Automotive Technologies, Hella KGaA Hueck & Co., Panasonic Corporation, and Robert Bosch GmbH
What are the Drivers of Automotive Switches Market?
The global adoption of electric vehicles is expected to drive the growth of the automotive switch market. An electric vehicle runs on electricity rather than gasoline, diesel, or other fuel. Electric vehicles use electrical current to move. These vehicles have low operating costs because they have few moving parts that require maintenance and are also very environmentally friendly.
According to a report published in January 2024 by Kelley Blue Book, a U.S.-based Cox Automotive company, in 2023, a record 1.2 million car buyers in the U.S. chose electric vehicles, accounting for 7.6% of the total U.S. vehicle market, up from 5.9% in 2022.
Increased commercial vehicle sales are expected to drive the automotive switch market. The term "commercial vehicle" refers to any motorized vehicle used to transport goods or carry fare-paying passengers. Automotive switches are widely used in commercial vehicles for a variety of purposes that improve safety, convenience, and overall vehicle operation.
For instance, in January 2023, Daimler Truck Holding AG, a German commercial vehicle manufacturer, reported that vehicle deliveries increased by 14.2% in 2022, reaching 520,291 units, up from 455,445 in 2021.
Advancements in vehicle safety features are increasing demand for automobile switches. According to the National Highway Traffic Safety Administration (NHTSA), the percentage of new vehicles equipped with front collision warning systems has increased from 0% in 2000 to 63.3% in 2021. The push for advanced driver assistance systems (ADAS) is raising the demand for sophisticated switches and controls.
What are the Regional Trends of Automotive Switches Market?
North America has a significant market share and is expected to grow at a significant CAGR over the forecast period, driven by rapid adoption of innovative technologies. In addition, rising consumer willingness to adopt various functional switches is expected to propel market growth.
Europe is expected to grow steadily throughout the forecast period. Automotive companies in the region are focusing on integrating automotive switches with modern vehicle architecture to provide consumers and passengers with an improved vehicle travel and driving experience.
The Asia Pacific region is attributed to the rapid development of Asian automotive markets in terms of offering modern vehicle designs and various cabin comfort features by automakers in leading markets such as India, China, and Southeast Asia.
The rest of the world had a small share and is expected to grow at a consistent CAGR over the forecast period. The market is expected to grow significantly in terms of vehicle sales as more developing nations in Africa, Latin America, and the Middle East strive for economic stability. Furthermore, the expansion of manufacturing units on the African continent is expected to fuel market growth.
What are the Challenges and Restraining Factors of Automotive Switches Market?
The automotive switches market faces a number of challenges and constraints, primarily due to rapid technological advancements and cost pressures. As vehicles become more digitally integrated, traditional mechanical switches are being replaced by sophisticated electronic control units. This shift necessitates significant R&D investments from manufacturers to keep up with evolving designs and integration with advanced vehicle electronics, raising production costs and potentially reducing profit margins for smaller players.
Supply chain disruptions, particularly those in semiconductor availability, have had a direct impact on switch production. The global chip shortage, which began in 2020 and has persisted into recent years, has limited the supply of electronic components, including those required for advanced automotive switches.
Strict safety and environmental regulations in major markets such as Europe and North America make compliance difficult. Switches must meet durability, electromagnetic compatibility, and fire resistance requirements, which increases design complexity and certification costs. This is especially difficult for aftermarket manufacturers competing against OEM-grade standards.
In addition, the growing trend toward voice recognition and gesture-based controls in premium vehicles is reducing the number of physical switches, which may hinder market growth in the long run. While these innovations improve the driving experience, they gradually shift demand away from traditional switch-based interfaces.
Country-Wise Outlook
U.K. Automotive Switches Market sees Growth Driven by Strong Automotive Engineering Base
The automotive switches market in the U.K. is shaped by the country's strong automotive engineering base and the growing push for vehicle electrification. As the country prepares to phase out the sale of new gasoline and diesel vehicles by 2035, there is a significant increase in electric vehicle (EV) manufacturing, which fuels demand for high-quality electronic and tactile switches. These switches are critical for managing a growing number of EV functions, including battery controls and touch-sensitive infotainment systems.
Technological innovation is a notable trend in the U.K., where automakers and component suppliers are adopting advanced HMI (Human-Machine Interface) systems. Capacitive touch and haptic feedback switches are becoming increasingly popular in premium vehicle segments. For example, Jaguar Land Rover has replaced traditional buttons with multi-functional capacitive switches in its latest EV models, resulting in cleaner interior designs and more intuitive user experiences.
On the regulatory front, the U.K.'s adoption of UNECE automotive safety and environmental standards following Brexit ensures that switch manufacturers continue to adhere to stringent compliance standards. These include ISO 26262, which addresses functional safety in electrical systems and has a direct impact on switch design and integration.
Germany Hub of Advanced Automotive Switch Innovation and OEM Demand
Germany is a major player in the global automotive switches market, with some of the world's largest automakers and Tier 1 suppliers headquartered there. The country's established automotive manufacturing ecosystem generates ongoing demand for high-precision, technologically advanced switch components in both traditional and electric vehicles. Companies such as BMW, Mercedes-Benz, and Volkswagen are constantly improving vehicle electronics, including the use of multifunctional switches for driver assistance, infotainment, and lighting systems.
Digitization and vehicle connectivity are two technological trends that are shaping switch design and functionality. German automakers are increasingly using capacitive, touch-sensitive, and haptic feedback switches to support sleek interior design and lower mechanical failure rates. The increasing integration of advanced HMI (Human-Machine Interface) systems into premium and mid-range vehicles increases the need for smart switch solutions.
Germany follows stringent EU automotive safety and environmental regulations, such as the General Safety Regulation (GSR) and the Euro NCAP protocols. These regulations encourage automakers and component manufacturers to create switches that are not only long-lasting and safe, but also promote energy efficiency and reduce emissions.
Canada Automotive Switch Demand Driven by Strong Manufacturing and EV Transition
The Canada automotive switches market is influenced by its large vehicle production base, proximity to the U.S. market, and government-driven shift toward electrification. Ontario, in particular, is Canada's automotive manufacturing hub, accounting for nearly 90% of total vehicle production. This has resulted in consistent demand for a variety of automotive components, including switches used in lighting, infotainment, and powertrain applications.
The national push to adopt electric vehicles (EVs) is a key driver in the Canadian market. The Canadian government has set ambitious goals to phase out new gas-powered vehicle sales by 2035, including the Zero Emission Vehicle (ZEV) program and iZEV purchase incentives. This transition increases demand for EV-specific switches, such as battery controls, regenerative braking, and digital dashboards.
Technological trends also influence the market. Automakers in Canada are incorporating more digital and multifunction switches to meet consumer demand for touchscreens, voice-activated systems, and smart interiors. The harsh Canadian climate necessitates durable and weather-resistant switch designs, especially for HVAC and seat heating controls.
Category-wise Analysis
Heavy Commercial to Exhibit Leading by Vehicle
Heavy commercial vehicles dominate the automotive switches market, due to their frequent use and harsh operating conditions. The demand for automotive switches in heavy commercial vehicles is driven by the desire for increased safety and efficiency. The integration of advanced technologies such as fleet management systems and telematics is driving up demand for sophisticated switch systems in this segment. Furthermore, strict regulations governing vehicle safety and emissions are propelling the market.
Electric vehicles are the fastest-growing segment of the automotive switches market. The need to reduce greenhouse gas emissions and reliance on fossil fuels is driving the transition to electric mobility. Electric vehicles require specialized switch systems to manage their distinct powertrain and electronic systems. The increasing adoption of electric vehicles, aided by government incentives and advancements in battery technology, is driving up demand for automotive switches in this segment.
Automotive Interior Control to Exhibit Leading by Switch
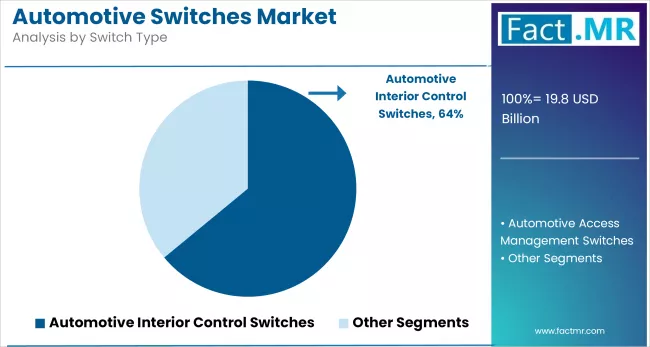
The automotive interior control market is expected to be led by switches due to their critical role in vehicle functionality and user interaction. The automotive interior control switches segment includes switches used to control functions such as air conditioning, lighting, seat adjustments, and infotainment systems. As modern vehicles prioritize user comfort and convenience, the demand for tactile, backlit, and touch-sensitive interior switches rises. Digital interfaces and multifunction switches are replacing traditional buttons in electric and premium vehicles, providing a better user experience and system integration.
Automotive access management switches are the fastest-growing segment, as these are essential for features such as keyless entry, power windows, central locking, and mirror adjustments. The proliferation of smart access technologies and vehicle security systems is driving growth in this segment.
Touch-based door sensors, push-button start systems, and proximity key switches are becoming commonplace in mid-range and high-end vehicles, reflecting consumer demand for easy and secure vehicle access.
OEM Segment Leads Automotive Switches Market Growtho Exhibit Leading by Sales Channel
The OEM sales channel dominates the automotive switches market, owing to the high demand for automotive switches from vehicle manufacturers. To ensure that their vehicles perform and are safe, OEMs require high-quality and reliable switches. Automotive switches are in high demand in the OEM segment due to increased vehicle production and continuous advancements in automotive technology.
The aftermarket segment is the fastest-growing in the automotive switches market due to the growing number of vehicles on the road, combined with an increased emphasis on vehicle maintenance and customization. The aftermarket segment provides a diverse range of automotive switches that cater to the needs and preferences of vehicle owners. The availability of advanced and high-quality aftermarket switches is driving up demand in this segment.
Competitive Analysis
The global automotive switches market is becoming increasingly competitive, driven by technological advancements, shifting consumer preferences, and changing vehicle architectures. Switches are essential components of vehicle control systems, with applications ranging from ignition, lighting, and power windows to advanced driver assistance and infotainment. As the industry transitions to electrification and digitalization, manufacturers are transforming traditional mechanical switches into smarter, more integrated electronic interfaces.
Competitive pressure is increasing as automakers demand compact, multi-functional switches that support vehicle connectivity and user customization. This has prompted suppliers to concentrate on creating switch modules that are long-lasting, cost-effective, and compatible with CAN (Controller Area Network) systems. Furthermore, the trend toward minimalist interiors in modern vehicles, particularly electric and luxury models, is driving the use of touch-sensitive, haptic, and capacitive switches to replace mechanical buttons.
The market is also seeing an increase in strategic collaborations between OEMs and switch suppliers to co-develop custom interfaces for EV dashboards and smart cockpits. Automotive switch manufacturers are increasingly bundling their products with software-based control systems, allowing for seamless integration with digital clusters, ADAS, and IoT capabilities.
Tokai Rika Co, Ltd., LS Automotive Technologies, Hella KGaA Hueck & Co., Panasonic Corporation, Robert Bosch GmbH, TE Connectivity, Honeywell International, ZF Friedrichshafen AG, Omron Corporation, Leopold Kostal GmbH & Co. KG, Toyodenso Co., Ltd., Industrial Engineering Syndicate (INENSY), and Aptiv PLC.
Recent Development
- In October 2024, NXP Semiconductors introduced the new S32J family of high-performance Ethernet switches and network controllers. The S32J family combines a common switch core, NXP NETC, with NXP's most recent S32 microcontrollers and processors, allowing them to function as one expanded virtual switch.
- In February, 2024, ZF Friedrichshafen AG, a global technology company and supplier of advanced mobility products, expanded its manufacturing operations in India by opening a new facility in Oragadam, Chennai.
Segmentation of Automotive Switches Market
-
By Vehicle :
- Passenger Cars
- Light Commercial Vehicles
- Heavy Commercial Vehicles
- Tractors
- Forklifts
- Two Wheelers
- Electric Vehicles
-
By Switch :
- Automotive Interior Control Switches
- AC Switch Assembly
- Light Modules/Switches
- Multifunctional Switches
- Overhead Console Switches
- Multimedia Switch Assemblies
- Steering Switch Assemblies
- Seat Control Switches
- Seat Heater Switches
- Automotive Access Management Switches
- Power Window Switch Assemblies
- Side Window Switches
- Door Light Switches
- Ignition Switches
- Powerlift Gate Switches
- Sun Roof Switches
- Back Carrier Switches
- Automotive Powertrains
- Reverse Light Switches
- Brake Light Switches
- Automatic Gear Control Switches
- Automatic Reverse Parking Brake Switches
- Hand Brake Switches
- Fork Lifting Switch Modules
- Automotive Interior Control Switches
-
By Sales Channel :
- OEMs
- Aftermarket
-
By Region :
- North America
- Latin America
- Western Europe
- Eastern Europe
- East Asia
- South Asia & Pacific
- Middle East & Africa
Table of Content
- Executive Summary
- Global Market Outlook
- Demand-side Trends
- Supply-side Trends
- Technology Roadmap Analysis
- Analysis and Recommendations
- Market Overview
- Market Coverage / Taxonomy
- Market Definition / Scope / Limitations
- Market Background
- Market Dynamics
- Drivers
- Restraints
- Opportunity
- Trends
- Scenario Forecast
- Demand in Optimistic Scenario
- Demand in Likely Scenario
- Demand in Conservative Scenario
- Opportunity Map Analysis
- Product Life Cycle Analysis
- Supply Chain Analysis
- Supply Side Participants and their Roles
- Producers
- Mid-Level Participants (Traders/ Agents/ Brokers)
- Wholesalers and Distributors
- Value Added and Value Created at Node in the Supply Chain
- List of Component Suppliers
- List of Existing and Potential Buyers
- Supply Side Participants and their Roles
- Investment Feasibility Matrix
- Value Chain Analysis
- Profit Margin Analysis
- Wholesalers and Distributors
- Retailers
- PESTLE and Porter’s Analysis
- Regulatory Landscape
- By Key Regions
- By Key Countries
- Production and Consumption Statistics
- Import and Export Statistics
- Market Dynamics
- Global Market Analysis 2020-2024 and Forecast, 2025-2035
- Historical Market Size Value (USD Bn) & Volume (Units) Analysis, 2020-2024
- Current and Future Market Size Value (USD Bn) & Volume (Units) Projections, 2025-2035
- Y-o-Y Growth Trend Analysis
- Absolute $ Opportunity Analysis
- Global Market Pricing Analysis 2020-2024 and Forecast 2025-2035
- Global Market Analysis 2020-2024 and Forecast 2025-2035, By Vehicle
- Introduction / Key Findings
- Historical Market Size Value (USD Bn) & Volume (Units) Analysis By Vehicle, 2020-2024
- Current and Future Market Size Value (USD Bn) & Volume (Units) Analysis and Forecast By Vehicle, 2025-2035
- Passenger Cars
- Light Commercial Vehicles
- Heavy Commercial Vehicles
- Tractors
- Forklifts
- Two Wheelers
- Electric Vehicles
- Y-o-Y Growth Trend Analysis By Vehicle, 2020-2024
- Absolute $ Opportunity Analysis By Vehicle, 2025-2035
- Global Market Analysis 2020-2024 and Forecast 2025-2035, By Switch
- Introduction / Key Findings
- Historical Market Size Value (USD Bn) & Volume (Units) Analysis By Switch, 2020-2024
- Current and Future Market Size Value (USD Bn) & Volume (Units) Analysis and Forecast By Switch, 2025-2035
- Automotive Interior Control Switches
- Automotive Access Management Switches
- Automotive Powertrains
- Y-o-Y Growth Trend Analysis By Switch, 2020-2024
- Absolute $ Opportunity Analysis By Switch, 2025-2035
- Global Market Analysis 2020-2024 and Forecast 2025-2035, By Sales Channel
- Introduction / Key Findings
- Historical Market Size Value (USD Bn) & Volume (Units) Analysis By Sales Channel, 2020-2024
- Current and Future Market Size Value (USD Bn) & Volume (Units) Analysis and Forecast By Sales Channel, 2025-2035
- OEMs
- Aftermarket
- Y-o-Y Growth Trend Analysis By Sales Channel, 2020-2024
- Absolute $ Opportunity Analysis By Sales Channel, 2025-2035
- Global Market Analysis 2020-2024 and Forecast 2025-2035, By Region
- Introduction
- Historical Market Size Value (USD Bn) & Volume (Units) Analysis By Region, 2020-2024
- Current Market Size Value (USD Bn) & Volume (Units) Analysis and Forecast By Region, 2025-2035
- North America
- Latin America
- Western Europe
- East Asia
- South Asia Pacific
- Eastern Europe
- Middle East & Africa
- Market Attractiveness Analysis By Region
- North America Market Analysis 2020-2024 and Forecast 2025-2035, By Country
- Historical Market Size Value (USD Bn) & Volume (Units) Trend Analysis By Market Taxonomy, 2020-2024
- Market Size Value (USD Bn) & Volume (Units) Forecast By Market Taxonomy, 2025-2035
- By Country
- U.S.
- Canada
- Mexico
- By Vehicle
- By Switch
- By Sales Channel
- By Country
- Market Attractiveness Analysis
- By Country
- By Vehicle
- By Switch
- By Sales Channel
- Key Takeaways
- Latin America Market Analysis 2020-2024 and Forecast 2025-2035, By Country
- Historical Market Size Value (USD Bn) & Volume (Units) Trend Analysis By Market Taxonomy, 2020-2024
- Market Size Value (USD Bn) & Volume (Units) Forecast By Market Taxonomy, 2025-2035
- By Country
- Brazil
- Chile
- Rest of Latin America
- By Vehicle
- By Switch
- By Sales Channel
- By Country
- Market Attractiveness Analysis
- By Country
- By Vehicle
- By Switch
- By Sales Channel
- Key Takeaways
- Western Europe Market Analysis 2020-2024 and Forecast 2025-2035, By Country
- Historical Market Size Value (USD Bn) & Volume (Units) Trend Analysis By Market Taxonomy, 2020-2024
- Market Size Value (USD Bn) & Volume (Units) Forecast By Market Taxonomy, 2025-2035
- By Country
- Germany
- Italy
- France
- U.K.
- Spain
- Russia
- BENELUX
- Rest of Europe
- By Vehicle
- By Switch
- By Sales Channel
- By Country
- Market Attractiveness Analysis
- By Country
- By Vehicle
- By Switch
- By Sales Channel
- Key Takeaways
- East Asia Market Analysis 2020-2024 and Forecast 2025-2035, By Country
- Historical Market Size Value (USD Bn) & Volume (Units) Trend Analysis By Market Taxonomy, 2020-2024
- Market Size Value (USD Bn) & Volume (Units) Forecast By Market Taxonomy, 2025-2035
- By Country
- China
- Japan
- South Korea
- By Vehicle
- By Switch
- By Sales Channel
- By Country
- Market Attractiveness Analysis
- By Country
- By Vehicle
- By Switch
- By Sales Channel
- Key Takeaways
- South Asia Pacific Market Analysis 2020-2024 and Forecast 2025-2035, By Country
- Historical Market Size Value (USD Bn) & Volume (Units) Trend Analysis By Market Taxonomy, 2020-2024
- Market Size Value (USD Bn) & Volume (Units) Forecast By Market Taxonomy, 2025-2035
- By Country
- India
- ASEAN Countries
- Australia & New Zealand
- Rest of South Asia Pacific
- By Vehicle
- By Switch
- By Sales Channel
- By Country
- Market Attractiveness Analysis
- By Country
- By Vehicle
- By Switch
- By Sales Channel
- Key Takeaways
- Eastern Europe Market Analysis 2020-2024 and Forecast 2025-2035, By Country
- Historical Market Size Value (USD Bn) & Volume (Units) Trend Analysis By Market Taxonomy, 2020-2024
- Market Size Value (USD Bn) & Volume (Units) Forecast By Market Taxonomy, 2025-2035
- By Country
- Russia
- Poland
- Hungary
- Balkan & Baltics
- Rest of Eastern Europe
- By Vehicle
- By Switch
- By Sales Channel
- By Country
- Market Attractiveness Analysis
- By Country
- By Vehicle
- By Switch
- By Sales Channel
- Key Takeaways
- Middle East & Africa Market Analysis 2020-2024 and Forecast 2025-2035, By Country
- Historical Market Size Value (USD Bn) & Volume (Units) Trend Analysis By Market Taxonomy, 2020-2024
- Market Size Value (USD Bn) & Volume (Units) Forecast By Market Taxonomy, 2025-2035
- By Country
- KSA
- Other GCC Countries
- Turkiye
- South Africa
- Rest of MEA
- By Vehicle
- By Switch
- By Sales Channel
- By Country
- Market Attractiveness Analysis
- By Country
- By Vehicle
- By Switch
- By Sales Channel
- Key Takeaways
- Key Countries Market Analysis
- U.S.
- Pricing Analysis
- Market Share Analysis, 2024
- By Vehicle
- By Switch
- By Sales Channel
- Germany
- Pricing Analysis
- Market Share Analysis, 2024
- By Vehicle
- By Switch
- By Sales Channel
- China
- Pricing Analysis
- Market Share Analysis, 2024
- By Vehicle
- By Switch
- By Sales Channel
- Japan
- Pricing Analysis
- Market Share Analysis, 2024
- By Vehicle
- By Switch
- By Sales Channel
- India
- Pricing Analysis
- Market Share Analysis, 2024
- By Vehicle
- By Switch
- By Sales Channel
- U.S.
- Market Structure Analysis
- Competition Dashboard
- Competition Benchmarking
- Market Share Analysis of Top Players
- By Regional
- By Vehicle
- By Switch
- By Sales Channel
- Competition Analysis
- Competition Deep Dive
- Tokai Rika Co, Ltd.
- Overview
- Product Portfolio
- Profitability by Market Segments (Product/Age /Sales Channel/Region)
- Sales Footprint
- Strategy Overview
- Marketing Strategy
- Product Strategy
- Channel Strategy
- LS Automotive Technologies
- Overview
- Product Portfolio
- Profitability by Market Segments (Product/Age /Sales Channel/Region)
- Sales Footprint
- Strategy Overview
- Marketing Strategy
- Product Strategy
- Channel Strategy
- Hella KGaA Hueck & Co.
- Overview
- Product Portfolio
- Profitability by Market Segments (Product/Age /Sales Channel/Region)
- Sales Footprint
- Strategy Overview
- Marketing Strategy
- Product Strategy
- Channel Strategy
- Panasonic Corporation
- Overview
- Product Portfolio
- Profitability by Market Segments (Product/Age /Sales Channel/Region)
- Sales Footprint
- Strategy Overview
- Marketing Strategy
- Product Strategy
- Channel Strategy
- Robert Bosch GmbH
- Overview
- Product Portfolio
- Profitability by Market Segments (Product/Age /Sales Channel/Region)
- Sales Footprint
- Strategy Overview
- Marketing Strategy
- Product Strategy
- Channel Strategy
- TE Connectivity
- Overview
- Product Portfolio
- Profitability by Market Segments (Product/Age /Sales Channel/Region)
- Sales Footprint
- Strategy Overview
- Marketing Strategy
- Product Strategy
- Channel Strategy
- Honeywell International
- Overview
- Product Portfolio
- Profitability by Market Segments (Product/Age /Sales Channel/Region)
- Sales Footprint
- Strategy Overview
- Marketing Strategy
- Product Strategy
- Channel Strategy
- ZF Friedrichshafen AG
- Overview
- Product Portfolio
- Profitability by Market Segments (Product/Age /Sales Channel/Region)
- Sales Footprint
- Strategy Overview
- Marketing Strategy
- Product Strategy
- Channel Strategy
- Omron Corporation
- Overview
- Product Portfolio
- Profitability by Market Segments (Product/Age /Sales Channel/Region)
- Sales Footprint
- Strategy Overview
- Marketing Strategy
- Product Strategy
- Channel Strategy
- Leopold Kostal GmbH & Co. KG
- Overview
- Product Portfolio
- Profitability by Market Segments (Product/Age /Sales Channel/Region)
- Sales Footprint
- Strategy Overview
- Marketing Strategy
- Product Strategy
- Channel Strategy
- Toyodenso Co., Ltd.
- Overview
- Product Portfolio
- Profitability by Market Segments (Product/Age /Sales Channel/Region)
- Sales Footprint
- Strategy Overview
- Marketing Strategy
- Product Strategy
- Channel Strategy
- Industrial Engineering Syndicate (INENSY)
- Overview
- Product Portfolio
- Profitability by Market Segments (Product/Age /Sales Channel/Region)
- Sales Footprint
- Strategy Overview
- Marketing Strategy
- Product Strategy
- Channel Strategy
- Aptiv PLC
- Overview
- Product Portfolio
- Profitability by Market Segments (Product/Age /Sales Channel/Region)
- Sales Footprint
- Strategy Overview
- Marketing Strategy
- Product Strategy
- Channel Strategy
- Tokai Rika Co, Ltd.
- Competition Deep Dive
- Assumptions & Acronyms Used
- Research Methodology
List Of Table
- Table 1: Global Market Value (USD Bn) Forecast by Region, 2020 to 2035
- Table 2: Global Market Volume (Units) Forecast by Region, 2020 to 2035
- Table 3: Global Market Value (USD Bn) Forecast by Vehicle, 2020 to 2035
- Table 4: Global Market Volume (Units) Forecast by Vehicle, 2020 to 2035
- Table 5: Global Market Value (USD Bn) Forecast by Switch, 2020 to 2035
- Table 6: Global Market Volume (Units) Forecast by Switch, 2020 to 2035
- Table 7: Global Market Value (USD Bn) Forecast by Sales Channel, 2020 to 2035
- Table 8: Global Market Volume (Units) Forecast by Sales Channel, 2020 to 2035
- Table 9: North America Market Value (USD Bn) Forecast by Country, 2020 to 2035
- Table 10: North America Market Volume (Units) Forecast by Country, 2020 to 2035
- Table 11: North America Market Value (USD Bn) Forecast by Vehicle, 2020 to 2035
- Table 12: North America Market Volume (Units) Forecast by Vehicle, 2020 to 2035
- Table 13: North America Market Value (USD Bn) Forecast by Switch, 2020 to 2035
- Table 14: North America Market Volume (Units) Forecast by Switch, 2020 to 2035
- Table 15: North America Market Value (USD Bn) Forecast by Sales Channel, 2020 to 2035
- Table 16: North America Market Volume (Units) Forecast by Sales Channel, 2020 to 2035
- Table 17: Latin America Market Value (USD Bn) Forecast by Country, 2020 to 2035
- Table 18: Latin America Market Volume (Units) Forecast by Country, 2020 to 2035
- Table 19: Latin America Market Value (USD Bn) Forecast by Vehicle, 2020 to 2035
- Table 20: Latin America Market Volume (Units) Forecast by Vehicle, 2020 to 2035
- Table 21: Latin America Market Value (USD Bn) Forecast by Switch, 2020 to 2035
- Table 22: Latin America Market Volume (Units) Forecast by Switch, 2020 to 2035
- Table 23: Latin America Market Value (USD Bn) Forecast by Sales Channel, 2020 to 2035
- Table 24: Latin America Market Volume (Units) Forecast by Sales Channel, 2020 to 2035
- Table 25: Western Europe Market Value (USD Bn) Forecast by Country, 2020 to 2035
- Table 26: Western Europe Market Volume (Units) Forecast by Country, 2020 to 2035
- Table 27: Western Europe Market Value (USD Bn) Forecast by Vehicle, 2020 to 2035
- Table 28: Western Europe Market Volume (Units) Forecast by Vehicle, 2020 to 2035
- Table 29: Western Europe Market Value (USD Bn) Forecast by Switch, 2020 to 2035
- Table 30: Western Europe Market Volume (Units) Forecast by Switch, 2020 to 2035
- Table 31: Western Europe Market Value (USD Bn) Forecast by Sales Channel, 2020 to 2035
- Table 32: Western Europe Market Volume (Units) Forecast by Sales Channel, 2020 to 2035
- Table 33: East Asia Market Value (USD Bn) Forecast by Country, 2020 to 2035
- Table 34: East Asia Market Volume (Units) Forecast by Country, 2020 to 2035
- Table 35: East Asia Market Value (USD Bn) Forecast by Vehicle, 2020 to 2035
- Table 36: East Asia Market Volume (Units) Forecast by Vehicle, 2020 to 2035
- Table 37: East Asia Market Value (USD Bn) Forecast by Switch, 2020 to 2035
- Table 38: East Asia Market Volume (Units) Forecast by Switch, 2020 to 2035
- Table 39: East Asia Market Value (USD Bn) Forecast by Sales Channel, 2020 to 2035
- Table 40: East Asia Market Volume (Units) Forecast by Sales Channel, 2020 to 2035
- Table 41: South Asia Pacific Market Value (USD Bn) Forecast by Country, 2020 to 2035
- Table 42: South Asia Pacific Market Volume (Units) Forecast by Country, 2020 to 2035
- Table 43: South Asia Pacific Market Value (USD Bn) Forecast by Vehicle, 2020 to 2035
- Table 44: South Asia Pacific Market Volume (Units) Forecast by Vehicle, 2020 to 2035
- Table 45: South Asia Pacific Market Value (USD Bn) Forecast by Switch, 2020 to 2035
- Table 46: South Asia Pacific Market Volume (Units) Forecast by Switch, 2020 to 2035
- Table 47: South Asia Pacific Market Value (USD Bn) Forecast by Sales Channel, 2020 to 2035
- Table 48: South Asia Pacific Market Volume (Units) Forecast by Sales Channel, 2020 to 2035
- Table 49: Eastern Europe Market Value (USD Bn) Forecast by Country, 2020 to 2035
- Table 50: Eastern Europe Market Volume (Units) Forecast by Country, 2020 to 2035
- Table 51: Eastern Europe Market Value (USD Bn) Forecast by Vehicle, 2020 to 2035
- Table 52: Eastern Europe Market Volume (Units) Forecast by Vehicle, 2020 to 2035
- Table 53: Eastern Europe Market Value (USD Bn) Forecast by Switch, 2020 to 2035
- Table 54: Eastern Europe Market Volume (Units) Forecast by Switch, 2020 to 2035
- Table 55: Eastern Europe Market Value (USD Bn) Forecast by Sales Channel, 2020 to 2035
- Table 56: Eastern Europe Market Volume (Units) Forecast by Sales Channel, 2020 to 2035
- Table 57: Middle East & Africa Market Value (USD Bn) Forecast by Country, 2020 to 2035
- Table 58: Middle East & Africa Market Volume (Units) Forecast by Country, 2020 to 2035
- Table 59: Middle East & Africa Market Value (USD Bn) Forecast by Vehicle, 2020 to 2035
- Table 60: Middle East & Africa Market Volume (Units) Forecast by Vehicle, 2020 to 2035
- Table 61: Middle East & Africa Market Value (USD Bn) Forecast by Switch, 2020 to 2035
- Table 62: Middle East & Africa Market Volume (Units) Forecast by Switch, 2020 to 2035
- Table 63: Middle East & Africa Market Value (USD Bn) Forecast by Sales Channel, 2020 to 2035
- Table 64: Middle East & Africa Market Volume (Units) Forecast by Sales Channel, 2020 to 2035
List Of Figures
- Figure 1: Global Market Volume (Units) Forecast 2020 to 2035
- Figure 2: Global Market Pricing Analysis
- Figure 3: Global Market Value (USD Bn) Forecast 2020 to 2035
- Figure 4: Global Market Value Share and BPS Analysis by Vehicle, 2025 and 2035
- Figure 5: Global Market Y-o-Y Growth Comparison by Vehicle, 2025 to 2035
- Figure 6: Global Market Attractiveness Analysis by Vehicle
- Figure 7: Global Market Value Share and BPS Analysis by Switch, 2025 and 2035
- Figure 8: Global Market Y-o-Y Growth Comparison by Switch, 2025 to 2035
- Figure 9: Global Market Attractiveness Analysis by Switch
- Figure 10: Global Market Value Share and BPS Analysis by Sales Channel, 2025 and 2035
- Figure 11: Global Market Y-o-Y Growth Comparison by Sales Channel, 2025 to 2035
- Figure 12: Global Market Attractiveness Analysis by Sales Channel
- Figure 13: Global Market Value (USD Bn) Share and BPS Analysis by Region, 2025 and 2035
- Figure 14: Global Market Y-o-Y Growth Comparison by Region, 2025 to 2035
- Figure 15: Global Market Attractiveness Analysis by Region
- Figure 16: North America Market Incremental $ Opportunity, 2025 to 2035
- Figure 17: Latin America Market Incremental $ Opportunity, 2025 to 2035
- Figure 18: Western Europe Market Incremental $ Opportunity, 2025 to 2035
- Figure 19: East Asia Market Incremental $ Opportunity, 2025 to 2035
- Figure 20: South Asia Pacific Market Incremental $ Opportunity, 2025 to 2035
- Figure 21: Eastern Europe Market Incremental $ Opportunity, 2025 to 2035
- Figure 22: Middle East & Africa Market Incremental $ Opportunity, 2025 to 2035
- Figure 23: North America Market Value Share and BPS Analysis by Country, 2025 and 2035
- Figure 24: North America Market Value Share and BPS Analysis by Vehicle, 2025 and 2035
- Figure 25: North America Market Y-o-Y Growth Comparison by Vehicle, 2025 to 2035
- Figure 26: North America Market Attractiveness Analysis by Vehicle
- Figure 27: North America Market Value Share and BPS Analysis by Switch, 2025 and 2035
- Figure 28: North America Market Y-o-Y Growth Comparison by Switch, 2025 to 2035
- Figure 29: North America Market Attractiveness Analysis by Switch
- Figure 30: North America Market Value Share and BPS Analysis by Sales Channel, 2025 and 2035
- Figure 31: North America Market Y-o-Y Growth Comparison by Sales Channel, 2025 to 2035
- Figure 32: North America Market Attractiveness Analysis by Sales Channel
- Figure 33: Latin America Market Value Share and BPS Analysis by Country, 2025 and 2035
- Figure 34: Latin America Market Value Share and BPS Analysis by Vehicle, 2025 and 2035
- Figure 35: Latin America Market Y-o-Y Growth Comparison by Vehicle, 2025 to 2035
- Figure 36: Latin America Market Attractiveness Analysis by Vehicle
- Figure 37: Latin America Market Value Share and BPS Analysis by Switch, 2025 and 2035
- Figure 38: Latin America Market Y-o-Y Growth Comparison by Switch, 2025 to 2035
- Figure 39: Latin America Market Attractiveness Analysis by Switch
- Figure 40: Latin America Market Value Share and BPS Analysis by Sales Channel, 2025 and 2035
- Figure 41: Latin America Market Y-o-Y Growth Comparison by Sales Channel, 2025 to 2035
- Figure 42: Latin America Market Attractiveness Analysis by Sales Channel
- Figure 43: Western Europe Market Value Share and BPS Analysis by Country, 2025 and 2035
- Figure 44: Western Europe Market Value Share and BPS Analysis by Vehicle, 2025 and 2035
- Figure 45: Western Europe Market Y-o-Y Growth Comparison by Vehicle, 2025 to 2035
- Figure 46: Western Europe Market Attractiveness Analysis by Vehicle
- Figure 47: Western Europe Market Value Share and BPS Analysis by Switch, 2025 and 2035
- Figure 48: Western Europe Market Y-o-Y Growth Comparison by Switch, 2025 to 2035
- Figure 49: Western Europe Market Attractiveness Analysis by Switch
- Figure 50: Western Europe Market Value Share and BPS Analysis by Sales Channel, 2025 and 2035
- Figure 51: Western Europe Market Y-o-Y Growth Comparison by Sales Channel, 2025 to 2035
- Figure 52: Western Europe Market Attractiveness Analysis by Sales Channel
- Figure 53: East Asia Market Value Share and BPS Analysis by Country, 2025 and 2035
- Figure 54: East Asia Market Value Share and BPS Analysis by Vehicle, 2025 and 2035
- Figure 55: East Asia Market Y-o-Y Growth Comparison by Vehicle, 2025 to 2035
- Figure 56: East Asia Market Attractiveness Analysis by Vehicle
- Figure 57: East Asia Market Value Share and BPS Analysis by Switch, 2025 and 2035
- Figure 58: East Asia Market Y-o-Y Growth Comparison by Switch, 2025 to 2035
- Figure 59: East Asia Market Attractiveness Analysis by Switch
- Figure 60: East Asia Market Value Share and BPS Analysis by Sales Channel, 2025 and 2035
- Figure 61: East Asia Market Y-o-Y Growth Comparison by Sales Channel, 2025 to 2035
- Figure 62: East Asia Market Attractiveness Analysis by Sales Channel
- Figure 63: South Asia Pacific Market Value Share and BPS Analysis by Country, 2025 and 2035
- Figure 64: South Asia Pacific Market Value Share and BPS Analysis by Vehicle, 2025 and 2035
- Figure 65: South Asia Pacific Market Y-o-Y Growth Comparison by Vehicle, 2025 to 2035
- Figure 66: South Asia Pacific Market Attractiveness Analysis by Vehicle
- Figure 67: South Asia Pacific Market Value Share and BPS Analysis by Switch, 2025 and 2035
- Figure 68: South Asia Pacific Market Y-o-Y Growth Comparison by Switch, 2025 to 2035
- Figure 69: South Asia Pacific Market Attractiveness Analysis by Switch
- Figure 70: South Asia Pacific Market Value Share and BPS Analysis by Sales Channel, 2025 and 2035
- Figure 71: South Asia Pacific Market Y-o-Y Growth Comparison by Sales Channel, 2025 to 2035
- Figure 72: South Asia Pacific Market Attractiveness Analysis by Sales Channel
- Figure 73: Eastern Europe Market Value Share and BPS Analysis by Country, 2025 and 2035
- Figure 74: Eastern Europe Market Value Share and BPS Analysis by Vehicle, 2025 and 2035
- Figure 75: Eastern Europe Market Y-o-Y Growth Comparison by Vehicle, 2025 to 2035
- Figure 76: Eastern Europe Market Attractiveness Analysis by Vehicle
- Figure 77: Eastern Europe Market Value Share and BPS Analysis by Switch, 2025 and 2035
- Figure 78: Eastern Europe Market Y-o-Y Growth Comparison by Switch, 2025 to 2035
- Figure 79: Eastern Europe Market Attractiveness Analysis by Switch
- Figure 80: Eastern Europe Market Value Share and BPS Analysis by Sales Channel, 2025 and 2035
- Figure 81: Eastern Europe Market Y-o-Y Growth Comparison by Sales Channel, 2025 to 2035
- Figure 82: Eastern Europe Market Attractiveness Analysis by Sales Channel
- Figure 83: Middle East & Africa Market Value Share and BPS Analysis by Country, 2025 and 2035
- Figure 84: Middle East & Africa Market Value Share and BPS Analysis by Vehicle, 2025 and 2035
- Figure 85: Middle East & Africa Market Y-o-Y Growth Comparison by Vehicle, 2025 to 2035
- Figure 86: Middle East & Africa Market Attractiveness Analysis by Vehicle
- Figure 87: Middle East & Africa Market Value Share and BPS Analysis by Switch, 2025 and 2035
- Figure 88: Middle East & Africa Market Y-o-Y Growth Comparison by Switch, 2025 to 2035
- Figure 89: Middle East & Africa Market Attractiveness Analysis by Switch
- Figure 90: Middle East & Africa Market Value Share and BPS Analysis by Sales Channel, 2025 and 2035
- Figure 91: Middle East & Africa Market Y-o-Y Growth Comparison by Sales Channel, 2025 to 2035
- Figure 92: Middle East & Africa Market Attractiveness Analysis by Sales Channel
- Figure 93: Global Market - Tier Structure Analysis
- Figure 94: Global Market - Company Share Analysis
- FAQs -
What is the Global Automotive Switches Market size in 2025?
The automotive switches market is valued at USD 19.8 billion in 2025.
Who are the Major Players Operating in the Automotive Switches Market?
Prominent players in the market include Tokai Rika Co, Ltd., LS Automotive Technologies, Hella KGaA Hueck & Co., Panasonic Corporation, and Robert Bosch GmbH.
What is the Estimated Valuation of the Automotive Switches Market by 2035?
The market is expected to reach a valuation of USD 38.2 billion by 2035.
What Value CAGR is the Automotive Switches Market Exhibit over the Last Five Years?
The historic growth rate of the automotive switches market is 6.1% from 2020-2024.