


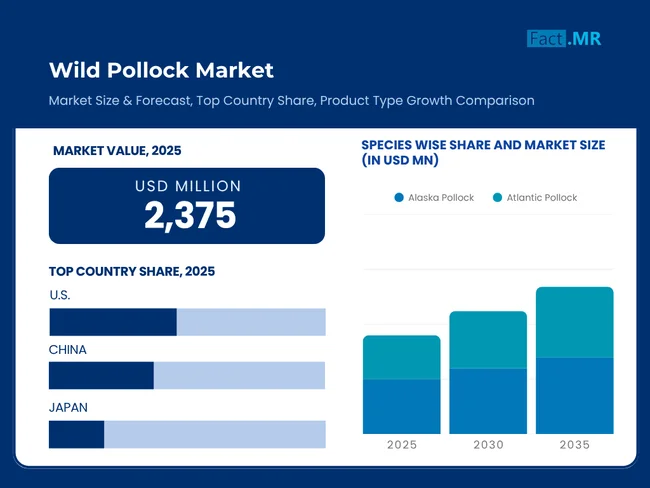
- Base Value(2025): 2375 Mn
- Estimated Value(2026): 2522.4 Mn
- Forecast Value (2035): 4227.9 Mn
- CAGR (2026 - 2035): 5.3%
Wild Pollock Market Outlook (2025 to 2035)
The global wild pollock market is expected to reach USD 3,981 million by 2035, up from USD 2,275 million in 2024. During the forecast period (2025-2035), the industry is projected to register a CAGR of 5.3%, driven by the growing trend among consumers toward healthier diets that include lean proteins and foods rich in omega-3 fatty acids.
These encourage the consumption of wild pollock by these consumers who are concerned with their health. The increased production of surimi across Asia, along with its growing use in the fast food and frozen meal segments, is driving global wild pollock market growth.
What are the drivers of wild pollock market?
Health awareness is on the rise among consumers, and demand for wild pollock is increasing due to its lean protein content. The low-fat, high-protein nature, rich in omega-3 fatty acids, appeals to the seafood-consumer set with heart-healthy diets. Another selling point is sustainability when certified by fisheries with an MSC label.
Wild pollock catches are also supported by the growing demand for surimi from Asia. In fast-food and food service restaurants worldwide, wild pollock is a staple ingredient in many menu items, including fish sandwiches and seafood sticks, which have served as catalysts for growth in this category. Convenient, frozen, and ready-to-cook formats are well-suited to the consumption habits of modern consumers, particularly in North America and Europe.
What are the regional trends of wild pollock market?
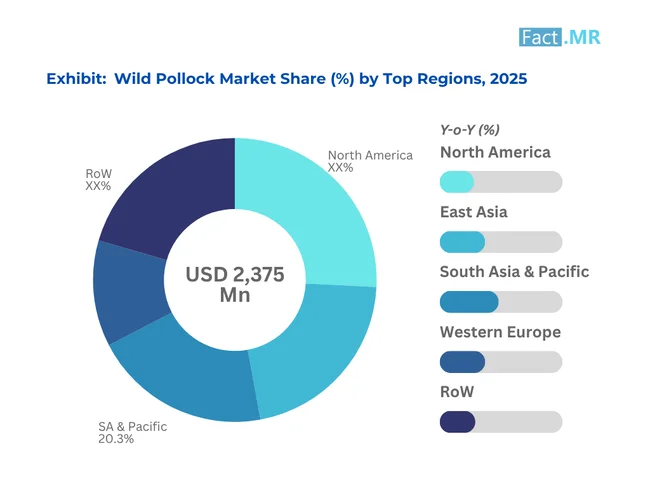
North America, particularly the United States, remains a dominant player due to its well-regulated fisheries, including those for Alaskan pollock, and export operations to Europe and Asia. The United States supplies a significant portion of surimi-grade pollock, which is widely used in Japan and South Korea for seafood snacks and processed products.
In Europe, there is a growing demand for wild pollock in various forms, including frozen fillets and breaded products, for the retail and institutional catering segments. The regions also import significant quantities for use in private-label products in Germany, France, and the U.K.
The Asia Pacific is the primary market for surimi and is continually expanding its processing facilities. Japan, China and Thailand are primary consuming and re-exporting nations. Sustainability regulations and eco-labeling are influencing purchasing decisions in these areas, and traceability is emerging as a trend in the region.
What are the challenges and restraining factors of wild pollock market?
Central to the issue challenging the wild pollock market is climate change and warming waters. This has led to the unreliability of fishing yields, which affects seasonal availability worldwide. Everything else in the supply chain, therefore, becomes affected, leading to price instability for both processors and retailers.
Regulatory pressures and catch quotas intended to allow sustainable harvesting will also dent the supply of goods available. Furthermore, consumer concerns about purported overfishing and ecosystem impact, even with supposedly certified products, deter certain demographics.
An additional constraint on the market would be the rising competition from alternative proteins and plant-based seafood substitutes, especially among younger populations. This would also render any shifting global business policies and tariff regulations, particularly across the U.S., China, and the EU, that would put customs into force on the imports and exports of pollock, thereby manipulating market dynamics and pricing.
Country-Wise Outlook
Japan’s culinary demand fuels premium wild pollock imports
Japan is one of the leading consumers and importers of wild pollock, primarily importing high-quality pollock roe (mentaiko and tarako) and surimi products for traditional dishes. Domestic production is limited, with pollock stocks in the Sea of Japan declining; therefore, Japan has maintained close relations with Russia and the U.S. to meet demand.
Freshness, traceability, and food safety significantly influence consumer preferences, leading to the adoption of smart seafood traceability systems combined with blockchain-backed import tracking. Major companies operating in Japan's seafood processing industry, such as Maruha Nichiro and Nippon Suisan, are refining the processing of surimi products, employing enzymatic and low-sodium technology to cater to health-conscious consumers. Japan, with a shrinking population, is also leading to increased investment in R&D for pre-cooked, convenient pollock formats, such as microwavable bento components and protein-rich snacks.
From ocean to table: U.S. leads in traceability and innovation
The majority of wild pollock production comes from the United States, specifically the Alaskan coasts, with its dominance ensured by strict NOAA regulations and scientifically based quota management, as well as public-private collaboration that maximizes the effort.
The mainstream technological advancements primarily include tools powered by AI for reducing bycatch, precision trawl gear, and digital traceability platforms such as Fishery Progress. They help elevate the palettes in the marketplace. American companies, such as Trident Seafoods and American Seafoods, innovate deep-processed pollock products that incorporate protein powders and ready-to-eat meals in response to the rising demand for clean-label seafood.
China transforms imports into high-volume export engines
-2025-to-2035.webp)
The processing and re-export of wild pollock by China, especially from Russia and the U.S., can be considered a leading factor in this direction. However, it is not among the significant countries in terms of harvesting. Cities like Qingdao and Dalian are global hubs for pollock reprocessing, which includes filleting and surimi production, as well as custom packaging for Western brands. Cost-efficient labor, advanced freezing infrastructure, and strategic port access give China its edge.
Government-backed modern cold storage clusters are developing smart logistics systems as they become increasingly compliant with international food safety standards, enabling Chinese facilities to meet the import criteria of the EU and the U.S. Although domestic consumption has been increasing, the primary part of the role that China plays is still that of a global re-exporter under a downstream
Category-Wise Analysis
Alaska pollock emerges as the mainstay species in wild-caught whitefish markets
Mild flavor, abundance, and most importantly, good sustainability credentials, Alaska pollock predominates on the wild pollock market. Primarily harvested from the Bering Sea and North Pacific, this species is certified by programs like MSC, ensuring it is an eco-friendly choice. This versatile fish is well accepted in local and international markets as frozen and processed products. However, fresh alternatives are now gaining popularity in health-conscious markets and among chefs who request traceable seafood.
Fresh Pollock Gains Ground as Consumers Seek Clean-Label, Minimally Processed Seafood
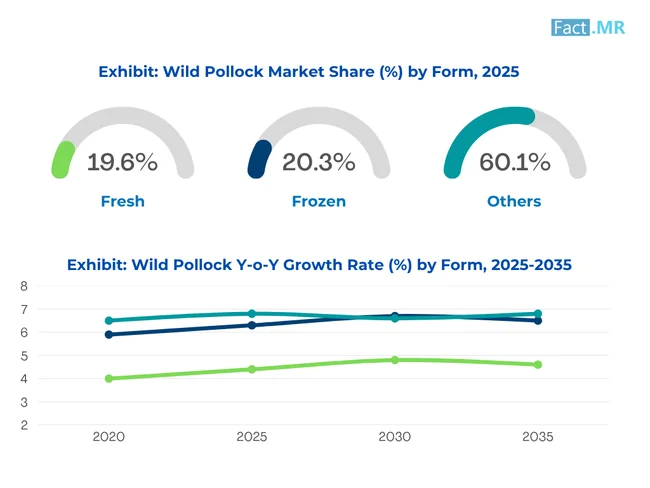
Consumers tend to perceive fresh pollock as superior in flavor and nutrition to its frozen or processed cousins; thus, it is meant for direct culinary use. Its short shelf life, however, means that cold chain logistics are required, typically found in coastal or urban markets with well-organized distribution. Online grocery shopping or premium seafood delivery will soon increase access to fresh wild-caught pollock.
Household Consumption of Fresh Pollock Surges with a Focus on Healthy Home Cooking
Households continue to incorporate pollock into their meals, slowly adopting it into dishes such as fish tacos, baked fillets, and stir-fries, as consumers who prepare their meals cook more at home and explore options for lean proteins. It is considered a healthy choice, as pollock is low in fat and rich in omega-3 fatty acids, making it suitable for families, older individuals, and those following specific diets. Additionally, consumers are encouraged by packaged formats that cater to household and recipe sizes.
Competitive Analysis
The market for wild pollock operates under a relatively stable and consolidative scenario that is gradually shaped by stringent marine sustainability norms in emerging markets and shifting consumer preferences towards eco-friendly proteins. Competition in the industry centers on establishing long-term quotas, creating traceable supply chains, and implementing low-cost, high-volume processing operations. In their competition, companies may provide innovations in product values, such as pollock-based protein snacks, surimi forms, and ready-to-cook fillets, in line with the rising consumption demand in North America, East Asia, and Europe.
Market players are also subject to high competition, where the seasonal catch volume available for sale at the marketplace is a function of government regulations under such bodies as the Marine Stewardship Council (MSC). Competitiveness derived from the costs of technological improvements in freezing, filleting, and logistics will be particularly relevant, especially for suppliers exporting to rapidly growing markets in China and South Korea.
Price trends depend on the overall trend for white fish, currency shifts, and the duties imposed on trade. Wild pollock will always be the cheaper alternative to cod. Still, it comes with the need to continuously manage ecological risks, obtain sustainability certification, and meet consumer expectations for transparency if a market occupant is to reap any long-term advantages.
Key players in the wild pollock industry include Norebo Holding, Russian Fishery Company, Trident Seafoods, Eastern Fish Company, Glacier Fish Company LLC, American Seafoods Group, Ocean Peace, Inc., Aleutian Spray Fisheries, and other notable companies.
Recent Development
- In March 2024, GAPP partnered with Trident Japan to promote Kanikama surimi seafood products made from Wild Alaska Pollock in Costco Japan stores. The campaign emphasizes the quality and sustainability of U.S. Wild Alaska Pollock to Japanese consumers.
- In September 2023, Gorton’s introduced its Air Fried Wild Alaska Pollock Fillets at Sam’s Clubs, offering a healthier alternative with reduced oil content. This innovation caters to health-conscious consumers seeking convenient, nutritious seafood options, aligning with the growing demand for better-for-you frozen meals.
Fact.MR has provided detailed information about the price points of key producers in the wild pollock market, positioned across regions, including sales growth, production capacity, and speculative technological expansion, in the recently published report.
Methodology and Industry Tracking Approach
In 2025, Fact.MR undertook an exhaustive worldwide inquiry into the wild pollock market, involving at least 4,800 validated professional inputs across 20 countries. Respondents came from various domains, including seafood procurement, nutritional supplement manufacturing, cold-chain logistics, and sustainable fisheries management. At least 100 professionals in marine protein innovation, sustainability certification, and functional food product development were extracted from each participating country.
The study, covering the period from June 2024 to May 2025, captured fluctuations in regional catch volumes, the growing adoption of certified sustainable wild-caught sources, and increasing scrutiny over traceability and origin labeling.
Since 2018, Fact.MR has followed the developments in wild-caught seafood markets, comparing yield efficiency, nutritional quality, and environmental impact within supply chains. This research further legitimizes the churning shift toward ethical sourcing, clean-label expectations, and zero-waste packaging.
Segmentation of Wild pollock market
-
By Species :
- Alaska Pollock
- Atlantic Pollock
-
By Form :
- Fresh
- Whole
- Fillets
- Frozen
- Canned
-
By End Use :
- Households
- Food Service
- Pharmaceuticals & Nutraceuticals
-
By Distribution Channel :
- Grocery Stores
- Hypermarkets/Supermarkets
- Online Retail Stores
-
By Region :
- North America
- Latin America
- Western Europe
- Eastern Europe
- East Asia
- South Asia & Pacific
- Middle East & Africa
- Frequently Asked Questions -
What was the global Wild pollock market size reported by Fact.MR for 2025?
The Global Wild pollock market was valued at USD 2,375 Million in 2025.
Who are the major players operating in the Wild pollock market?
Prominent players in the market are Norebo Holding, Russian Fishery Company, Trident Seafoods, Eastern Fish Company, Glacier Fish Company LLC, American Seafoods Group, Ocean Peace, Inc., and Aleutian Spray Fisheries.
What is the Estimated Valuation of the Wild pollock market in 2035?
The market is expected to reach a valuation of USD 3,981 Million in 2035.
What value CAGR did the Wild pollock market exhibit over the last five years?
The historic growth rate of the Wild pollock market was 4.2% from 2020 to 2024.