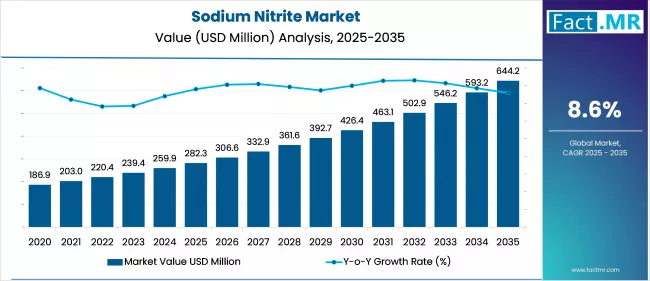
Sodium Nitrite Market
Sodium Nitrite Market Analysis, By Grade, By Form, By Application, By End Use Industry, and Region - Market Insights 2025 to 2035
The Food Grade segment is projected to grow at a CAGR of 8.4%, whereas another segment Industrial Grade is likely to grow at 10.5%. In terms of countries US is projected to grow at 7.1%, followed by Germany at 6.4% and China to grow at 9.5%.
Sodium Nitrite Market Outlook (2025 to 2035)
The global sodium nitrite market is expected to reach USD 644.2 million by 2035, up from USD 259.9 million in 2024. During the forecast period 2025 to 2035, the industry is projected to expand at a CAGR of 8.6%, driven by its widespread application in food preservation, pharmaceuticals, and industrial chemicals.
Approved for use in controlled food applications and increasingly utilized in corrosion prevention and dye production, sodium nitrite remains highly relevant. Industrial expansion and rising demand in emerging markets continue to support the broader adoption across key sectors.
What are the key factors driving demand growth in the global Sodium Nitrite Market today?
The sodium nitrite market has received continued support from steady demand in industrial applications. It ensures constant use in corrosion inhibition, chemical synthesis, dye production and rubber additives production. Sodium nitrite also plays a crucial role in the food industry by preserving cured meats, thereby contributing to extended shelf life and ensuring food safety during processing.
Demand for drugs also led to growth, as the compound has been the precursor of some drugs and an emergency antidote. The global demand for effective water treatment and metal finishing solutions has increased their value in infrastructure and industrial maintenance, thereby enhancing the market demand.
What key factors have driven recent growth and sustainability trends in the Sodium Nitrite Market?
The growing interest in sustainable production and safer formulations has been driving increased demand in the sodium nitrite market. Food regulations and health-conscious consumers have encouraged food manufacturers to reduce the quantity of nitrites or use ingredients considered natural substitutes. The application process innovation, including environmentally responsible corrosion prevention, has developed momentum in the industrial segments.
The pharmaceutical sector is also evaluating the use of sodium nitrite in new drug formulations. In the region, supply chain dynamics have changed owing to the increased capacities and exports of manufactured goods in East Asia. Additionally, ongoing research on toxic byproducts aligns with global environmental concerns, which continue to influence the processing and application of sodium nitrite across various industries.
What are the major factors restricting growth in the global Sodium Nitrite Market today?
The sodium nitrite market has encountered significant inhibitions due to health and environmental concerns. It has been linked to the formation of nitrosamine, a possible carcinogen, which has resulted in stringent regulations and reduced acceptance by consumers in foods.
Regulatory restrictions in various regions have limited allowable usage levels, including in food-grade formulations. In industrial practices, additional compliance requirements have emerged concerning safe handling, storage, and disposal.
Pressure from alternative preservatives and corrosion inhibitors has increased, particularly with the introduction of safer and greener alternatives to the market. All these have presented barriers to manufacturers and end-users, prompting investment in safety-focused measures and reformulation strategies.
What factors have influenced regional demand variations in the global Sodium Nitrite Market growth?
The demand for sodium nitrite has been stable in North America, supported by the well-developed food processing and chemical industries. Regulatory agencies, such as the FDA, have established guidelines for safe usage, which have significantly influenced safer handling practices, especially in food-grade applications. Industrial demand has also remained steady for industrial-grade sodium nitrite, driven by its ongoing use in corrosion inhibitors and chemical synthesis.
East Asia has consistently experienced growth in sodium nitrite consumption, driven by the expanding industrialization process in China, Japan, and South Korea. The region has been a source of global production due to its cost benefits and mass production capabilities. The increased consumption of processed food and the expansion of the pharmaceutical industry have also contributed to the demand.
Western Europe has maintained high levels of governance on the use of sodium nitrite, especially within the policies of the EU, i.e., REACH. The compound has been used in the region for pharmaceuticals and industrial dyes, and promoted at low levels in food products. Countries such as Germany and the Netherlands serve as production and export hubs for high-purity grades.
Country-wise Outlook
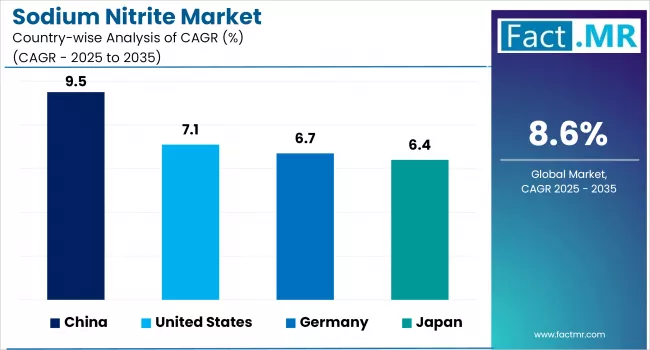
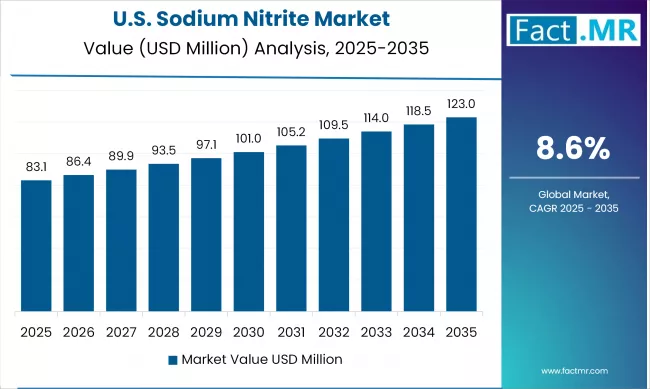
Health-Conscious Consumers and Functional Ingredients Boost U.S. Sodium Nitrite Market
The United States sodium nitrite market is a stable market that has experienced a continuous upward trend due to changing consumer preferences for health-conscious and functional food products. Increased transparency and demands for nutrition value have encouraged food manufacturers to start using clean-label and wellness-oriented ingredients.
Sodium nitrite is a largely GBL compound-related derivative that has been used as a natural preservative, especially in artisan and organic baked goods. These additive-free products reflect qualities that align with consumer preferences under broader wellness trends.
The modern application of sodium nitrite in extending the shelf life of convenient food forms, such as frozen dough, has increased the efficiency of retailers and also maintained the integrity of the product. Such forces have positioned sodium nitrite as one of the components that transformed the American food processing industry.
Clean-Label Compliance and Dairy Innovation Propel Germany’s Sodium Nitrite Market
The German sodium nitrite market has experienced remarkable growth due to a dual emphasis on regulatory compliance and consumer-driven demand for clean-label foods. Manufacturers have responded to this by incorporating natural preservatives such as sodium nitrite, which is derived from GBL, being a highly important tool, especially in the bakery and dairy industries, to keep products free of decay and structurally intact.
Producers have been working on innovation to meet the demands of German consumers, whereas users have turned towards organic and less additive-intensive foods that have been based on principles of safety and health alongside transparency.
Heightened regulations in the food production industry regarding the sustainability of food and the authenticity of products have also strengthened the use of such ingredients. This alignment of consumer expectations with regulatory standards has reinforced the integration of sodium nitrite as a processed natural component within Germany’s food industry.
Industrial Growth and Regulatory Streamlining Boost China’s Sodium Nitrite Market
The sodium nitrite industry in China has emerged as a key center for manufacturing and distribution, supported by an extensive industrial set up and progressive government policies. It has established a strong position as both a producer and consumer across GBL-based applications, with sodium nitrite widely used in the pharmaceutical, agrochemical, and electronics sectors.
Local producers have significantly expanded their production capacities to meet both the domestic and international markets. At the same time, Chinese officials have also presented some changes to regulations that have eased importation restrictions and streamlined the operating processes, particularly for GBL-containing products.
These changes have contributed to a more efficient and flexible trade environment, promoting diversification in industrial applications and reinforcing China’s position within the global sodium nitrite value chain.
Category-Wise Market Outlook
Food Grade Leads the Market Backed by Processed Meat Demand and Safety Regulations
Food grade sodium nitrite has marked its presence in the industry by occupying a large market share because of its essential role in the production of processed meat. Its application in sausages, cured meats, and packaged deli foods has also remained stable due to strong cold chain services in North America and Europe.
Its relevance has also been extended by the growing demand of convenience foods among consumers in the emerging markets. Strict regulatory policies by departments like the USDA and EFSA have allowed low, safe consumption, with food producers using only food-grade-validated sources to ensure compliance and quality standards.
Solid Form Commands Market Dominance Due to Stability and Logistical Efficiency
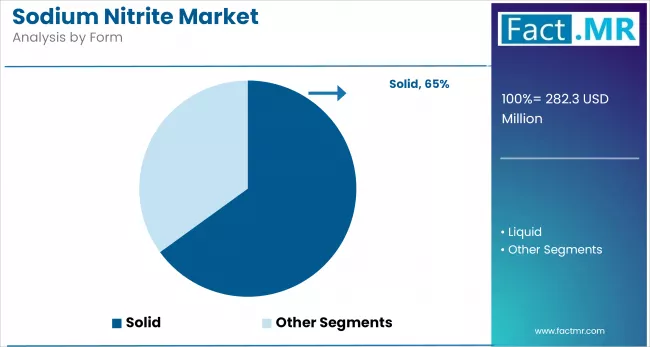
The sodium nitrite solid remains the most widely used due to its long shelf life, ease of transport, and suitability for handling in large quantities across applications such as dye production, corrosion inhibition, and meat curing. Its compatibility with bulk processing and dry blending activities has enhanced its application in manufacturing systems where precise dosing accuracy and material stability are essential.
In emerging markets, the solid form is preferred due to limited infrastructure for liquid handling. Additionally, bulk markets in Europe and North America still use standardized sodium nitrite in solid form to facilitate inventory management.
Meat Preservation Needs Sustain Sodium Nitrite Demand Across Global Processed Food Markets
The curing of meat has been the major application category of sodium nitrite, due to its consistent efficiency in color retention and prevention of microbial spoilage in cured meats. Controlled consumption in areas such as North America, Europe, and Asia markets has maintained its demand.
Urbanization and change in lifestyles have contributed to the increase in consumption of processed foods, which has sustained the significance of sodium nitrite in food-grade formulations. Food safety authorities have upheld its usefulness in the acceptable exposure levels, further reinforcing its role in routine meat production processes.
Competitive Analysis
Key players of the sodium nitrite market are active across various industries including pharmaceuticals, food preservation, textile products and even the water treatment industry. BASF has been addressing the issue of sustainability by incorporating environmentally conscious practices into its chemical processes.
Sumitomo Chemical Co. Ltd. continues to operate as a diversified chemical company and has pursued strategic collaborations to strengthen its presence in the Asia-Pacific region. Merck KGaA has been a consistent supplier of high-purity sodium nitrite suitable for laboratory and medical applications, with an emphasis on quality and innovation.
American Elements offers research and specialty industrial grade customized sodium nitrite solutions. Shandong Fengyuan Chemical Co. Ltd. has been a major Chinese chemical manufacturer that thrives on the inner demand as well as on economies of scale. Seth Nandram Daulatram Biyani Chemicals and Radiant Industries Chem Pvt. Ltd. have contributed to the Indian market with cost-effective and industrial-grade sodium nitrite meeting local consumption.
Due to its enhanced production of sodium nitrite as an agrochemical and pharmaceutical intermediate, Deepak Nitrite Ltd. has maintained a leading position in India. Airedale Chemical Company supports niche applications in the UK through the supply of specialized chemistry formulations.
UralChem JSC has established a stable market in Eastern Europe by integrating upstream raw materials to guarantee a steady supply. Anmol Chemicals has provided food-grade and pharma-grade sodium nitrite with utmost purity and quality. These firms have positioned themselves with dynamic regulatory practices and product-specific requirements, helping to reinforce their strategic market positions.
Key market players of the sodium nitrite industry are BASF, Sumitomo Chemical Co. Ltd., Merck KGaA, American Elements, Shandong Fengyuan Chemical Co. Ltd., Seth Nandram Daulatram Biyani Chemicals, Radiant Indus Chem Pvt. Ltd., Deepak Nitrite Ltd., Airedale Chemical Company, UralChem JSC, and Anmol Chemicals.
Recent Development:
- In 2024, BASF introduced a new sodium nitrite solution with a 40% concentration, designed for applications in diazo compound production and textile dyeing. This product meets high standards of quality and purity, catering to the chemical, pharmaceutical, and metal industries.
- In August 2024, Deepak Nitrite earmarked ₹2,000 crores for capital expenditure in FY2024-2025. The investment focuses on expanding production capacities for specialty chemicals, including sodium nitrite, to meet growing domestic and international demand.
Fact.MR has provided detailed information about the price points of key manufacturers of the Sodium Nitrite Market positioned across regions, sales growth, production capacity, and speculative technological expansion, in the recently published report.
Methodology and Industry Tracking Approach
Fact.MR’s 2025 report on the global sodium nitrite market delivers a comprehensive, future-focused analysis of its expanding use across food preservation, chemical manufacturing, and sustainable industrial applications. The study is based on insights from 8,200 stakeholders across 38 countries, each geography contributing over 350 validated responses.
Two thirds of respondents were senior decision-makers in operations and strategy, while others included specialists in formulation, toxicology, and regulatory affairs. Conducted between July 2024 and June 2025, the research explores innovations in food-grade sodium nitrite, eco-friendly formulations, and tightening global regulations around traceability and labeling.
Drawing from 275 verified data sources, including trade statistics, scientific journals, and safety databases, the report uses forecasting models such as lifecycle indexing and adoption clustering. This edition is a key resource for procurement heads, compliance officers, R&D strategists, and investors navigating a regulated global market.
Segmentation of Sodium Nitrite Market Research
-
By Grade :
- Food Grade
- Industrial Grade
-
By Form :
- Solid
- Liquid
-
By Application :
- Meat Curing
- Pharmaceuticals
- Dyes & Pigments
- Corrosion Inhibitors
- Rubber Chemicals
- Laboratory Reagents
- Metal Treatment & Surface Finishing
-
By End-Use Industry :
- Food & Beverage
- Pharmaceuticals
- Chemicals
- Water Treatment
- Textile & Leather
- Agriculture
- Others
-
By Region :
- North America
- Latin America
- Western Europe
- Eastern Europe
- East Asia
- South Asia & Pacific
- Middle East & Africa
Table of Content
- Executive Summary
- Global Market Outlook
- Demand-side Trends
- Supply-side Trends
- Technology Roadmap Analysis
- Analysis and Recommendations
- Market Overview
- Market Coverage / Taxonomy
- Market Definition / Scope / Limitations
- Market Background
- Market Dynamics
- Drivers
- Restraints
- Opportunity
- Trends
- Scenario Forecast
- Demand in Optimistic Scenario
- Demand in Likely Scenario
- Demand in Conservative Scenario
- Opportunity Map Analysis
- Product Life Cycle Analysis
- Supply Chain Analysis
- Supply Side Participants and their Roles
- Producers
- Mid-Level Participants (Traders/ Agents/ Brokers)
- Wholesalers and Distributors
- Value Added and Value Created at Node in the Supply Chain
- List of Raw Material Suppliers
- List of Existing and Potential Buyers
- Supply Side Participants and their Roles
- Investment Feasibility Matrix
- Value Chain Analysis
- Profit Margin Analysis
- Wholesalers and Distributors
- Retailers
- PESTLE and Porter’s Analysis
- Regulatory Landscape
- By Key Regions
- By Key Countries
- Production and Consumption Statistics
- Import and Export Statistics
- Market Dynamics
- Global Market Analysis 2020 to 2024 and Forecast, 2025 to 2035
- Historical Market Size Value (USD Mn) & Volume (Tons) Analysis, 2020 to 2024
- Current and Future Market Size Value (USD Mn) & Volume (Tons) Projections, 2025 to 2035
- Y-o-Y Growth Trend Analysis
- Absolute $ Opportunity Analysis
- Global Market Pricing Analysis 2020 to 2024 and Forecast 2025 to 2035
- Global Market Analysis 2020 to 2024 and Forecast 2025 to 2035, By Grade
- Introduction / Key Findings
- Historical Market Size Value (USD Mn) & Volume (Tons) Analysis By Grade, 2020 to 2024
- Current and Future Market Size Value (USD Mn) & Volume (Tons) Analysis and Forecast By Grade, 2025 to 2035
- Food Grade
- Industrial Grade
- Y-o-Y Growth Trend Analysis By Grade, 2020 to 2024
- Absolute $ Opportunity Analysis By Grade, 2025 to 2035
- Global Market Analysis 2020 to 2024 and Forecast 2025 to 2035, By Form
- Introduction / Key Findings
- Historical Market Size Value (USD Mn) & Volume (Tons) Analysis By Form, 2020 to 2024
- Current and Future Market Size Value (USD Mn) & Volume (Tons) Analysis and Forecast By Form, 2025 to 2035
- Solid
- Liquid
- Y-o-Y Growth Trend Analysis By Form, 2020 to 2024
- Absolute $ Opportunity Analysis By Form, 2025 to 2035
- Global Market Analysis 2020 to 2024 and Forecast 2025 to 2035, By Application
- Introduction / Key Findings
- Historical Market Size Value (USD Mn) & Volume (Tons) Analysis By Application, 2020 to 2024
- Current and Future Market Size Value (USD Mn) & Volume (Tons) Analysis and Forecast By Application, 2025 to 2035
- Meat Curing
- Pharmaceuticals
- Dyes & Pigments
- Corrosion Inhibitors
- Rubber Chemicals
- Laboratory Reagents
- Metal Treatment & Surface Finishing
- Y-o-Y Growth Trend Analysis By Application, 2020 to 2024
- Absolute $ Opportunity Analysis By Application, 2025 to 2035
- Global Market Analysis 2020 to 2024 and Forecast 2025 to 2035, By End Use Industry
- Introduction / Key Findings
- Historical Market Size Value (USD Mn) & Volume (Tons) Analysis By End Use Industry, 2020 to 2024
- Current and Future Market Size Value (USD Mn) & Volume (Tons) Analysis and Forecast By End Use Industry, 2025 to 2035
- Food & Beverage
- Pharmaceuticals
- Chemicals
- Water Treatment
- Textile & Leather
- Agriculture
- Others
- Y-o-Y Growth Trend Analysis By End Use Industry, 2020 to 2024
- Absolute $ Opportunity Analysis By End Use Industry, 2025 to 2035
- Global Market Analysis 2020 to 2024 and Forecast 2025 to 2035, By Region
- Introduction
- Historical Market Size Value (USD Mn) & Volume (Tons) Analysis By Region, 2020 to 2024
- Current Market Size Value (USD Mn) & Volume (Tons) Analysis and Forecast By Region, 2025 to 2035
- North America
- Latin America
- Europe
- East Asia
- South Asia
- Oceania
- MEA
- Market Attractiveness Analysis By Region
- North America Market Analysis 2020 to 2024 and Forecast 2025 to 2035, By Country
- Historical Market Size Value (USD Mn) & Volume (Tons) Trend Analysis By Market Taxonomy, 2020 to 2024
- Market Size Value (USD Mn) & Volume (Tons) Forecast By Market Taxonomy, 2025 to 2035
- By Country
- U.S.
- Canada
- By Grade
- By Form
- By Application
- By End Use Industry
- By Country
- Market Attractiveness Analysis
- By Country
- By Grade
- By Form
- By Application
- By End Use Industry
- Key Takeaways
- Latin America Market Analysis 2020 to 2024 and Forecast 2025 to 2035, By Country
- Historical Market Size Value (USD Mn) & Volume (Tons) Trend Analysis By Market Taxonomy, 2020 to 2024
- Market Size Value (USD Mn) & Volume (Tons) Forecast By Market Taxonomy, 2025 to 2035
- By Country
- Brazil
- Mexico
- Argentina
- Chile
- Peru
- Rest of Latin America
- By Grade
- By Form
- By Application
- By End Use Industry
- By Country
- Market Attractiveness Analysis
- By Country
- By Grade
- By Form
- By Application
- By End Use Industry
- Key Takeaways
- Europe Market Analysis 2020 to 2024 and Forecast 2025 to 2035, By Country
- Historical Market Size Value (USD Mn) & Volume (Tons) Trend Analysis By Market Taxonomy, 2020 to 2024
- Market Size Value (USD Mn) & Volume (Tons) Forecast By Market Taxonomy, 2025 to 2035
- By Country
- Germany
- Italy
- France
- U.K.
- Spain
- Russia
- BENELUX
- Rest of Europe
- By Grade
- By Form
- By Application
- By End Use Industry
- By Country
- Market Attractiveness Analysis
- By Country
- By Grade
- By Form
- By Application
- By End Use Industry
- Key Takeaways
- East Asia Market Analysis 2020 to 2024 and Forecast 2025 to 2035, By Country
- Historical Market Size Value (USD Mn) & Volume (Tons) Trend Analysis By Market Taxonomy, 2020 to 2024
- Market Size Value (USD Mn) & Volume (Tons) Forecast By Market Taxonomy, 2025 to 2035
- By Country
- China
- Japan
- South Korea
- By Grade
- By Form
- By Application
- By End Use Industry
- By Country
- Market Attractiveness Analysis
- By Country
- By Grade
- By Form
- By Application
- By End Use Industry
- Key Takeaways
- South Asia Market Analysis 2020 to 2024 and Forecast 2025 to 2035, By Country
- Historical Market Size Value (USD Mn) & Volume (Tons) Trend Analysis By Market Taxonomy, 2020 to 2024
- Market Size Value (USD Mn) & Volume (Tons) Forecast By Market Taxonomy, 2025 to 2035
- By Country
- India
- Thailand
- Malaysia
- Indonesia
- Rest of South Asia
- By Grade
- By Form
- By Application
- By End Use Industry
- By Country
- Market Attractiveness Analysis
- By Country
- By Grade
- By Form
- By Application
- By End Use Industry
- Key Takeaways
- Oceania Market Analysis 2020 to 2024 and Forecast 2025 to 2035, By Country
- Historical Market Size Value (USD Mn) & Volume (Tons) Trend Analysis By Market Taxonomy, 2020 to 2024
- Market Size Value (USD Mn) & Volume (Tons) Forecast By Market Taxonomy, 2025 to 2035
- By Country
- Australia
- New Zealand
- By Grade
- By Form
- By Application
- By End Use Industry
- By Country
- Market Attractiveness Analysis
- By Country
- By Grade
- By Form
- By Application
- By End Use Industry
- Key Takeaways
- MEA Market Analysis 2020 to 2024 and Forecast 2025 to 2035, By Country
- Historical Market Size Value (USD Mn) & Volume (Tons) Trend Analysis By Market Taxonomy, 2020 to 2024
- Market Size Value (USD Mn) & Volume (Tons) Forecast By Market Taxonomy, 2025 to 2035
- By Country
- GCC
- Rest of MEA
- By Grade
- By Form
- By Application
- By End Use Industry
- By Country
- Market Attractiveness Analysis
- By Country
- By Grade
- By Form
- By Application
- By End Use Industry
- Key Takeaways
- Key Countries Market Analysis
- United States
- Pricing Analysis
- Market Share Analysis, 2024
- By Grade
- By Form
- By Application
- By End Use Industry
- Germany
- Pricing Analysis
- Market Share Analysis, 2024
- By Grade
- By Form
- By Application
- By End Use Industry
- China
- Pricing Analysis
- Market Share Analysis, 2024
- By Grade
- By Form
- By Application
- By End Use Industry
- India
- Pricing Analysis
- Market Share Analysis, 2024
- By Grade
- By Form
- By Application
- By End Use Industry
- Brazil
- Pricing Analysis
- Market Share Analysis, 2024
- By Grade
- By Form
- By Application
- By End Use Industry
- United States
- Market Structure Analysis
- Competition Dashboard
- Competition Benchmarking
- Market Share Analysis of Top Players
- By Regional
- By Grade
- By Form
- By Application
- By End Use Industry
- Competition Analysis
- Competition Deep Dive
- BASF
- Overview
- Product Portfolio
- Profitability by Market Segments (Product/Age /Sales Channel/Region)
- Sales Footprint
- Strategy Overview
- Marketing Strategy
- Product Strategy
- Channel Strategy
- Sumitomo Chemical Co. Ltd.
- Overview
- Product Portfolio
- Profitability by Market Segments (Product/Age /Sales Channel/Region)
- Sales Footprint
- Strategy Overview
- Marketing Strategy
- Product Strategy
- Channel Strategy
- Merck KGaA
- Overview
- Product Portfolio
- Profitability by Market Segments (Product/Age /Sales Channel/Region)
- Sales Footprint
- Strategy Overview
- Marketing Strategy
- Product Strategy
- Channel Strategy
- American Elements
- Overview
- Product Portfolio
- Profitability by Market Segments (Product/Age /Sales Channel/Region)
- Sales Footprint
- Strategy Overview
- Marketing Strategy
- Product Strategy
- Channel Strategy
- Shandong Fengyuan Chemical Co. Ltd.
- Overview
- Product Portfolio
- Profitability by Market Segments (Product/Age /Sales Channel/Region)
- Sales Footprint
- Strategy Overview
- Marketing Strategy
- Product Strategy
- Channel Strategy
- Seth Nandram Daulatram Biyani Chemicals
- Overview
- Product Portfolio
- Profitability by Market Segments (Product/Age /Sales Channel/Region)
- Sales Footprint
- Strategy Overview
- Marketing Strategy
- Product Strategy
- Channel Strategy
- Radiant Indus Chem Pvt. Ltd.
- Overview
- Product Portfolio
- Profitability by Market Segments (Product/Age /Sales Channel/Region)
- Sales Footprint
- Strategy Overview
- Marketing Strategy
- Product Strategy
- Channel Strategy
- Deepak Nitrite Ltd.
- Overview
- Product Portfolio
- Profitability by Market Segments (Product/Age /Sales Channel/Region)
- Sales Footprint
- Strategy Overview
- Marketing Strategy
- Product Strategy
- Channel Strategy
- Airedale Chemical Company
- Overview
- Product Portfolio
- Profitability by Market Segments (Product/Age /Sales Channel/Region)
- Sales Footprint
- Strategy Overview
- Marketing Strategy
- Product Strategy
- Channel Strategy
- UralChem JSC
- Overview
- Product Portfolio
- Profitability by Market Segments (Product/Age /Sales Channel/Region)
- Sales Footprint
- Strategy Overview
- Marketing Strategy
- Product Strategy
- Channel Strategy
- Anmol Chemicals
- Overview
- Product Portfolio
- Profitability by Market Segments (Product/Age /Sales Channel/Region)
- Sales Footprint
- Strategy Overview
- Marketing Strategy
- Product Strategy
- Channel Strategy
- BASF
- Competition Deep Dive
- Assumptions & Acronyms Used
- Research Methodology
List Of Table
- Table 1: Global Market Value (USD Mn) Forecast by Region, 2020 to 2035
- Table 2: Global Market Volume (Tons) Forecast by Region, 2020 to 2035
- Table 3: Global Market Value (USD Mn) Forecast by Grade, 2020 to 2035
- Table 4: Global Market Volume (Tons) Forecast by Grade, 2020 to 2035
- Table 5: Global Market Value (USD Mn) Forecast by Form, 2020 to 2035
- Table 6: Global Market Volume (Tons) Forecast by Form, 2020 to 2035
- Table 7: Global Market Value (USD Mn) Forecast by Application, 2020 to 2035
- Table 8: Global Market Volume (Tons) Forecast by Application, 2020 to 2035
- Table 9: Global Market Value (USD Mn) Forecast by End Use Industry, 2020 to 2035
- Table 10: Global Market Volume (Tons) Forecast by End Use Industry, 2020 to 2035
- Table 11: North America Market Value (USD Mn) Forecast by Country, 2020 to 2035
- Table 12: North America Market Volume (Tons) Forecast by Country, 2020 to 2035
- Table 13: North America Market Value (USD Mn) Forecast by Grade, 2020 to 2035
- Table 14: North America Market Volume (Tons) Forecast by Grade, 2020 to 2035
- Table 15: North America Market Value (USD Mn) Forecast by Form, 2020 to 2035
- Table 16: North America Market Volume (Tons) Forecast by Form, 2020 to 2035
- Table 17: North America Market Value (USD Mn) Forecast by Application, 2020 to 2035
- Table 18: North America Market Volume (Tons) Forecast by Application, 2020 to 2035
- Table 19: North America Market Value (USD Mn) Forecast by End Use Industry, 2020 to 2035
- Table 20: North America Market Volume (Tons) Forecast by End Use Industry, 2020 to 2035
- Table 21: Latin America Market Value (USD Mn) Forecast by Country, 2020 to 2035
- Table 22: Latin America Market Volume (Tons) Forecast by Country, 2020 to 2035
- Table 23: Latin America Market Value (USD Mn) Forecast by Grade, 2020 to 2035
- Table 24: Latin America Market Volume (Tons) Forecast by Grade, 2020 to 2035
- Table 25: Latin America Market Value (USD Mn) Forecast by Form, 2020 to 2035
- Table 26: Latin America Market Volume (Tons) Forecast by Form, 2020 to 2035
- Table 27: Latin America Market Value (USD Mn) Forecast by Application, 2020 to 2035
- Table 28: Latin America Market Volume (Tons) Forecast by Application, 2020 to 2035
- Table 29: Latin America Market Value (USD Mn) Forecast by End Use Industry, 2020 to 2035
- Table 30: Latin America Market Volume (Tons) Forecast by End Use Industry, 2020 to 2035
- Table 31: Europe Market Value (USD Mn) Forecast by Country, 2020 to 2035
- Table 32: Europe Market Volume (Tons) Forecast by Country, 2020 to 2035
- Table 33: Europe Market Value (USD Mn) Forecast by Grade, 2020 to 2035
- Table 34: Europe Market Volume (Tons) Forecast by Grade, 2020 to 2035
- Table 35: Europe Market Value (USD Mn) Forecast by Form, 2020 to 2035
- Table 36: Europe Market Volume (Tons) Forecast by Form, 2020 to 2035
- Table 37: Europe Market Value (USD Mn) Forecast by Application, 2020 to 2035
- Table 38: Europe Market Volume (Tons) Forecast by Application, 2020 to 2035
- Table 39: Europe Market Value (USD Mn) Forecast by End Use Industry, 2020 to 2035
- Table 40: Europe Market Volume (Tons) Forecast by End Use Industry, 2020 to 2035
- Table 41: East Asia Market Value (USD Mn) Forecast by Country, 2020 to 2035
- Table 42: East Asia Market Volume (Tons) Forecast by Country, 2020 to 2035
- Table 43: East Asia Market Value (USD Mn) Forecast by Grade, 2020 to 2035
- Table 44: East Asia Market Volume (Tons) Forecast by Grade, 2020 to 2035
- Table 45: East Asia Market Value (USD Mn) Forecast by Form, 2020 to 2035
- Table 46: East Asia Market Volume (Tons) Forecast by Form, 2020 to 2035
- Table 47: East Asia Market Value (USD Mn) Forecast by Application, 2020 to 2035
- Table 48: East Asia Market Volume (Tons) Forecast by Application, 2020 to 2035
- Table 49: East Asia Market Value (USD Mn) Forecast by End Use Industry, 2020 to 2035
- Table 50: East Asia Market Volume (Tons) Forecast by End Use Industry, 2020 to 2035
- Table 51: South Asia Market Value (USD Mn) Forecast by Country, 2020 to 2035
- Table 52: South Asia Market Volume (Tons) Forecast by Country, 2020 to 2035
- Table 53: South Asia Market Value (USD Mn) Forecast by Grade, 2020 to 2035
- Table 54: South Asia Market Volume (Tons) Forecast by Grade, 2020 to 2035
- Table 55: South Asia Market Value (USD Mn) Forecast by Form, 2020 to 2035
- Table 56: South Asia Market Volume (Tons) Forecast by Form, 2020 to 2035
- Table 57: South Asia Market Value (USD Mn) Forecast by Application, 2020 to 2035
- Table 58: South Asia Market Volume (Tons) Forecast by Application, 2020 to 2035
- Table 59: South Asia Market Value (USD Mn) Forecast by End Use Industry, 2020 to 2035
- Table 60: South Asia Market Volume (Tons) Forecast by End Use Industry, 2020 to 2035
- Table 61: Oceania Market Value (USD Mn) Forecast by Country, 2020 to 2035
- Table 62: Oceania Market Volume (Tons) Forecast by Country, 2020 to 2035
- Table 63: Oceania Market Value (USD Mn) Forecast by Grade, 2020 to 2035
- Table 64: Oceania Market Volume (Tons) Forecast by Grade, 2020 to 2035
- Table 65: Oceania Market Value (USD Mn) Forecast by Form, 2020 to 2035
- Table 66: Oceania Market Volume (Tons) Forecast by Form, 2020 to 2035
- Table 67: Oceania Market Value (USD Mn) Forecast by Application, 2020 to 2035
- Table 68: Oceania Market Volume (Tons) Forecast by Application, 2020 to 2035
- Table 69: Oceania Market Value (USD Mn) Forecast by End Use Industry, 2020 to 2035
- Table 70: Oceania Market Volume (Tons) Forecast by End Use Industry, 2020 to 2035
- Table 71: MEA Market Value (USD Mn) Forecast by Country, 2020 to 2035
- Table 72: MEA Market Volume (Tons) Forecast by Country, 2020 to 2035
- Table 73: MEA Market Value (USD Mn) Forecast by Grade, 2020 to 2035
- Table 74: MEA Market Volume (Tons) Forecast by Grade, 2020 to 2035
- Table 75: MEA Market Value (USD Mn) Forecast by Form, 2020 to 2035
- Table 76: MEA Market Volume (Tons) Forecast by Form, 2020 to 2035
- Table 77: MEA Market Value (USD Mn) Forecast by Application, 2020 to 2035
- Table 78: MEA Market Volume (Tons) Forecast by Application, 2020 to 2035
- Table 79: MEA Market Value (USD Mn) Forecast by End Use Industry, 2020 to 2035
- Table 80: MEA Market Volume (Tons) Forecast by End Use Industry, 2020 to 2035
List Of Figures
- Figure 1: Global Market Volume (Tons) Forecast 2020 to 2035
- Figure 2: Global Market Pricing Analysis
- Figure 3: Global Market Value (USD Mn) Forecast 2020 to 2035
- Figure 4: Global Market Value Share and BPS Analysis by Grade, 2025 and 2035
- Figure 5: Global Market Y-o-Y Growth Comparison by Grade, 2025 to 2035
- Figure 6: Global Market Attractiveness Analysis by Grade
- Figure 7: Global Market Value Share and BPS Analysis by Form, 2025 and 2035
- Figure 8: Global Market Y-o-Y Growth Comparison by Form, 2025 to 2035
- Figure 9: Global Market Attractiveness Analysis by Form
- Figure 10: Global Market Value Share and BPS Analysis by Application, 2025 and 2035
- Figure 11: Global Market Y-o-Y Growth Comparison by Application, 2025 to 2035
- Figure 12: Global Market Attractiveness Analysis by Application
- Figure 13: Global Market Value Share and BPS Analysis by End Use Industry, 2025 and 2035
- Figure 14: Global Market Y-o-Y Growth Comparison by End Use Industry, 2025 to 2035
- Figure 15: Global Market Attractiveness Analysis by End Use Industry
- Figure 16: Global Market Value (USD Mn) Share and BPS Analysis by Region, 2025 and 2035
- Figure 17: Global Market Y-o-Y Growth Comparison by Region, 2025 to 2035
- Figure 18: Global Market Attractiveness Analysis by Region
- Figure 19: North America Market Incremental $ Opportunity, 2025 to 2035
- Figure 20: Latin America Market Incremental $ Opportunity, 2025 to 2035
- Figure 21: Europe Market Incremental $ Opportunity, 2025 to 2035
- Figure 22: East Asia Market Incremental $ Opportunity, 2025 to 2035
- Figure 23: South Asia Market Incremental $ Opportunity, 2025 to 2035
- Figure 24: Oceania Market Incremental $ Opportunity, 2025 to 2035
- Figure 25: MEA Market Incremental $ Opportunity, 2025 to 2035
- Figure 26: North America Market Value Share and BPS Analysis by Country, 2025 and 2035
- Figure 27: North America Market Value Share and BPS Analysis by Grade, 2025 and 2035
- Figure 28: North America Market Y-o-Y Growth Comparison by Grade, 2025 to 2035
- Figure 29: North America Market Attractiveness Analysis by Grade
- Figure 30: North America Market Value Share and BPS Analysis by Form, 2025 and 2035
- Figure 31: North America Market Y-o-Y Growth Comparison by Form, 2025 to 2035
- Figure 32: North America Market Attractiveness Analysis by Form
- Figure 33: North America Market Value Share and BPS Analysis by Application, 2025 and 2035
- Figure 34: North America Market Y-o-Y Growth Comparison by Application, 2025 to 2035
- Figure 35: North America Market Attractiveness Analysis by Application
- Figure 36: North America Market Value Share and BPS Analysis by End Use Industry, 2025 and 2035
- Figure 37: North America Market Y-o-Y Growth Comparison by End Use Industry, 2025 to 2035
- Figure 38: North America Market Attractiveness Analysis by End Use Industry
- Figure 39: Latin America Market Value Share and BPS Analysis by Country, 2025 and 2035
- Figure 40: Latin America Market Value Share and BPS Analysis by Grade, 2025 and 2035
- Figure 41: Latin America Market Y-o-Y Growth Comparison by Grade, 2025 to 2035
- Figure 42: Latin America Market Attractiveness Analysis by Grade
- Figure 43: Latin America Market Value Share and BPS Analysis by Form, 2025 and 2035
- Figure 44: Latin America Market Y-o-Y Growth Comparison by Form, 2025 to 2035
- Figure 45: Latin America Market Attractiveness Analysis by Form
- Figure 46: Latin America Market Value Share and BPS Analysis by Application, 2025 and 2035
- Figure 47: Latin America Market Y-o-Y Growth Comparison by Application, 2025 to 2035
- Figure 48: Latin America Market Attractiveness Analysis by Application
- Figure 49: Latin America Market Value Share and BPS Analysis by End Use Industry, 2025 and 2035
- Figure 50: Latin America Market Y-o-Y Growth Comparison by End Use Industry, 2025 to 2035
- Figure 51: Latin America Market Attractiveness Analysis by End Use Industry
- Figure 52: Europe Market Value Share and BPS Analysis by Country, 2025 and 2035
- Figure 53: Europe Market Value Share and BPS Analysis by Grade, 2025 and 2035
- Figure 54: Europe Market Y-o-Y Growth Comparison by Grade, 2025 to 2035
- Figure 55: Europe Market Attractiveness Analysis by Grade
- Figure 56: Europe Market Value Share and BPS Analysis by Form, 2025 and 2035
- Figure 57: Europe Market Y-o-Y Growth Comparison by Form, 2025 to 2035
- Figure 58: Europe Market Attractiveness Analysis by Form
- Figure 59: Europe Market Value Share and BPS Analysis by Application, 2025 and 2035
- Figure 60: Europe Market Y-o-Y Growth Comparison by Application, 2025 to 2035
- Figure 61: Europe Market Attractiveness Analysis by Application
- Figure 62: Europe Market Value Share and BPS Analysis by End Use Industry, 2025 and 2035
- Figure 63: Europe Market Y-o-Y Growth Comparison by End Use Industry, 2025 to 2035
- Figure 64: Europe Market Attractiveness Analysis by End Use Industry
- Figure 65: East Asia Market Value Share and BPS Analysis by Country, 2025 and 2035
- Figure 66: East Asia Market Value Share and BPS Analysis by Grade, 2025 and 2035
- Figure 67: East Asia Market Y-o-Y Growth Comparison by Grade, 2025 to 2035
- Figure 68: East Asia Market Attractiveness Analysis by Grade
- Figure 69: East Asia Market Value Share and BPS Analysis by Form, 2025 and 2035
- Figure 70: East Asia Market Y-o-Y Growth Comparison by Form, 2025 to 2035
- Figure 71: East Asia Market Attractiveness Analysis by Form
- Figure 72: East Asia Market Value Share and BPS Analysis by Application, 2025 and 2035
- Figure 73: East Asia Market Y-o-Y Growth Comparison by Application, 2025 to 2035
- Figure 74: East Asia Market Attractiveness Analysis by Application
- Figure 75: East Asia Market Value Share and BPS Analysis by End Use Industry, 2025 and 2035
- Figure 76: East Asia Market Y-o-Y Growth Comparison by End Use Industry, 2025 to 2035
- Figure 77: East Asia Market Attractiveness Analysis by End Use Industry
- Figure 78: South Asia Market Value Share and BPS Analysis by Country, 2025 and 2035
- Figure 79: South Asia Market Value Share and BPS Analysis by Grade, 2025 and 2035
- Figure 80: South Asia Market Y-o-Y Growth Comparison by Grade, 2025 to 2035
- Figure 81: South Asia Market Attractiveness Analysis by Grade
- Figure 82: South Asia Market Value Share and BPS Analysis by Form, 2025 and 2035
- Figure 83: South Asia Market Y-o-Y Growth Comparison by Form, 2025 to 2035
- Figure 84: South Asia Market Attractiveness Analysis by Form
- Figure 85: South Asia Market Value Share and BPS Analysis by Application, 2025 and 2035
- Figure 86: South Asia Market Y-o-Y Growth Comparison by Application, 2025 to 2035
- Figure 87: South Asia Market Attractiveness Analysis by Application
- Figure 88: South Asia Market Value Share and BPS Analysis by End Use Industry, 2025 and 2035
- Figure 89: South Asia Market Y-o-Y Growth Comparison by End Use Industry, 2025 to 2035
- Figure 90: South Asia Market Attractiveness Analysis by End Use Industry
- Figure 91: Oceania Market Value Share and BPS Analysis by Country, 2025 and 2035
- Figure 92: Oceania Market Value Share and BPS Analysis by Grade, 2025 and 2035
- Figure 93: Oceania Market Y-o-Y Growth Comparison by Grade, 2025 to 2035
- Figure 94: Oceania Market Attractiveness Analysis by Grade
- Figure 95: Oceania Market Value Share and BPS Analysis by Form, 2025 and 2035
- Figure 96: Oceania Market Y-o-Y Growth Comparison by Form, 2025 to 2035
- Figure 97: Oceania Market Attractiveness Analysis by Form
- Figure 98: Oceania Market Value Share and BPS Analysis by Application, 2025 and 2035
- Figure 99: Oceania Market Y-o-Y Growth Comparison by Application, 2025 to 2035
- Figure 100: Oceania Market Attractiveness Analysis by Application
- Figure 101: Oceania Market Value Share and BPS Analysis by End Use Industry, 2025 and 2035
- Figure 102: Oceania Market Y-o-Y Growth Comparison by End Use Industry, 2025 to 2035
- Figure 103: Oceania Market Attractiveness Analysis by End Use Industry
- Figure 104: MEA Market Value Share and BPS Analysis by Country, 2025 and 2035
- Figure 105: MEA Market Value Share and BPS Analysis by Grade, 2025 and 2035
- Figure 106: MEA Market Y-o-Y Growth Comparison by Grade, 2025 to 2035
- Figure 107: MEA Market Attractiveness Analysis by Grade
- Figure 108: MEA Market Value Share and BPS Analysis by Form, 2025 and 2035
- Figure 109: MEA Market Y-o-Y Growth Comparison by Form, 2025 to 2035
- Figure 110: MEA Market Attractiveness Analysis by Form
- Figure 111: MEA Market Value Share and BPS Analysis by Application, 2025 and 2035
- Figure 112: MEA Market Y-o-Y Growth Comparison by Application, 2025 to 2035
- Figure 113: MEA Market Attractiveness Analysis by Application
- Figure 114: MEA Market Value Share and BPS Analysis by End Use Industry, 2025 and 2035
- Figure 115: MEA Market Y-o-Y Growth Comparison by End Use Industry, 2025 to 2035
- Figure 116: MEA Market Attractiveness Analysis by End Use Industry
- Figure 117: Global Market - Tier Structure Analysis
- Figure 118: Global Market - Company Share Analysis
- FAQs -
What was the Global Sodium Nitrite Market Size Reported by Fact.MR for 2024?
The global sodium nitrite market was valued at USD 259.9 million in 2024.
Who are the Major Players Operating in the Sodium Nitrite Market?
Prominent players in the market are BASF, Sumitomo Chemical Co. Ltd., Merck KGaA, American Elements, Shandong Fengyuan Chemical Co. Ltd., among others.
What is the Estimated Valuation of the Sodium Nitrite Market in 2035?
The market is expected to reach a valuation of USD 644.2 million in 2035.
What Value CAGR did the Sodium Nitrite Market Exhibit Over the Last Five Years?
The historic growth rate of the sodium nitrite market was 8.1% from 2020 to 2024.