


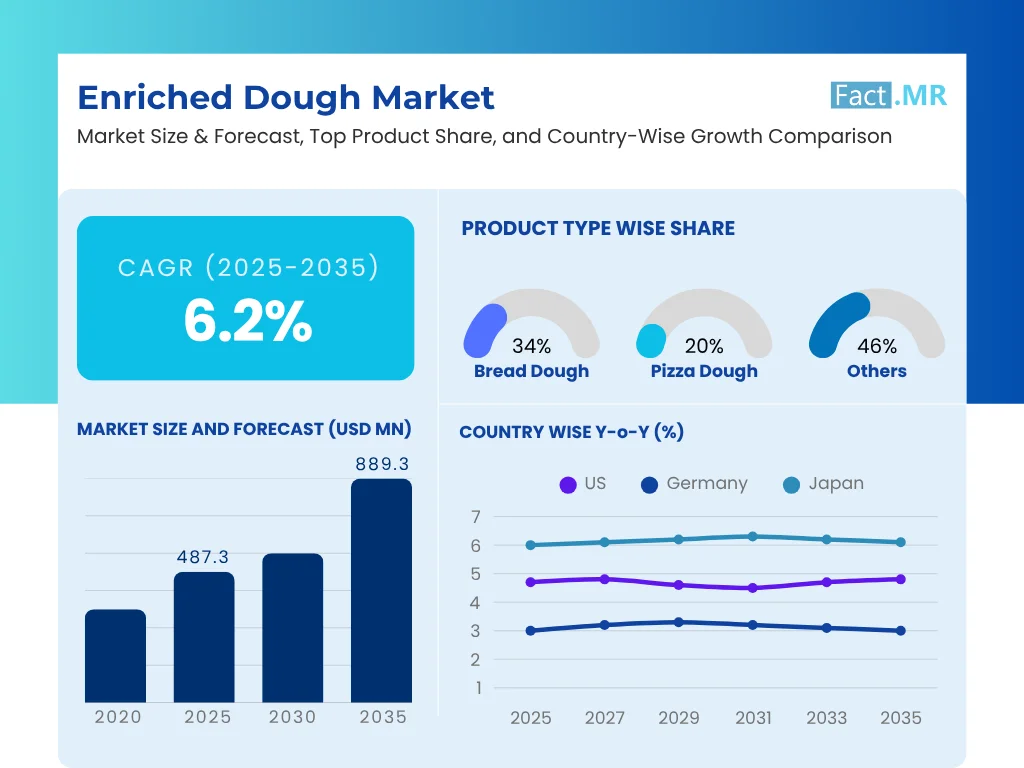
- Base Value(2024): 466.3 Mn
- Forecast Value (2035): 889.3 Mn
- CAGR (2035): 6.2%
Enriched Dough Market Outlook (2025 to 2035)
The global enriched dough market is expected to reach USD 889.3 million by 2035, up from USD 466.3 million in 2024. During the forecast period (2025 to 2035), the industry is projected to grow at a CAGR of 6.2%. Nourishing food choices across various bakery items are one of the key factors driving the market revenue growth. New bakery technologies and the increased demand for understanding food quality are also contributing to adoption.
Specialty as well as everyday consumers have a preference for enriched dough, which has ensured its regular use in all artisanal bakeries, commercial bakeries, and the foodservice industry in general.
What is driving the rising global demand for fortified and functional products in the Enriched Dough Market?
Some of the growth factors driving the enriched dough market include growing awareness of health, bakery product premiumization, and the demand for convenient yet wholesome foods. Food, which distributes both taste and functional advantages, is what the consumers are giving importance to, and enriched dough has it naturally.
This thriving foodservice sector, along with the growing consumption of bakery goods among people of all ages, continues to boost demand. The enriched recipe has gained popularity as people have taken an interest in products made using artisanal and traditional baking methods. The accessibility of refrigeration and frozen storage facilities has enabled products made from enriched dough to be distributed and have a longer shelf life.
What are the emerging consumer and product trends shaping the global Enriched Dough Market today?
The drivers in the enriched dough market are the rising demand for clean-label and organic recipes, the increasing consumption of plant-based ingredients, and the growing preference for artisan baking. There is also growing innovation in fillings and flavors, which, in many cases, are constrained by regional preferences and what people choose to eat.
Combined traditional baked goods, e.g., enriched with the usual traditional dough, and contemporary wellness trends, e.g., those with reduced sugar content or those enriched with added substances, are becoming increasingly popular. E-commerce and in-store bakeries that provide freshly baked or ready-to-bake enriched dough products are also influencing consumer buying behavior. In general, the market becomes consistent with trends related to the personalization, sustainability, and transparency of the ingredients.
What key factors are restraining the growth of the global Enriched Dough Market in 2025?
Although the market has been moving in a positive direction, the enriched dough market faces several constraints. There is a high perishability and a demand for controlled storage condition that poses logistical and cost issues. Rich ingredients also increase production costs, which can be reflected in terms of pricing and consumer access. Reformulation, whether clean-label or vegan, can be technologically challenging and may require modifications to the product's texture and taste.
Additionally, innovation may be limited by regulatory restrictions on food labeling and food additives in certain regions. Health-conscious consumers who have a low view of sugar and fat content might also regard enriched dough products in a poor light until they are reformulated with healthy functional substitutes.
Which regions are experiencing the leading growth in the Enriched Dough Market, and what’s driving it?
North America will continue to be a key demographic area where enriched dough will sell well, driven by a firm market need for fortified and artisanal food products. The U.S. is a leader in strong food infrastructure, consumer demand for high-quality baked products, and extensive retail distribution, which is facilitated by packaging and shelf-stable dough innovations.
East Asia is emerging as a booming market, driven by urbanization, surging incomes, and increased adoption of Western-style bakery products. Consumers are becoming increasingly nutrition-conscious and prefer products enriched with fiber and vitamins. This is complemented by the fact that the foodservice infrastructure is being expanded, and even dietary habits have changed in a way that the region has more opportunities regarding increased consumption of enriched dough products.
Western Europe, the land of strong bread culture, is a crucial market for enriched dough. There is a high demand in countries such as France and Germany for organic and artisanal products. EU food regulations aim to enhance clean-label and health-based formulas, whereas innovations in gluten-free and vegan doughs increase market potential across various consumer categories.
Country-Wise Outlook
Health-Conscious Consumers and Functional Ingredients Boost U.S. Enriched Dough Market
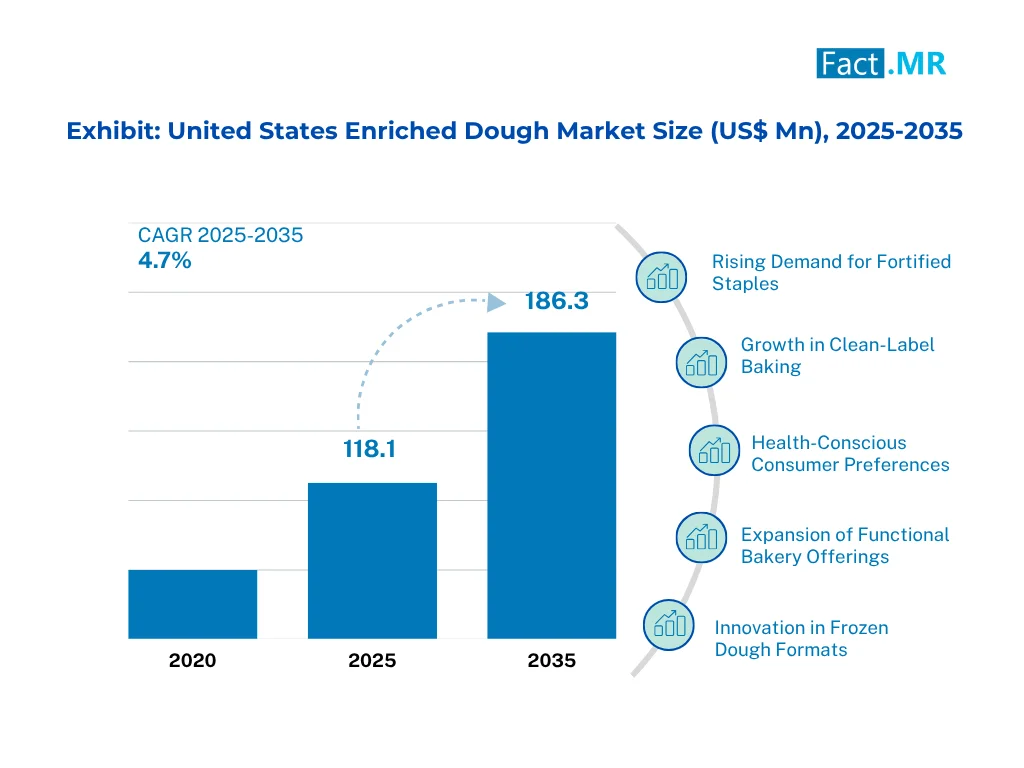
The U.S. enriched dough market is picking up a healthy pace due to an increase in consumer demand for nutrient-enriched, fortified bakery items. Health trends are driving innovation in formulations by adding vitamins, minerals, proteins, and other nutrients. Large bakery companies are taking advantage of this by using clean-label ingredients to meet the changing dietary trends.
In addition, the growing artisanal and organic bread industries have led to increased production of high-end enriched doughs. An extensive network of retailing serves this market, with a well-established frozen dough market within the convenience products sector.
Clean-Label Movement and Artisan Baking Culture Elevate Germany’s Enriched Dough Market
The German market for enriched dough experiences stable growth, driven by demand for clean-label products and traditional artisanal baking skills. There is a growing trend toward the use of whole grains, natural sweeteners and vegetal enrichments by bakers to satisfy health-sensitive demand. The market demonstrates a robust demand for organic certifications, as well as the traceability of ingredients' sources.
Regional bakeries also focus on freshness and Artisan quality, which results in high-protein and fiber-enriched dough products. The German reputation for bread-baking and contemporary nutrition education positions it at a central point within the European enhanced dough market.
Aging Population and Convenience Trends Stimulate Japan’s Enriched Dough Market
The enriched dough market in Japan is growing due to changes in the population and increased demand for convenient and healthier bakery products. As people grow old, the need for enriched products to increase their intake of calcium, iron, and dietary fiber has swelled.
Ready-to-eat, portion-controlled baked goods are also of interest to Japanese consumers, which has contributed to the innovation of frozen and pre-packed doughs. The combination of traditional Japanese flavors and the enriched products in Western-style bakery also increases the scope. The Japanese are also known for delivering high-quality and functional food products through the use of precise technological accuracy in dough preparation.
Category-Wise Market Outlook
Whole Grain Flour Accelerates Enriched Dough Growth Amid Rising Wellness Demand and Regulatory Backing in Urban Markets
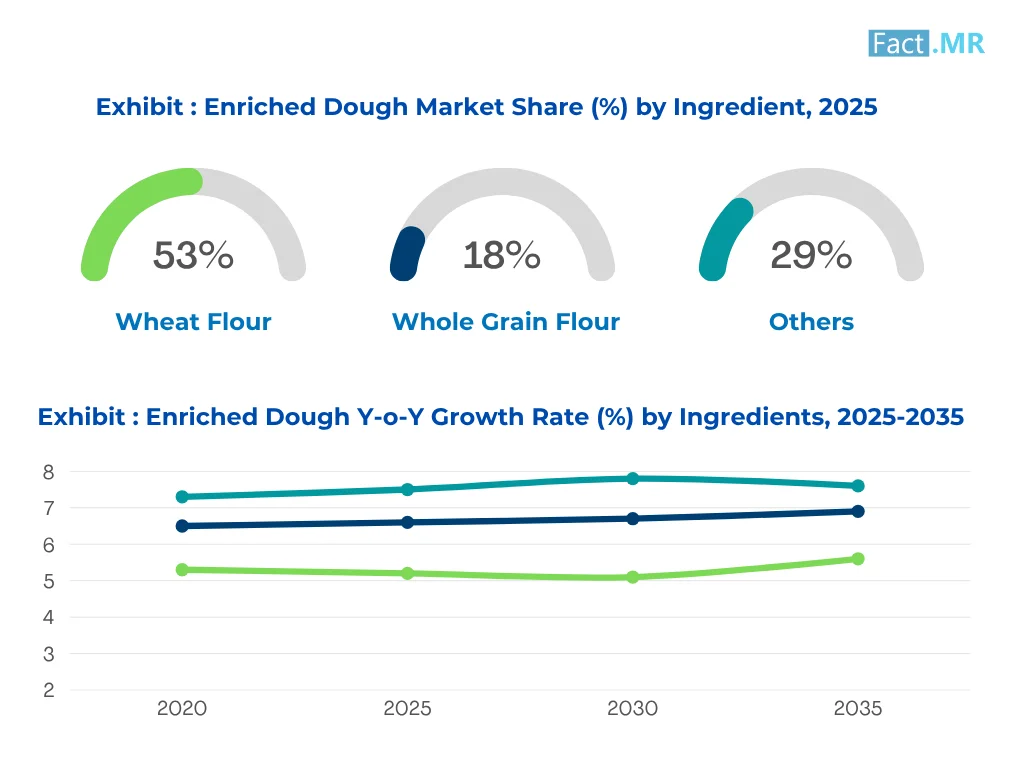
The whole grain flour segment is gaining traction as consumers demand healthier foods. It is fibrous and rich in many nutrients, making it attractive to a health-conscious customer group. Manufacturers are also adding it to the dough recipe to align with the wellness trend. Its uptake is also gaining momentum with regulatory approvals promoting whole grains, particularly in cities and developed markets that focus on the consumption of balanced diets.
Cloud-Native Pizza Dough Leads Enriched Segment Expansion with Health-Conscious Variants and Rising Frozen Demand
The pizza dough segment is growing rapidly, as people find it easy and convenient, offering a diverse product. There is an increase in demand in foodservice and retail, particularly for frozen and ready-to-bake versions. New products such as high-protein or gluten-free enriched doughs are widening the horizon of consumers. The widespread presence of pizza and its ability to adapt to changes in health conditions are the reasons behind its rapid market penetration.
Foodservice Segment Surges as Urban Restaurants Elevate Menus with Nutrient-Enriched Baked Offerings
The peak growth is in foodservice (Hotels, Restaurants, and Cafes) where consumer is shifting back to restaurant visits. Restaurants are selling fortified baked food to appeal to conscious eaters. The availability of nutrient-enriched selections, such as vitamin-packed buns and artisan breads, makes restaurants more distinguished. This prevalence can be observed in urban areas, as cities with higher-priced food and a focus on healthy menus are becoming increasingly popular.
Competitive Analysis
Competitive Outlook: Enriched Dough Market
The global enriched dough market is experiencing stable growth, driven by the increased usage of fortified and functional bakery products, including brioche, enriched rolls, and cookies. Main competitors include Grupo Bimbo, Nestle, General Mills, Conagra Brands, and Aryzta AG, which utilize their extensive offerings of frozen dough and high distribution networks as advantages.
The major achievements of Grupo Bimbo are its powerful global capabilities and business sustainability, followed by Nestle and General Mills, which leverage their healthier and conveniently frozen foods and dough products. Conagra positions itself as the innovative producer of snackable frozen baked goods, while Aryzta AG focuses on the high-quality HoReCa sectors of the market, offering artisan-type enriched pastries.
Key players of the enriched dough industry are Grupo Bimbo SAB de CV, Nestlé SAB, General Mills, Inc., Conagra Brands, Inc., Aryzta AG, Mondelez International, Inc., Rich Products Corporation, Cargill, Inc., Lantmännen Unibake, and Dawn Foods Global.
Recent Development
- In January 2025, BDF Ingredients introduced OHLIVE ANTIOX, a natural hydroxytyrosol-based antioxidant tailored for enriched doughs, extending shelf life without off-flavors.
- In March 2024, DeIorio’s and Upcycled Foods launched the ReGrained SuperGrain Upcycled Flour Dough Ball, a fortified pizza dough enriched with plant protein and fiber, delivering 3.5× more fiber and 2× more protein while reducing waste.
Fact.MR has provided detailed information about the price points of key manufacturers in the enriched dough market, positioned across regions, including sales growth, production capacity, and speculative technological expansion, in the recently published report.
Methodology and Industry Tracking Approach
The 2025 global enriched dough market report by Fact.MR sets a new benchmark in strategic market intelligence, offering a precise, data-rich perspective on the evolving dynamics of enriched bakery formulations across global food systems. The report integrates insights from over 8,000 industry stakeholders across 30 countries, each contributing a minimum of 200 qualified responses-ensuring analytical depth, diversity, and regional relevance.
The respondent base was meticulously structured, with approximately two-thirds comprising end users and strategic decision-makers, including bakery R&D heads, product innovation managers, category leads, and procurement executives from global food and bakery brands. The remaining one-third included domain experts such as dough technologists, nutrition scientists, flour enrichment consultants, supply chain managers, and foodservice distributors operating in sectors like retail, health-focused FMCG, foodservice, and industrial baking.
Conducted over a 13-month period from June 2024 to May 2025, the study closely tracked shifts in enriched dough development-including trends in micronutrient fortification, clean-label innovation, frozen dough adoption, ingredient sourcing strategies, and dietary compliance standards. The data was weighted through advanced stratified modeling to reflect the true structure of industry roles and regional demand profiles.
Backed by over 250 verified sources-ranging from peer-reviewed studies and regulatory advisories to patent filings, innovation briefs, and production data-the report applies robust analytics, including multivariate regression, cluster analysis, and time-series forecasting, to generate high-confidence, actionable insights.
Having monitored the Enriched Dough Market since 2018, Fact.MR offers unmatched domain expertise. The 2025 edition is a mission-critical tool for commercial bakeries, food ingredient innovators, private-label manufacturers, investors, policy developers, and nutrition-focused food brands seeking to lead in the next generation of fortified, functional, and consumer-driven bakery solutions.
Segmentation of Enriched Dough Market Research
-
By Ingredient :
- Wheat Flour
- Whole Grain Flour
- Multigrain Flour
- Enrichment Additives
- Folic Acid
- Iron
- Niacin
- Thiamine
- Riboflavin
- Others (e.g., Calcium, Vitamin D)
-
By Product Type :
- Bread Dough
- Pizza Dough
- Pastry Dough
- Cookie Dough
- Rolls and Buns
- Biscuits and Scones
- Other Dough Types (e.g., Pretzels, Bagels)
-
By Application :
- Commercial Baking
- Foodservice (Hotels, Restaurants, Cafés)
- Retail/Household Use
- Industrial Use (Frozen Food Manufacturing, Packaged Meals)
-
By Distribution Channel :
- Supermarkets/Hypermarkets
- Convenience Stores
- Online Retail
- Specialty Bakeries
- Foodservice Distributors
-
By Region :
- North America
- Latin America
- Western Europe
- Eastern Europe
- East Asia
- South Asia & Pacific
- Middle East & Africa
- Frequently Asked Questions -
What was the Global Enriched Dough Market Size Reported by Fact.MR for 2024?
The global Enriched Dough Market was valued at USD 466.3 Million in 2024.
Who are the Major Players Operating in the Enriched Dough Market?
Prominent players in the market are are Grupo Bimbo S.A.B. de C.V., Nestlé S.A., General Mills, Inc., Conagra Brands, Inc., Aryzta AG, Mondelez International, Inc., Rich Products Corporation, Cargill, Incorporated, Lantmännen Unibake, and Dawn Foods Global.
What is the Estimated Valuation of the Enriched Dough Market in 2035?
The market is expected to reach a valuation of USD 889.3 Million in 2035.
What Value CAGR did the Enriched Dough Market Exhibit Over the Last Five Years?
The historic growth rate of the Enriched Dough Market was 4.3% from 2020 to 2024.