- Market Value (2025): USD 49.8 Bn
- Estimated Value (2026): USD 54.0 Bn
- Forecast Value (2036): USD 122.1 Bn
- CAGR (2026-2036): 8.5%
What is the Bio Based Textiles Market forecast to be worth by 2036?
USD 54.0 billion in 2026 to USD 122.1 billion by 2036 at 8.5% CAGR.
- The bio based textiles market reached USD 49.8 billion in 2025 as brands and textile processors reviewed renewable inputs for wider use.
- Demand is projected to rise from USD 54.0 billion in 2026 to USD 122.1 billion by 2036.
- The market is forecast to record 8.5% CAGR from 2026 to 2036 as fiber proof and mill fit guide adoption.
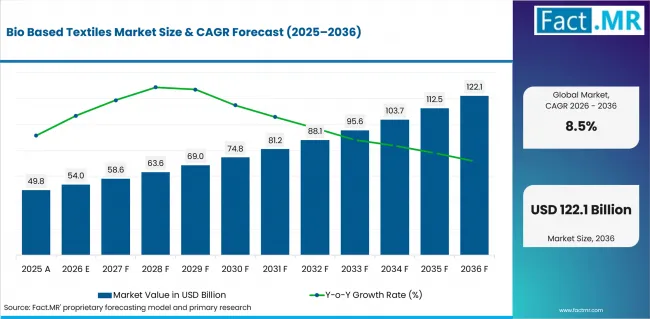
Bio Based Textiles Market Value Analysis | Source: Fact.MR
What are the defining numbers behind Bio Based Textiles Market growth?
USD 68.1 billion absolute opportunity by 2036.
- Demand Drivers in the Market
- Natural Bio-based Fibers are expected to gain priority when brands need renewable inputs that work inside existing spinning and finishing routes.
- Apparel programs are anticipated to create the first commercial test since clothing customers compare comfort with verified material origin.
- Plant-based source selection is projected to support approval when cotton and hemp fit familiar mill processes. Flax adds another route for durable fabric programs.
- Key Segments Analyzed
- By Fiber Type: Natural Bio-based Fibers are expected to hold 39.6% share in 2026 because they match the first replacement window for apparel and home textiles.
- By Application: Apparel is projected to account for 34.0% share in 2026 as comfort and label proof guide seasonal buying decisions.
- By Source: Plant-based is anticipated to capture 44.3% share in 2026 due to familiar cotton and hemp routes. Flax supports more durable programs.
- By End Use: Fashion & Apparel is estimated to represent 33.9% share in 2026 because public-facing brands face direct customer review.
- By Distribution Channel: Direct Sales are forecast to hold 39.0% share in 2026 as qualification depends on account-level sourcing decisions.
- Analyst Opinion at Fact.MR
- Shambhu Nath Jha, Sr. Consultant at Fact.MR, opines, “Bio based textiles must prove that renewable origin does not weaken comfort or repeat supply. Acceptance is expected to depend on verified fiber claims and mill-level fit.”
- Strategic Implications
- Fiber producers should present Natural Bio-based Fibers through the operating tests that mills understand.
- Converters should explain how Plant-based sources behave during spinning and dyeing.
- Investors should separate bio-based textile exposure from broad fashion claims.
The USA is expected to record an 11.1% CAGR from 2026 to 2036. Germany is projected at 10.0%. The UK is forecast at 9.0%. France is estimated at 8.0%. Japan is projected at 7.0%. Canada is expected to record a 6.0% CAGR. The spread reflects channel support and fiber proof.
How does the Bio Based Textiles Market break down by segment?
Natural Bio-based Fibers are expected to lead Fiber Type at 39.6% share in 2026. Apparel is projected to lead Application at 34.0% share in 2026.
Which Fiber Type dominates?
Natural Bio-based Fibers are projected to account for 39.6% share in 2026.
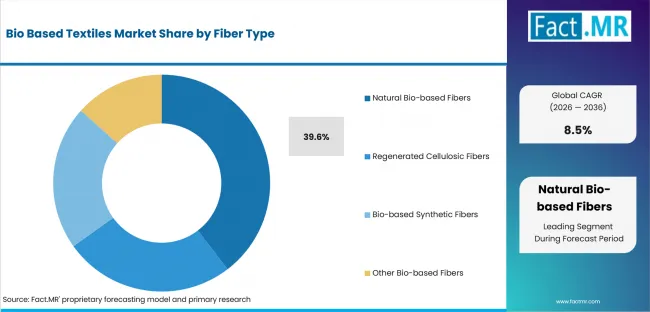
Bio Based Textiles Market Analysis By Fiber Type | Source: Fact.MR
Natural Bio-based Fibers lead when brands want a clear substitution route. Organic Cotton and Hemp Fiber serve certified apparel. Linen Fiber keeps a smaller role when texture or cost limits conversion.
What leads the Application segment?
Apparel is expected to hold 34.0% share in 2026.
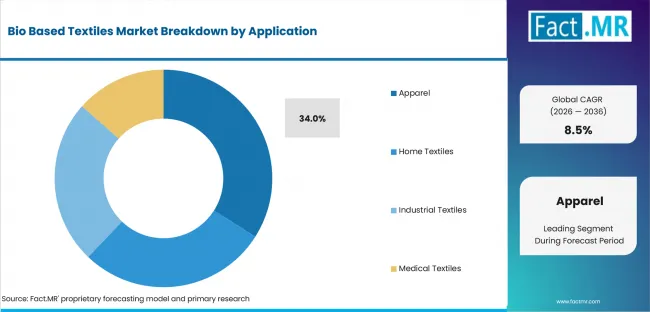
Bio Based Textiles Market Analysis By Application | Source: Fact.MR
Apparel leads because clothing brands face direct pressure to show fiber origin and fabric performance together. Casual Wear and Sportswear stay active when comfort is easy to test. Formal Wear grows more selectively.
How does Source shape demand?
Plant-based is anticipated to lead with 44.3% share in 2026.
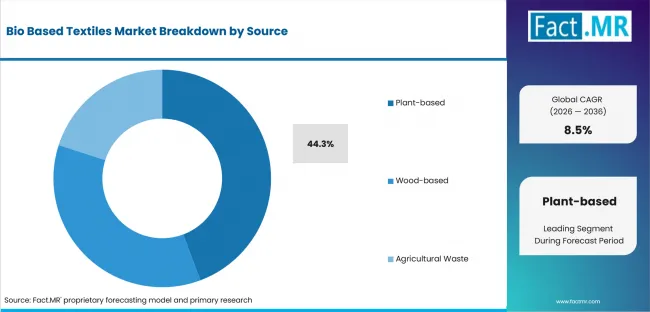
Bio Based Textiles Market Analysis By Source | Source: Fact.MR
Plant-based sources lead because cotton and hemp have better customer understanding than newer inputs. Flax and wood-based routes add choice for brands that need origin proof. Agricultural waste fibers stay more selective.
What supports Fashion & Apparel within End Use?
Fashion & Apparel is estimated to represent 33.9% share in 2026.
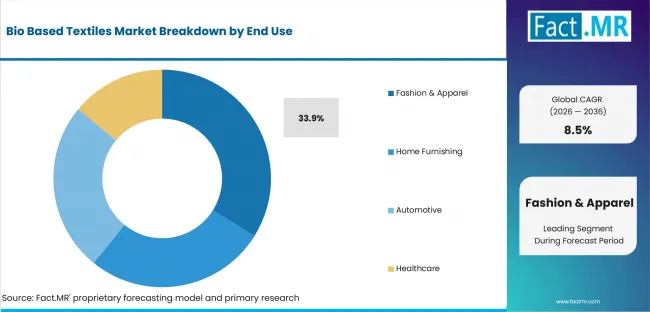
Bio Based Textiles Market Analysis By End Use | Source: Fact.MR
Fashion brands carry visible claim risk, so they review fiber origin before larger orders. Sportswear Manufacturers use renewable fibers when comfort is protected. Luxury Apparel takes longer.
What supports Direct Sales within Distribution Channel?
Direct Sales are forecast to hold 39.0% share in 2026.
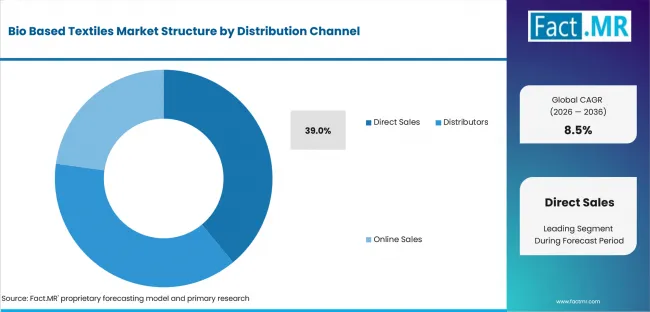
Bio Based Textiles Market Analysis By Distribution Channel | Source: Fact.MR
Large textile accounts usually ask for trials before order conversion. Direct contact gives fiber companies a cleaner route to answer mill questions. Distributors remain useful for smaller users.
What is accelerating Bio Based Textiles Market adoption, and what is holding it back?
Demand is expected to rise as companies replace traditional materials with renewable fibers and provide verified claims. Growth may be limited by higher costs and inconsistent documentation.
Drivers Impact Analysis
| DRIVER | (~) % IMPACT ON CAGR | GEOGRAPHIC RELEVANCE | IMPACT TIMELINE |
|---|---|---|---|
| Natural bio-based fiber substitution | +2.4% | Canada, Germany, USA | Short term (<= 2 years) |
| Apparel material qualification | +2.0% | Germany, France, UK | Short term (<= 2 years) |
| Plant-based source familiarity | +1.6% | Canada, USA, Japan | Medium term (2-4 years) |
| Brand traceability requirements | +1.3% | Europe and North America | Medium term (2-4 years) |
| Direct account technical support | +0.9% | Large apparel and home textile accounts | Long term (>= 4 years) |
Source: Fact.MR analysis. Updated Jul 30, 2026
- Natural bio-based fiber substitution: Brands are expected to test renewable fibers first when yarn count and handle stay close to known fabrics.
- Apparel material qualification: Fiber proof is tested beside comfort and wear performance. This makes apparel the first adoption window for many brands.
- Plant-based source familiarity: Cotton and hemp are easier to explain than newer feedstocks. Flax gives mills another route for durable yarn programs.
Opportunity Impact Analysis
| OPPORTUNITY | (~) % IMPACT ON CAGR | GEOGRAPHIC RELEVANCE | IMPACT TIMELINE |
|---|---|---|---|
| Bio-based specific yarn programs | +1.4% | Canada and Germany | Medium term (2-4 years) |
| Verified apparel renewal collections | +1.1% | USA, UK, France | Medium term (2-4 years) |
| Home textile conversion packages | +0.8% | Japan and Europe | Long term (>= 4 years) |
| Medical and hygiene textile pilots | +0.6% | Selective regulated accounts | Long term (>= 4 years) |
Source: Fact.MR analysis. Updated Jul 30, 2026
- Bio-based specific yarn programs: Known spinning and dyeing behavior is expected to give customers a clearer approval route.
- Verified apparel renewal collections: Fashion brands are expected to use limited lines before wider seasonal adoption. This route lowers launch risk.
- Home textile conversion packages: Bedding and upholstery programs create opportunity when fabric life and wash behavior are proven.
Restraints Impact Analysis
| RESTRAINT | (~) % IMPACT ON CAGR | GEOGRAPHIC RELEVANCE | IMPACT TIMELINE |
|---|---|---|---|
| Raw-material cost movement | -1.2% | Global | Short term (<= 2 years) |
| Mill process-change risk | -1.0% | Apparel and home textile accounts | Short term (<= 2 years) |
| Weak claim documentation | -0.8% | Europe and North America | Medium term (2-4 years) |
| Limited scale for newer fibers | -0.5% | Selective specialty applications | Long term (>= 4 years) |
Source: Fact.MR analysis. Updated Jul 30, 2026
- Raw-material cost movement: Customers delay conversion when renewable fibers carry a premium without matching garment value.
- Mill process-change risk: New fiber blends require trials before mills accept dyeing behavior and defect responsibility.
- Weak claim documentation: Adoption slows when brands cannot connect fiber origin with certificates and product labels.
Which countries are scaling Bio Based Textiles Market fastest?
The country comparison is led by the USA, followed by Germany and the UK. France and Japan form the next tier, while Canada shows the slowest listed CAGR. The total spread between the USA and Canada is 5.1 percentage points.
- The USA records the highest listed CAGR as brand substitution programs and fiber development activity support faster adoption.
- Germany ranks second because textile customers place greater weight on compliance proof and product documentation.
- The UK follows as fashion brands test renewable fibers through selective apparel renewal programs.
- France tracks the middle of the group as fashion customers value material provenance and fabric quality.
- Japan records a measured CAGR because quality consistency often matters more than fast material replacement.
- Canada remains in the comparison, but its listed pace is lower than the USA, Germany, the UK, France, and Japan.
Comparable CAGRs create different market entry conditions. Conversion timing depends on account proof and mill support. Production risk affects timing as well.
The full report provides country-level CAGR analysis across North America and Latin America. Europe and East Asia are covered alongside South Asia, Oceania and the Middle East and Africa.
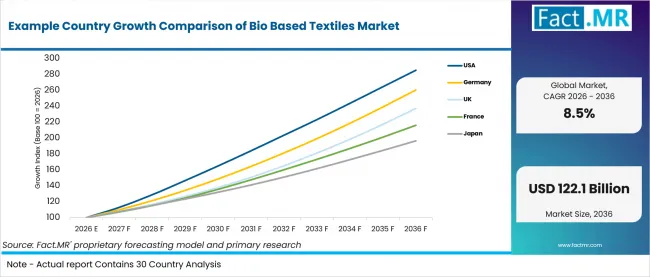
Example Country Growth Comparison Of Bio Based Textiles Market | Source: Fact.MR
| Country | CAGR (2026-2036) |
|---|---|
| USA | 11.1% |
| Germany | 10.0% |
| UK | 9.0% |
| France | 8.0% |
| Japan | 7.0% |
| Canada | 6.0% |
Source: Fact.MR analysis. Updated Jul 30, 2026
What is driving USA growth from 2026 to 2036?
11.1% CAGR, backed by brand substitution and fiber development activity.
USA demand is shaped by apparel brands that test targeted collections before wider sourcing decisions. Mills review processing behavior when they test new fiber blends, so reliable fiber proof and account-level support influence adoption.
How is Germany scaling demand?
10.0% CAGR, driven by material proof and compliance-led sourcing.
German textile customers review renewable fibers through disciplined qualification steps. Apparel and home textile users favor clear documents and stable fabric behavior.
How is the UK developing demand?
9.0% CAGR, driven by selective apparel renewal programs.
UK growth is expected to come through brands that need credible fiber stories and price control. Buyers favor materials that protect comfort during smaller launches.
How does France perform?
8.0% CAGR, led by fashion brand qualification.
France’s growth reflects fashion customers that value material provenance and fabric quality. Adoption is expected to move through premium collections first.
What supports Japan’s growth?
7.0% CAGR, backed by quality consistency and processing control.
Japan’s growth reflects customers that need stable hand feel, consistent yarn performance and documented material origin before wider adoption.
What supports Canada adoption?
6.0% CAGR, supported by retail review and service coverage.
Canada’s growth reflects renewable fiber programs across dispersed customers. Direct provider contact helps brands manage certification files and mill questions before switching established inputs.
Who leads the Bio Based Textiles Market?
Lenzing AG and Eastman Chemical Company are relevant through cellulosic fiber portfolios, while NatureWorks LLC strengthens the bio-based synthetic fiber landscape.
Lenzing AG supports the market through regenerated cellulosic fibers used in apparel and home textiles. Eastman Chemical Company contributes cellulosic textile materials with a focus on fabric performance and renewable content. NatureWorks LLC adds polylactic acid fiber capabilities for bio-based synthetic applications. Toray Industries, Inc. and Teijin Limited strengthen the field through advanced textile materials. Indorama Ventures Public Company Limited and BASF SE extend the competitive landscape through polymer, fiber and material technologies.
Which companies are the key providers?
Key companies include Lenzing AG; Toray Industries, Inc.; Indorama Ventures Public Company Limited; Teijin Limited; NatureWorks LLC; BASF SE; and Eastman Chemical Company.
- Lenzing AG
- Toray Industries, Inc.
- Indorama Ventures Public Company Limited
- Teijin Limited
- NatureWorks LLC
- BASF SE
- Eastman Chemical Company
Bibliography
- BASF SE. (2025, March 27). loopamid now commercially available: BASF starts up its first plant for recycled polyamide 6.
- Eastman Chemical Company. (2026, February 3). Eastman debuts Naia Lyte at Première Vision Paris.
- European Environment Agency. (2025, March 26). Circularity of the EU textiles value chain in numbers.
- Indorama Ventures Public Company Limited. (2025, May 27). Indorama Ventures expands deja™ portfolio to boost textile industry sustainability.
- Lenzing Group. (2026, March 19). “Lead Transformation – Generate Impact”: Lenzing presents its 2025 Annual and Sustainability Report.
This Report Answers
- The report provides strategic intelligence on Bio Based Textiles Market demand across Fiber Type and Application choices.
- Segment analysis covers Natural Bio-based Fibers and Apparel as the 2026 share leaders.
- Country outlook evaluates the USA, Germany, the UK, France, Japan, and Canada.
- Competitive analysis profiles Lenzing AG and Eastman Chemical Company alongside Toray Industries and Teijin Limited. NatureWorks LLC, BASF SE and Indorama Ventures complete the provider set.
- Distribution assessment covers Direct Sales and Distributors. Online Sales and OEM Supply complete the channel view alongside long-term contracts.
What does the Bio Based Textiles Market cover?
Bio based textiles are renewable fiber and fabric inputs used in apparel and home textiles. Industrial and medical uses are included when bio-based content shapes the purchase decision.
The market differs from general textile activity because value comes from documented renewable origin and processing fit. Conventional fossil-based fibers are used only for comparison.
What is included in the scope?
The scope includes Fiber Type and Application alongside Source and End Use. Distribution Channel and Region are covered. Bio-based synthetic fibers are included when renewable input matters.
Coverage spans apparel and home textiles. Industrial and medical textiles are included when product use depends on bio-based fiber selection.
What is excluded from the scope?
Products without a bio-based material link remain outside the scope of this market.
Footwear and accessories are excluded unless the textile material itself is the purchase focus. Textile machinery is excluded. Textile chemicals are excluded unless they directly support bio-based textile conversion.
How Was the Analysis Built?
The analysis draws on 120+ sources, 35+ company portfolios, 25+ countries, and more than 20 industry interviews.
- Primary Research: Primary research includes discussions with manufacturers, service providers, technology developers, distributors, end users, procurement teams, and subject-matter experts. These conversations examine purchasing priorities, product adoption, operational challenges, approval requirements, competitive positioning, and the factors that influence wider market acceptance.
- Desk Research: Desk research covers government statistics, regulatory publications, company filings, trade data, technical studies, industry associations, standards, public policy, and other authoritative sources. Every source used in the analysis is documented in the bibliography.
- Market Sizing and Forecasting: Market estimates combine historical performance, demand indicators, pricing and volume trends, segment shares, company participation, country-level growth, adoption patterns, investment activity, and barriers to market expansion.
- Data Validation and Update Cycle: Findings are validated by comparing primary interviews with public data, company activity, regulatory changes, trade patterns, and industry developments. Regular updates review new product launches, capacity changes, partnerships, approvals, procurement trends, and shifts in commercial adoption.
Segmentation
What is the report’s scope and coverage?
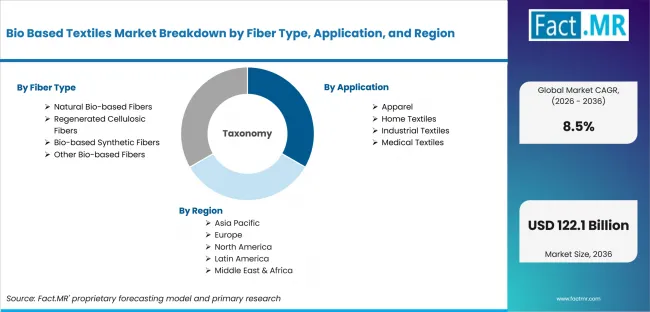
Bio Based Textiles Market Breakdown By Fiber Type, Application, And Region | Source: Fact.MR
| Attribute | Details |
|---|---|
| Quantitative Units | USD 54.0 billion in 2026 to USD 122.1 billion by 2036 at an 8.5% CAGR |
| Market Definition | Renewable fiber inputs for apparel; home textiles; industrial textiles; and medical textiles. |
| Fiber Type | Natural Bio-based Fibers; Organic Cotton; Hemp Fiber; Linen Fiber; Regenerated Cellulosic Fibers; Lyocell; Viscose; Modal; Bio-based Synthetic Fibers; Polylactic Acid Fiber; Bio-based Polyester; Bio-based Polyamide; Bamboo Fiber; Banana Fiber; Pineapple Leaf Fiber |
| Application | Apparel; Casual Wear; Sportswear; Formal Wear; Home Textiles; Bedding; Curtains; Upholstery; Industrial Textiles; Automotive Textiles; Geotextiles; Filtration Fabrics; Medical Textiles; Wound Care Textiles; Surgical Textiles; Hygiene Products |
| Source | Plant-based; Cotton; Hemp; Flax; Wood-based; Eucalyptus; Beech Wood; Bamboo Pulp; Agricultural Waste; Banana Fiber; Pineapple Leaf Fiber; Sugarcane Bagasse Fiber |
| End Use | Fashion & Apparel; Fashion Brands; Sportswear Manufacturers; Luxury Apparel; Home Furnishing; Home Decor; Bedding Manufacturers; Furniture Upholstery; Automotive; Seat Upholstery; Healthcare; Medical Clothing; Hospital Textiles; Personal Protective Textiles |
| Distribution Channel | Direct Sales; Textile Manufacturers; OEM Supply; Long-term Contracts; Distributors; Industrial Suppliers; Regional Dealers; Online Sales; B2B E-commerce; Manufacturer Websites; Digital Procurement Platforms |
| Regions Covered | North America; Latin America; Europe; East Asia; South Asia and Pacific; Middle East and Africa |
| Countries Covered | Canada; Germany; USA; UK; France; Japan |
| Key Companies Profiled | Lenzing AG; Toray Industries, Inc.; Indorama Ventures Public Company Limited; Teijin Limited; NatureWorks LLC; BASF SE; Eastman Chemical Company |
| Forecast Period | 2026 to 2036 |
| Approach | Hybrid approach using textile demand; renewable fiber adoption; segment shares; country growth; company portfolios and channel validation |
Source: Fact.MR analysis. Updated Jul 30, 2026
How is the market segmented?
-
By Fiber Type
- Natural Bio-based Fibers
- Organic Cotton
- Hemp Fiber
- Linen Fiber
- Regenerated Cellulosic Fibers
- Lyocell
- Viscose
- Modal
- Bio-based Synthetic Fibers
- Polylactic Acid Fiber
- Bio-based Polyester
- Bio-based Polyamide
- Other Bio-based Fibers
- Bamboo Fiber
- Banana Fiber
- Pineapple Leaf Fiber
- Natural Bio-based Fibers
-
By Application
- Apparel
- Casual Wear
- Sportswear
- Formal Wear
- Home Textiles
- Bedding
- Curtains
- Upholstery
- Industrial Textiles
- Automotive Textiles
- Geotextiles
- Filtration Fabrics
- Medical Textiles
- Wound Care Textiles
- Surgical Textiles
- Hygiene Products
- Apparel
-
By Source
- Plant-based
- Cotton
- Hemp
- Flax
- Wood-based
- Eucalyptus
- Beech Wood
- Bamboo Pulp
- Agricultural Waste
- Banana Fiber
- Pineapple Leaf Fiber
- Sugarcane Bagasse Fiber
- Plant-based
-
By End Use
- Fashion & Apparel
- Fashion Brands
- Sportswear Manufacturers
- Luxury Apparel
- Home Furnishing
- Home Decor
- Bedding Manufacturers
- Furniture Upholstery
- Automotive
- Interior Fabrics
- Seat Upholstery
- Door Panel Fabrics
- Healthcare
- Medical Clothing
- Hospital Textiles
- Personal Protective Textiles
- Fashion & Apparel
-
By Distribution Channel
- Direct Sales
- Textile Manufacturers
- OEM Supply
- Long-term Contracts
- Distributors
- Textile Distributors
- Industrial Suppliers
- Regional Dealers
- Online Sales
- B2B E-commerce
- Manufacturer Websites
- Digital Procurement Platforms
- Direct Sales
-
By Region
- North America
- Latin America
- Europe
- East Asia
- South Asia & Oceania
- Middle East and Africa
Frequently Asked Questions
Which Fiber Type leads the market?
Which Application leads the market?
Which Source category leads the market?
Which End Use leads the market?
Which Distribution Channel leads the market?
Which country records the highest listed CAGR?
What is the primary driver in this market?
What is the main restraint?
Why does Apparel lead demand?
Who worked on this report


Preview the report firsthand - request a free sample
Free SampleGet the brochure for pricing and purchase details
Download PDF