- Market Value (2025): USD 786.9 Mn
- Estimated Value (2026): USD 890 Mn
- Forecast Value (2036): USD 3048.0 Mn
- CAGR (2026-2036): 13.1%
What is the Biomass Coating Additives Market forecast to be worth by 2036?
USD 890 million in 2026 to USD 3048.0 million by 2036 at a 13.1% CAGR.
- The Biomass Coating Additives Market crossed a valuation of USD 786.9 million in 2025.
- Demand is projected to increase from USD 890 million in 2026 to USD 3048.0 million by 2036.
- The market is forecast to record 13.1% CAGR from 2026 to 2036 as paint formulators and ink makers qualify biomass-balanced additives for lower-fossil-carbon recipes.
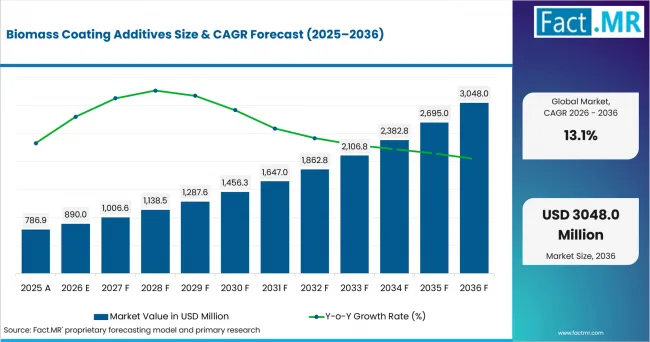
Biomass Coating Additives Value Analysis | Source: Fact.MR
What are the defining numbers behind Biomass Coating Additives Market growth?
USD 2158.0 million absolute opportunity by 2036, led by waterborne coatings and mass-balance bio-attributed grades.
- Demand Drivers in the Market
- Architectural paint formulators need renewable rheology control as waterborne wall paints require stable viscosity during mixing, tinting and roller application.
- Industrial coating producers need lower-fossil-carbon additive packages that pass durability and surface tests before a plant changes a trusted formulation.
- Ink makers need wetting and defoaming support for biomass-balanced recipes. In March 2025, Evonik introduced TEGO® Wet 270 eCO and TEGO® Foamex 812 eCO for coatings and inks.
- Packaging coating developers need additives that control surface behavior in waterborne films while keeping lamination, printability and blocking performance within customer limits.
- Key Segments Analyzed
- By Additive Family: Dispersants and wetting agents are expected to hold 28.0% share in 2026 because pigment wetting and dispersion stability are frequent approval points in paints and inks.
- By Renewable Attribution: Mass-balance bio-attributed additives are projected to account for 48.0% share in 2026 owing to easier substitution into existing recipes.
- By Coating System: Waterborne coatings are anticipated to capture 45.0% share in 2026 as lower-VOC paint lines need compatible defoamers, thickeners and dispersants.
- By Application: Architectural coatings are estimated to represent 31.0% share in 2026 due to high paint volumes and faster reformulation cycles.
- Analyst Opinion at Fact.MR
- Shambhu Nath Jha of Fact.MR states, “Biomass coating additives are drawing attention because they let formulators work inside recipes they already know. Demand is expected to move fastest when renewable attribution is paired with equal wetting, foam control and viscosity behavior. Suppliers that combine certification, low-carbon data and application testing are better placed with paint plants.”
- Strategic Implications
- Additive suppliers should document biomass attribution, product carbon footprint data and ASTM D6866 biobased-carbon testing in the same customer file.
- Paint manufacturers should qualify biomass grades first in waterborne architectural systems where formulation change cycles are shorter.
- Ink producers should test wetting, foam behavior and rub resistance together while protecting pressroom performance in lower-carbon formulations.
The USA is projected to record 16.6% CAGR through 2036, supported by construction-linked coatings and local specialty chemical capacity. France is expected to post 15.8% as decorative paint demand meets domestic bio-acrylate activity. The UK is forecast to advance at 13.5% through waterborne decorative coatings and renovation activity. Germany is anticipated to hold 12.7% with additive production and application testing depth. The Netherlands reaches 9.9% through waterborne know-how and European logistics access.
How does the Biomass Coating Additives Market break down by segment?
Dispersants and wetting agents lead at 28.0%; mass-balance bio-attributed grades lead at 48.0%.
Which Additive Family dominates?
Dispersants and wetting agents are expected to hold 28.0% share in 2026.
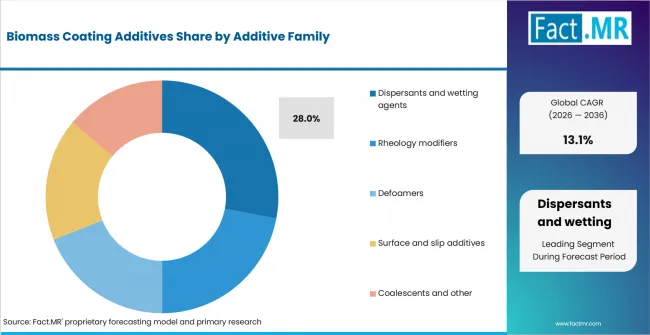
Biomass Coating Additives Analysis By Additive Family | Source: Fact.MR
Dispersants and wetting agents lead because pigment stabilization remains one of the earliest tests in any coating reformulation. A biomass additive has to disperse pigments consistently before formulators move to gloss, scrub or storage testing.
What leads the Renewable Attribution segment?
Mass-balance bio-attributed additives are projected to account for 48.0% share in 2026.
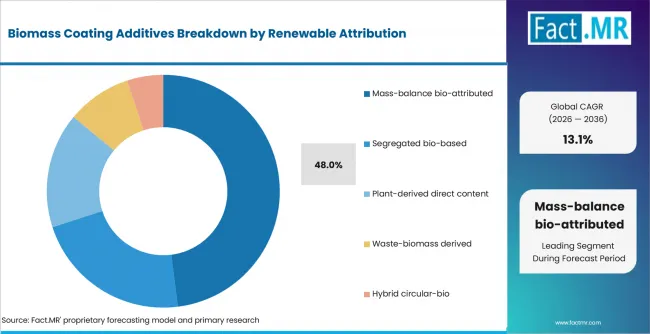
Biomass Coating Additives Analysis By Renewable Attribution | Source: Fact.MR
Mass-balance attribution leads because it helps chemical producers use existing assets and validated chemistries. Paint manufacturers can therefore lower fossil-carbon allocation while keeping the same additive function in the batch sheet.
How does Coating System shape demand?
Waterborne coatings are anticipated to capture 45.0% share in 2026.
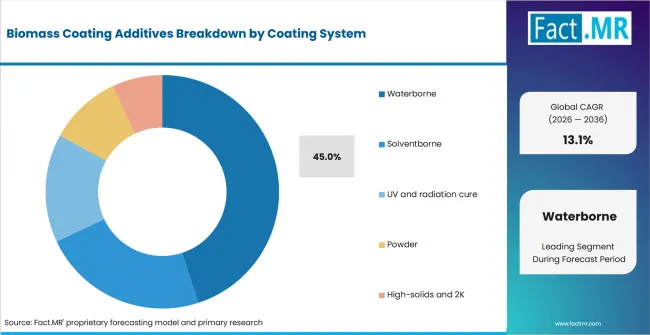
Biomass Coating Additives Analysis By Coating System | Source: Fact.MR
Waterborne systems lead because they depend heavily on additives for foam control, pigment dispersion, flow and surface leveling. Biomass grades that work in waterborne paints can reach architectural, industrial and packaging applications through existing binder platforms.
What supports Architectural demand within Application?
Architectural coatings are estimated to represent 31.0% share in 2026.
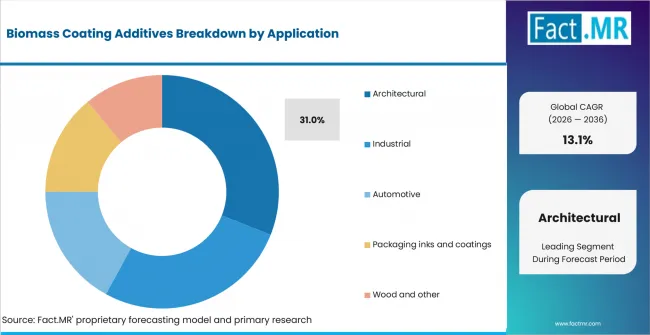
Biomass Coating Additives Analysis By Application | Source: Fact.MR
Architectural coatings lead because wall paints and exterior finishes move through larger production batches than niche coating systems. Formulators can also introduce renewable additives in premium and low-odor lines before extending them to broader ranges.
What is accelerating Biomass Coating Additives Market adoption, and what is holding it back?
Demand is expected to rise through renewable formulation targets and waterborne coating reformulation. Growth is constrained by qualification time, cost premiums and documentation requirements.
Drivers Impact Analysis
| DRIVER | (~) % IMPACT ON CAGR | GEOGRAPHIC RELEVANCE | IMPACT TIMELINE |
|---|---|---|---|
| Waterborne paint reformulation | +1.5% | Europe, North America | Short term (<= 2 years) |
| Mass-balance additive substitution | +1.2% | Europe, USA | Medium term (2-4 years) |
| Lower-fossil-carbon brand claims | +1.0% | Global | Medium term (2-4 years) |
| Packaging and ink conversion | +0.8% | Europe, East Asia | Long term (>= 4 years) |
Source: Fact.MR analysis. Updated Sep 4, 2026
- Waterborne paint reformulation: Lower-VOC decorative coatings are expected to lift demand for compatible wetting agents, defoamers and rheology modifiers that perform in water-rich systems.
- Mass-balance additive substitution: Certified mass-balance routes are projected to help producers offer biomass attribution while keeping familiar chemical structures and production processes.
- Lower-fossil-carbon brand claims: Paint and ink brands are anticipated to use biomass additive documentation to support product carbon footprint targets and customer disclosure needs.
Opportunity Impact Analysis
| OPPORTUNITY | (~) % IMPACT ON CAGR | GEOGRAPHIC RELEVANCE | IMPACT TIMELINE |
|---|---|---|---|
| Certified rheology modifiers for waterborne paints | +1.1% | Germany, UK, France | Short term (<= 2 years) |
| Bio-attributed wetting and defoaming packages | +0.9% | USA, Europe | Medium term (2-4 years) |
| Packaging inks and heat-seal coatings | +0.7% | Europe, Netherlands | Long term (>= 4 years) |
Source: Fact.MR analysis. Updated Sep 4, 2026
- Certified rheology modifiers for waterborne paints: Waterborne paint makers are expected to prioritize grades that keep viscosity control stable after renewable attribution is added.
- Bio-attributed wetting and defoaming packages: Additive producers are expected to build paired systems that let formulators test foam control and wetting together.
- Packaging inks and heat-seal coatings: Renewable additives are anticipated to gain use where waterborne coating layers need stable surface feel and low-foam processing.
Restraints Impact Analysis
| RESTRAINT | (~) % IMPACT ON CAGR | GEOGRAPHIC RELEVANCE | IMPACT TIMELINE |
|---|---|---|---|
| Long formulation qualification cycles | -0.6% | Global | Short term (<= 2 years) |
| Certified feedstock cost premium | -0.5% | Europe, North America | Medium term (2-4 years) |
| Chain-of-custody documentation burden | -0.4% | Europe | Medium term (2-4 years) |
Source: Fact.MR analysis. Updated Sep 4, 2026
- Long formulation qualification cycles: Additive changes are tested across viscosity, gloss, storage stability and application feel before a paint plant approves replacement.
- Certified feedstock cost premium: Biomass-attributed grades are expected to carry higher input costs where certified renewable raw materials are limited.
- Chain-of-custody documentation burden: Assessment and verification files are expected to lengthen approval work for decorative and performance coatings.
Which countries are scaling the Biomass Coating Additives Market through 2036?
- The country comparison spans 6.72 percentage points and forms three practical growth bands across the forecast period.
- The USA remains 0.83 percentage point above France through construction-linked coatings and specialty chemical capacity.
- France remains 2.29 percentage points above the UK as housing authorizations support decorative coating demand.
- The UK remains 0.84 percentage point above Germany through renovation activity and waterborne decorative paint rules.
- Germany remains 2.76 percentage points above the Netherlands through local additive production and formulation-testing depth.
- The Netherlands closes the displayed range with waterborne coating know-how and access to European chemical logistics.
Comparable CAGRs create different entry conditions due to construction activity, certification depth, additive production and formulation approval cycles. Full report coverage includes North America, Latin America, Western Europe, Eastern Europe, East Asia, South Asia & Pacific, Middle East & Africa.
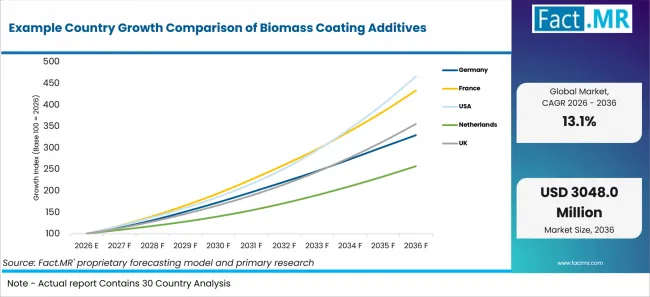
Example Country Growth Comparison Of Biomass Coating Additives | Source: Fact.MR
| Country | CAGR (2026-2036) |
|---|---|
| USA | 16.6% |
| France | 15.8% |
| UK | 13.5% |
| Germany | 12.7% |
| Netherlands | 9.9% |
Source: Fact.MR analysis. Updated Sep 4, 2026
What supports USA adoption?
16.6% CAGR, supported by construction-linked coatings and local specialty chemical capacity.
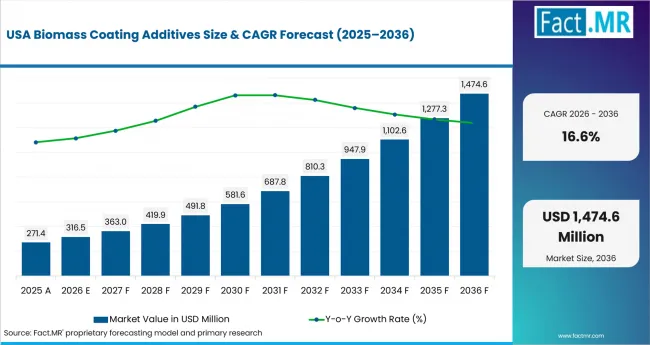
Biomass Coating Additives Country Value Analysis | Source: Fact.MR
U.S. formulators are expected to qualify biomass additives first in architectural coatings and industrial paint lines where buyers ask for lower fossil-carbon material files. The U.S. Census Bureau reported on September 1, 2026 that June 2026 construction spending was revised to USD 2,167.7 billion at a seasonally adjusted annual rate. That construction base gives biomass dispersants and rheology modifiers a clear path into repainting, renovation and contractor-grade coatings.
How is France scaling demand?
15.8% CAGR, led by housing authorizations and domestic bio-acrylate activity.
Housing permissions are expected to keep French architectural coatings active while additive suppliers expand bio-based acrylic choices. SDES reported on January 30, 2026 that 379,222 dwellings were authorized for construction in France in 2025. France is therefore well placed for biomass rheology modifiers and wetting agents used in decorative paint lines that require stable viscosity and reliable film appearance.
What supports the UK growth outlook?
13.5% CAGR, backed by renovation activity and waterborne decorative coatings.
Renovation-heavy channels are expected to shape UK demand for biomass additives in interior wall paints, wood coatings and maintenance products. The Office for National Statistics reported on August 13, 2026 that construction output growth in Great Britain for the three months to May 2026 was revised down to 1.5% from 1.6% in the previous publication. Waterborne paint producers can use that activity to qualify bio-based thickeners and low-foam additive packages in repainting-led ranges.
What is supporting Germany’s adoption?
12.7% CAGR, supported by additive production and formulation-testing depth.
German coating laboratories are expected to pair biomass additives with waterborne architectural paints and industrial surface-quality requirements. Destatis records 238,063 dwellings approved for construction in Germany in 2025 in its annual building-permits table. Local additive production, certification experience and applied testing capacity give paint manufacturers a structured route to approve renewable dispersants, defoamers and rheology modifiers.
How does the Netherlands perform?
9.9% CAGR, shaped by waterborne know-how and European logistics access.
Logistics access and waterborne coating know-how are expected to support Dutch demand across packaging, wood and decorative coating lines. Statistics Netherlands reported in February 2026 that nearly 80 thousand homes were added to the national housing stock in 2025. The Netherlands therefore offers a compact but practical market for biomass additives that move through European distribution channels and formulation service labs.
Who leads the Biomass Coating Additives Market?
BASF is active through biomass-based rheology modifiers and certified routes for additives used in architectural coatings. Its position reflects the value of established thickener chemistry where paint manufacturers need lower-fossil-carbon material files.
Evonik competes through mass-balanced wetting and defoaming additives for coatings and inks, including TEGO® Wet 270 eCO and TEGO® Foamex 812 eCO. BYK supplies bio-based coating additives, while Clariant offers Hostaphat™ 1309 MB Terra, a mass-balanced emulsifier produced under an ISCC PLUS-certified supply-chain model for applications including decorative paints and emulsion polymerization. Elementis supplies RHEOLATE® Biobased NiSAT rheology modifiers with more than 90% certified biobased carbon content.
Arkema expanded its European bio-based acrylic thickener program in April 2025, converting its Rheotech™, Thixol™ and Viscoatex™ ranges to grades containing up to 30% bio-based content while maintaining comparable performance. Rheology modifiers are important in waterborne coatings because they control viscosity, flow, application behavior and formulation stability.
Competitive differentiation is likely to increasingly reflect renewable-content certification, formulation performance and technical application support as suppliers expand lower-carbon coating-additive portfolios.
Which companies are the key providers?
Key companies include BASF, Evonik, BYK, Clariant, Arkema and Elementis.
- BASF
- Evonik
- BYK
- Clariant
- Arkema
- Elementis
Bibliography
- BASF. (2025, June 10). BASF’s Rheovis® range transitions to bio-based Ethyl Acrylate (EA).
- Evonik Industries AG. (2025, March 12). Evonik Coating Additives launches first mass balanced products for coatings and inks.
- Arkema. (2025, April 10). Arkema announces bio performance rheology additives production in Europe.
- Clariant. (2026, April 30). Hostaphat 1309 MB Terra.
- Elementis. (2025, July 31). Elementis announces its 2025 interim results.
- Commission Decision (EU) 2025/2607 of 17 December 2025 establishing the EU Ecolabel criteria for decorative paints, varnishes, and related products, performance coatings and related products, and water-based aerosol spray paints and repealing Decision 2014/312/EU. (2025). Official Journal of the European Union.
- ISCC System GmbH. (2025, November 13). ISCC PLUS 203-2: Chain of custody (Version 1.1).
- REDcert GmbH. (2025, February 1). Scheme principles for the certification of sustainable material flows in the chemical industry (Version RC² 1.3.1).
- U.S. Census Bureau. (2026, September 1). Monthly construction spending, July 2026.
- Service des données et études statistiques. (2026, January 30). Construction de logements : résultats à fin décembre 2025 (France entière).
- Office for National Statistics. (2026, August 13). Construction output in Great Britain: June 2026, new orders and Construction Output Price Indices, April to June 2026.
- Statistisches Bundesamt (Destatis). (2026, February 18). Baugenehmigungen im Hochbau Deutschland.
- Statistics Netherlands. (2026, February 4). Growth of housing stock slows for third year in a row.
This Report Answers
- The report explains where biomass coating additives are used across additive family and renewable attribution. It also covers coating system and application.
- Segment analysis identifies the leading subsegments and the formulation reasons paint and ink producers prioritize them.
- Country analysis examines the listed markets and the construction or certification mechanisms supporting additive qualification.
- Competitive analysis reviews current providers across bio-based rheology and wetting. It also covers defoaming, surface control and coating resin support.
- Application analysis assesses how lower-fossil-carbon material files influence architectural, industrial and packaging coating decisions.
What does the Biomass Coating Additives Market cover?
The Biomass Coating Additives Market covers specialty ingredients used to improve the performance of paint, ink and coating formulations while adding renewable biomass content or certified biomass attribution. It includes dispersants and wetting agents used in liquid coatings. It also covers rheology modifiers, defoamers and surface additives across liquid and powder systems.
The assessment is adjacent coverage of coating additives, paint and coating systems and pigment wetting additives. Demand is assessed across additive function, chain-of-custody route, formulation system and application end use.
What is included in the scope?
The scope includes bio-based and biomass-attributed additives sold for coating performance roles. It covers additives used in powder coatings when renewable content or certified attribution is part of the commercial offer.
It also includes additive packages used in formulation additives and UV cure lacquers. The scope covers flame retardant coating additives when biomass attribution is tied to additive performance. Application coverage includes architectural and industrial coatings. It also covers automotive, packaging inks and wood coatings.
What is excluded from the scope?
The scope excludes base resins, pigments, solvents and fillers when they are sold without a biomass coating additive function. It also excludes finished paints when the additive value is bundled into a final coating brand with no separate additive sale.
General bio-based chemicals are outside the scope unless they are marketed for coating additive performance. Finished coating layers used in unrelated food, paper or textile markets are excluded unless the product is sold as a coating additive for paint, ink or surface-coating formulation.
How Was the Analysis Built?
The analysis draws on 120+ sources, 35+ company portfolios, 25+ countries, and more than 20 industry interviews.
- Primary Research: Primary research includes discussions with manufacturers, service providers, technology developers, distributors, end users, and subject-matter experts. These conversations examine purchasing priorities, product adoption, operational challenges, approval requirements, competitive positioning, and the factors that influence wider market acceptance.
- Desk Research: Desk research covers government statistics, regulatory publications, company filings, trade data, technical studies, industry associations, standards, public policy, and other authoritative sources. Every source used in the analysis is documented in the bibliography.
- Market Sizing and Forecasting: Market estimates combine historical performance, demand indicators, pricing and volume trends, segment shares, company participation, country-level growth, adoption patterns, investment activity, and barriers to market expansion.
- Data Validation and Update Cycle: Findings are validated by comparing primary interviews with public data, company activity, regulatory changes, trade patterns, and industry developments. Regular updates review new product launches, capacity changes, partnerships, approvals, and shifts in commercial adoption.
Segmentation
What is the report’s scope and coverage?
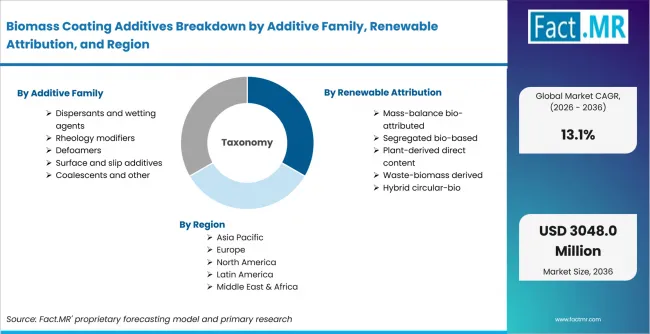
Biomass Coating Additives Breakdown By Additive Family, Renewable Attribution, And Region | Source: Fact.MR
| Attribute | Details |
|---|---|
| Quantitative Units | USD million in 2026 to USD million by 2036 at a CAGR. |
| Market Definition | Specialty additives used in paint, ink and coating formulations where renewable biomass content or certified biomass attribution supports lower fossil-carbon material claims. |
| Additive Family | Dispersants and wetting agents; Rheology modifiers; Defoamers; Surface and slip additives; Coalescents and other |
| Renewable Attribution | Mass-balance bio-attributed; Segregated bio-based; Plant-derived direct content; Waste-biomass derived; Hybrid circular-bio |
| Coating System | Waterborne; Solventborne; UV and radiation cure; Powder; High-solids and 2K |
| Application | Architectural; Industrial; Automotive; Packaging inks and coatings; Wood and other |
| Regions Covered | North America; Latin America; Western Europe; Eastern Europe; East Asia; South Asia & Pacific; Middle East & Africa |
| Countries Covered | USA; France; UK; Germany; Netherlands |
| Key Companies Profiled | BASF; Evonik; BYK; Clariant; Arkema; Elementis |
| Forecast Period | 2026 to 2036 |
| Approach | Hybrid top-down and bottom-up approach using coating production indicators, additive portfolio validation, certified renewable feedstock availability, application demand, country CAGR inputs and segment share review. |
Source: Fact.MR analysis. Updated Sep 4, 2026
How is the market segmented?
-
By Additive Family
- Dispersants and wetting agents
- Rheology modifiers
- Defoamers
- Surface and slip additives
- Coalescents and other
-
By Renewable Attribution
- Mass-balance bio-attributed
- Segregated bio-based
- Plant-derived direct content
- Waste-biomass derived
- Hybrid circular-bio
-
By Coating System
- Waterborne
- Solventborne
- UV and radiation cure
- Powder
- High-solids and 2K
-
By Application
- Architectural
- Industrial
- Automotive
- Packaging inks and coatings
- Wood and other
-
By Region
- North America
- Latin America
- Western Europe
- Eastern Europe
- East Asia
- South Asia & Pacific
- Middle East & Africa
Frequently Asked Questions
How big is the biomass coating additives market in 2026?
What is the CAGR of the biomass coating additives market from 2026 to 2036?
Which additive family leads the biomass coating additives market?
Which renewable attribution leads the biomass coating additives market?
Who are the leading companies in the biomass coating additives market?
Who worked on this report


Preview the report firsthand - request a free sample
Free SampleGet the brochure for pricing and purchase details
Download PDF