- Market Value (2025): USD 918.5 Mn
- Estimated Value (2026): USD 980.0 Mn
- Forecast Value (2036): USD 1874.4 Mn
- CAGR (2026-2036): 6.7%
What is the Biomass-Balanced Coating Additives Market forecast to be worth by 2036?
USD 980.0 million in 2026 to USD 1,874.4 million by 2036, at 6.7% CAGR.
- The Biomass-Balanced Coating Additives Market was valued at USD 918.5 million in 2025.
- Demand is projected to increase from USD 980.0 million in 2026 to USD 1,874.4 million by 2036.
- The market is forecast to record 6.7% CAGR from 2026 to 2036 as coating formulators and brand owners move toward certified lower-carbon additives.
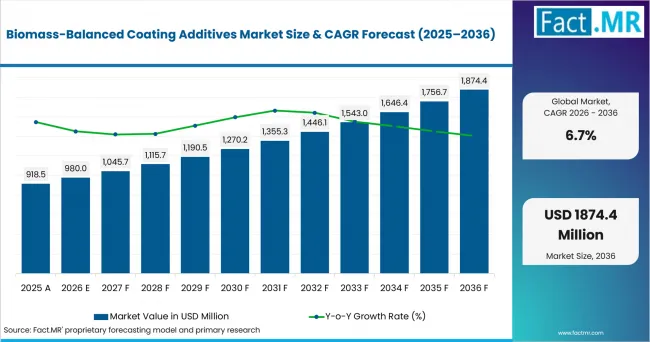
Biomass Balanced Coating Additives Market Value Analysis | Source: Fact.MR
What are the defining numbers behind Biomass-Balanced Coating Additives Market growth?
An absolute opportunity of USD 894.4 million is expected between 2026 and 2036.
- Demand Drivers in the Market
- Coatings formulators need drop-in additives that reduce product carbon footprint while preserving viscosity targets and application behavior.
- Paint manufacturers need chain-of-custody files that explain how renewable carbon is allocated to finished formulations.
- Architectural coating brands need waterborne additives with verified performance as low-emission labels move into product selection.
- BASF introduced three REDcert2-certified additives for architectural coatings in July 2026: Dispex AA 4145 MB, Rheovis PU 1333 MB and Rheovis HS 1169 MB.
- Wetting and foam-control choices influence finished coating quality because surface defects and filling losses reduce the value of lower-carbon reformulation work.
- Key Segments Analyzed
- By Additive Family: Dispersants and wetting agents are expected to hold 29.00% share in 2026 because pigment wetting and surface control remain close to coating performance.
- By Chain-of-Custody: ISCC PLUS mass balance is projected to account for 55.00% share in 2026 due to wider certification use across chemical value chains.
- By Coating Technology: Waterborne is anticipated to capture 47.00% share in 2026 since low-VOC architectural paints need stable rheology and dispersion control.
- By Customer Objective: Product carbon-footprint reduction is estimated to represent 43.00% share in 2026 owing to buyer pressure for measurable lower-carbon claims.
- Analyst Opinion at Fact.MR
- Shambhu Nath Jha, Principal Consultant at Fact.MR, states, "The commercial test in this market is documentation depth along with additive performance. Formulators are expected to favor products that keep the same handling profile while giving clear mass-balance evidence. Suppliers that combine PCF files, certification records and application support are better placed to pass customer approval."
- Strategic Implications
- Additive producers should keep biomass-balanced grades close to conventional product codes so formulators avoid extra performance qualification work.
- Paint brands should connect PCF reduction claims to named chain-of-custody systems and finished-product files during customer review.
- Distributors should train technical sales teams on ISCC PLUS and REDcert2 documentation so claim review stays close to the sales process.
- Coating plants should track batch-level documentation early because mass-balance claims depend on consistent evidence across the value chain.
The UK is forecast to post 8.3% CAGR through 2036 due to label-led reformulation and tighter VOC review. Germany reaches 7.6% as certified additive production expands. The USA records 7.2% through architectural coating scale. The Netherlands reaches 6.4% as building activity supports coating demand. Japan posts 6.0% as paint formulators balance documentation needs with careful qualification cycles.
How does the Biomass-Balanced Coating Additives Market break down by segment?
ISCC PLUS mass balance leads at 55.00%; Waterborne leads at 47.00%.
Which Additive Family dominates?
Dispersants and wetting agents hold 29.0% share in 2026.
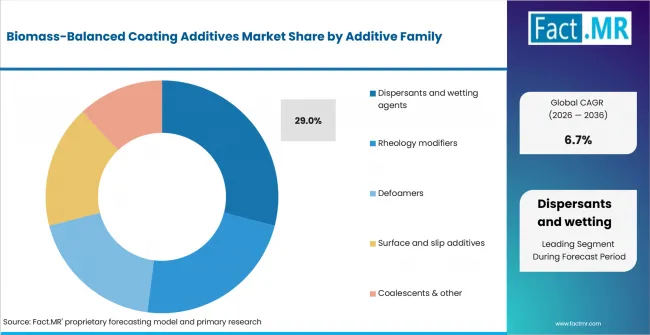
Biomass Balanced Coating Additives Market Analysis By Additive Family | Source: Fact.MR
Dispersants and wetting agents are expected to lead because biomass-balanced substitution must protect pigment stability and surface spread. Adjacent wetting and dispersing agents work shows why pigment-grind performance remains central in coating additive selection. Rheology modifiers follow where waterborne paints need flow control after renewable attribution changes raw-material accounting.
What leads the Chain-of-Custody segment?
ISCC PLUS mass balance holds 55.0% share in 2026.
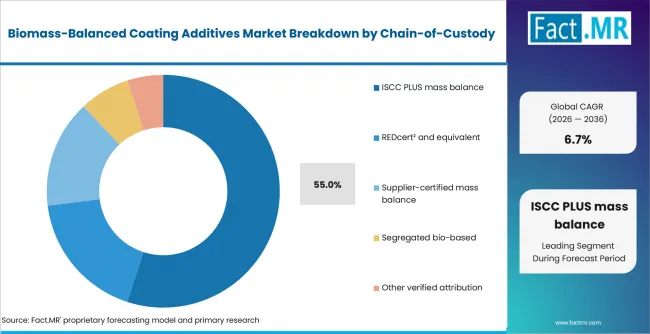
Biomass Balanced Coating Additives Market Analysis By Chain Of Custody | Source: Fact.MR
ISCC PLUS mass balance is projected to lead because it gives chemical producers a recognized route to allocate certified renewable inputs. REDcert2 and equivalent systems remain relevant in Europe. Formulators also compare these routes with broader coating additives qualification needs because documentation is reviewed beside application performance.
How does Coating Technology shape demand?
Waterborne holds 47.0% share in 2026.
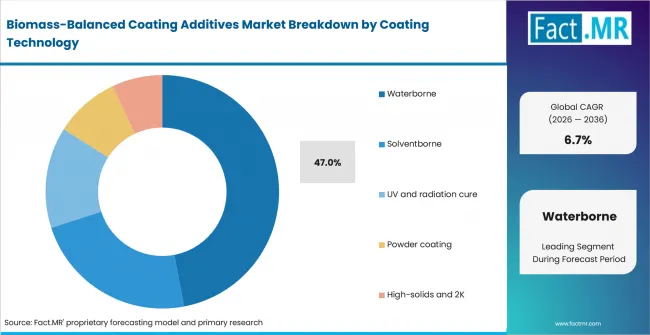
Biomass Balanced Coating Additives Market Analysis By Coating Technology | Source: Fact.MR
Waterborne coatings are anticipated to lead because additive changes must preserve viscosity and wetting in low-solvent formulations. Waterborne acrylic resin shows the same shift toward lower-solvent coating platforms. Solventborne systems still use biomass-balanced additives where industrial lines require familiar handling.
What supports Product carbon-footprint reduction within Customer Objective?
Product carbon-footprint reduction holds 43.0% share in 2026.
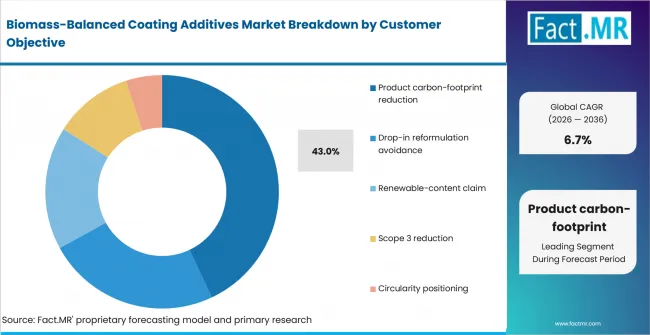
Biomass Balanced Coating Additives Market Analysis By Customer Objective | Source: Fact.MR
Product carbon-footprint reduction is estimated to lead because formulators want a measurable claim that survives customer review. Drop-in reformulation avoidance follows because many coating plants prefer familiar application tests. Arkema announced in January 2026 that it had added ten coating-solutions production sites to its ISCC PLUS-certified network during 2025, bringing certification to more than 70% of its coating facilities worldwide.
What is accelerating Biomass-Balanced Coating Additives Market adoption, and what is holding it back?
Certified carbon accounting drives it; qualification risk restrains it.
Drivers Impact Analysis
| DRIVER | (~) % IMPACT ON CAGR | GEOGRAPHIC RELEVANCE | IMPACT TIMELINE |
|---|---|---|---|
| Certified product carbon-footprint claims | +1.4% | Europe, North America | Short term (<= 2 years) |
| Drop-in reformulation needs | +1.1% | Global | Short term (<= 2 years) |
| Waterborne coating conversion | +0.9% | Europe, North America, Japan | Medium term (2-4 years) |
| Mass-balance certification expansion | +0.8% | Europe, Japan | Medium term (2-4 years) |
| Brand Scope 3 reduction programs | +0.6% | Global | Long term (>= 4 years) |
Source: Fact.MR analysis. Updated Sep 2, 2026
- Certified PCF claims: Coating brands increasingly seek traceable renewable attribution that supports product carbon-footprint assessment. Additives with clear certification and consistent performance can help manufacturers adjust attributed fossil-carbon content while maintaining established formulation and testing approaches.
- Drop-in reformulation needs: Formulators prefer additives that behave similarly to existing products in dispersion, foam control, and film formation. Drop-in performance gives certified renewable grades a clearer adoption path where manufacturers want to limit plant trials and formulation changes.
- Waterborne conversion: Lower-VOC coating systems place greater emphasis on dispersion stability, wetting, rheology, and flow control. Additives that perform reliably in aqueous formulations can receive stronger technical consideration as manufacturers expand waterborne coating portfolios.
- Certification expansion: Chain-of-custody certification can strengthen confidence in renewable-content claims and simplify customer qualification. Consistent certificate language helps regional coating manufacturers compare sustainability claims across waterborne resins, additives, and energy-curable coating materials.
- Scope 3 reduction programs: Coating manufacturers can use upstream raw-material choices to reduce product-level carbon footprints. Mass-balanced additives gain relevance where customers require traceable evidence supporting renewable feedstock attribution and broader Scope 3 reduction strategies.
Opportunity Impact Analysis
| OPPORTUNITY | (~) % IMPACT ON CAGR | GEOGRAPHIC RELEVANCE | IMPACT TIMELINE |
|---|---|---|---|
| Architectural coatings with BMB additives | +1.0% | Europe, USA | Short term (<= 2 years) |
| UV and radiation cure bio-attributed systems | +0.8% | USA, Europe, Japan | Medium term (2-4 years) |
| Powder coating attribution programs | +0.6% | Europe, USA | Medium term (2-4 years) |
| Verified additive bundles for waterborne systems | +0.5% | Global | Long term (>= 4 years) |
Source: Fact.MR analysis. Updated Sep 2, 2026
- UV and radiation cure systems: Energy-curable coatings create opportunities for bio-attributed resin and additive packages. These systems are particularly relevant where fast curing, efficient processing, and low-solvent coating technologies are already established.
- Powder coating attribution programs: Certified mass-balanced and bio-attributed materials can support sustainability programs in powder coatings and radiation-cure applications. Broader certification coverage across manufacturing locations can help suppliers serve multinational customers with more consistent renewable-content claims.
- Verified additive bundles: Paint manufacturers increasingly need several certified inputs within the same formulation. Bundled dispersants, defoamers, rheology modifiers, and related additives can simplify qualification and reduce review time for customers developing lower-carbon coating systems.
Restraints Impact Analysis
| RESTRAINT | (~) % IMPACT ON CAGR | GEOGRAPHIC RELEVANCE | IMPACT TIMELINE |
|---|---|---|---|
| Documentation burden in mass-balance claims | -0.6% | Europe, North America | Short term (<= 2 years) |
| Customer skepticism around attribution claims | -0.5% | Global | Medium term (2-4 years) |
| Qualification cycles for coating performance | -0.4% | Japan, USA, Europe | Medium term (2-4 years) |
| Premium cost against conventional grades | -0.3% | Global | Long term (>= 4 years) |
Source: Fact.MR analysis. Updated Sep 2, 2026
- Documentation burden: Mass-balance systems require verified records across certified inputs, allocation methods, and finished products. Smaller coating manufacturers may delay adoption when internal review teams need additional time to assess documentation and claim requirements.
- Customer skepticism: Product teams closely examine whether certification supports the intended formulation and customer-facing claim. Unclear or weak documentation can slow qualification and encourage buyers to remain with conventional grades until the claim pathway is better established.
- Qualification cycles: Even drop-in additives require storage, compatibility, processing, and application checks before commercial use. Buyers tend to move carefully where protective, industrial, or original-equipment coatings carry demanding performance requirements and warranty considerations.
- Cost premium: Certified renewable attribution can add audit, documentation, and input costs before manufacturers achieve a clear selling-price benefit. Adoption is therefore more selective in applications where customers prioritize basic coating performance and cost efficiency over sustainability-linked attributes.
Which countries are scaling the Biomass-Balanced Coating Additives Market through 2036?
- The country comparison spans 2.28 percentage points and forms three practical growth bands across the forecast period.
- The UK remains 0.74 percentage point above Germany through VOC review and repaint cycles.
- Germany remains 0.40 percentage point above the USA as certified additive supply and EU label rules shape formulation reviews.
- The USA remains 0.80 percentage point above the Netherlands through construction scale and architectural coatings.
- The Netherlands remains 0.34 percentage point above Japan as Benelux trade routes make certification files useful across borders.
- Japan closes the displayed range through careful qualification cycles and demand for stable waterborne coating performance.
Comparable CAGRs can create different entry conditions due to construction activity, certification acceptance, VOC rules and coating-plant approval behavior. Full report coverage includes North America, Latin America, Western Europe, Eastern Europe, East Asia, South Asia & Pacific, Middle East & Africa.
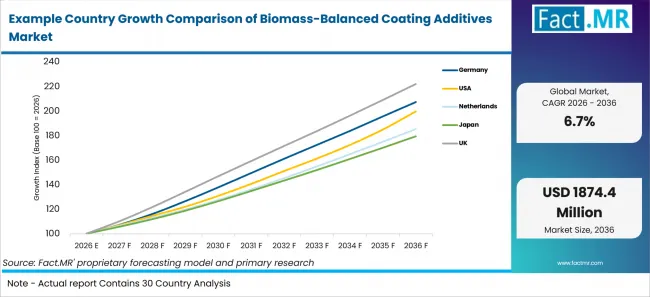
Example Country Growth Comparison Of Biomass Balanced Coating Additives Market | Source: Fact.MR
| Country | CAGR (2026-2036) |
|---|---|
| UK | 8.3% |
| Germany | 7.6% |
| USA | 7.2% |
| Netherlands | 6.4% |
| Japan | 6.0% |
Source: Fact.MR analysis. Updated Sep 2, 2026
What supports UK adoption?
8.3% CAGR, supported by VOC review and architectural repaint demand.
UK coating formulators evaluate biomass-balanced additives against familiar application properties before approving a product-code change. The Office for National Statistics reported in February 2026 that annual construction output increased 1.8% in 2025 compared with 2024, supporting activity across construction-related materials and finishing applications. The higher CAGR reflects that base and the need to document low-emission coating claims for retailer and contractor accounts.
What supports Germany adoption?
7.6% CAGR, driven by certified additive supply and construction order recovery.
German formulators benefit from local chemical expertise and a customer base that understands REDcert2 documentation. Destatis reported in February 2026 that real orders in main construction were 6.8% higher in 2025 than in 2024. That order recovery is expected to support architectural coating demand where certified additives can be qualified without changing paint performance.
What supports USA adoption?
7.2% CAGR, driven by architectural coating scale and PCF review.
U.S. coating producers start from a large construction base and established architectural paint channels. The U.S. Census Bureau reported in February 2026 that the value of construction in 2025 was USD 2,164.4 billion. That scale is expected to support selective BMB additive use in interior coatings and industrial maintenance systems.
How is the Netherlands developing demand?
6.4% CAGR, supported by building activity and cross-border certification use.
Dutch formulators operate in a market where Benelux supply routes often serve customers across nearby EU countries. Statistics Netherlands reported in February 2026 that permits were issued for almost 86,000 new homes in 2025. That building base is expected to keep architectural coatings active while certificate language is aligned for regional sales.
How does Japan perform?
6.0% CAGR, led by careful qualification and reliable coating performance.
Japanese paint producers tend to review additive changes carefully because finish quality and storage stability remain central to customer approval. Japan e-Stat reported in July 2026 that new dwelling starts reached 66,344 units in June 2026. The market is forecast to expand more gradually as formulators test BMB additives against existing application standards.
Who leads the Biomass-Balanced Coating Additives Market?
BASF SE is active through certified biomass-balanced additives for architectural coatings. Its additive range covers pigment wetting and rheology control for low-emission waterborne formulations. The company position is tied to formulation continuity because its BMB grades are designed to keep application behavior close to conventional products.
Evonik Industries AG is active in mass-balanced wetting and foam-control additives for coatings and inks. Clariant AG supports the market through its Terra products for paints and coatings, which use an ISCC PLUS-certified mass-balance supply-chain model.
Arkema S.A. adds certified coating-material depth across waterborne resins, rheology additives and energy-curable technologies. allnex GmbH supports adjacent certified coating systems through Powder Coating Resins and Radcure products. Competition therefore centers on documentation quality, application support and the ability to keep additive behavior close to existing grades.
Which companies are the key providers?
Key companies include BASF SE; Evonik Industries AG; Clariant AG; Arkema S.A.; and allnex GmbH.
- BASF SE
- Evonik Industries AG
- Clariant AG
- Arkema S.A.
- allnex GmbH
Bibliography
- BASF. (2026, July 13). BASF expands certified biomass-balanced additives portfolio for architectural coatings.
- Evonik. (2025, March 12). Evonik Coating Additives launches first mass balanced products for coatings and inks.
- Arkema. (2026, January 14). Arkema announces the ISCC PLUS certification of more than 70% of its coating facilities worldwide.
- allnex. (2025, November 3). allnex completes ISCC PLUS certification for Powder Coatings and Radcure products worldwide.
- Office for National Statistics. (2026, February 12). Construction output in Great Britain: December 2025, new orders and Construction Output Price Indices, October to December 2025.
- Statistisches Bundesamt (Destatis). (2026, February 25). KORREKTUR: Auftragseingang im Bauhauptgewerbe 2025 um 6,8 % höher als im Vorjahr.
- U.S. Census Bureau. (2026, February 27). Monthly construction spending, December 2025.
- Statistics Netherlands. (2026, February 4). Growth of housing stock slows for third year in a row.
- Statistics Bureau of Japan. (2026, July 31). New construction starts of dwellings (Number of dwelling units) (Total): June 2026 [Statistics Dashboard].
This Report Answers
- The report explains where biomass-balanced coating additives are used across additive family and coating technology, including links to broader paints and coatings formulation needs.
- Segment analysis identifies the leading subsegments and the operational reasons formulators prioritize them, from low-foam wetting agents to rheology-control choices.
- Country analysis examines the listed markets and the official statistics that support adoption across construction and architectural coating use. Related bio-based coatings coverage helps define the renewable-material context.
- Competitive analysis reviews current providers across certified additives, bio-attributed materials and mass-balance documentation. Adjacent release control additives show how surface-control functions shape supplier positioning.
- Application analysis assesses how PCF reduction, drop-in reformulation and Scope 3 reduction shape product selection. Packaging-adjacent bio barrier coatings illustrate where coating claims meet customer review.
What does the Biomass-Balanced Coating Additives Market cover?
The Biomass-Balanced Coating Additives Market covers specialty additives made or attributed through certified renewable feedstock routes. It includes dispersants, wetting agents, defoamers, rheology modifiers, surface additives and coalescents used in waterborne heat-seal coatings and other coating systems where additive function is separately identifiable.
The assessment also covers additive use in waterborne, solventborne, powder, UV and radiation cure systems. Relevant waterborne anti-block additives coverage helps frame how surface behavior and formulation approval intersect.
What is included in the scope?
The scope includes certified mass-balance additives and bio-attributed alternatives used in waterborne, solventborne, UV and radiation cure, powder coating, high-solids and 2K systems. It also includes supplier support that helps formulators document product carbon-footprint reduction.
It includes additives used by architectural coating brands, industrial coating producers, ink formulators and technical service teams when the product function remains tied to wetting, dispersion, foam control, rheology or surface modification.
What is excluded from the scope?
The scope excludes pigments, binders, finished paints, solvents sold without additive function and raw renewable feedstock production. Certification services are excluded when sold separately from a coating additive or additive-linked documentation package.
The market also excludes general carbon-accounting software, coating application equipment and unrelated bio-based chemicals outside additive use in paint or coating systems.
How Was the Analysis Built?
The analysis draws on 120+ sources, 35+ company portfolios, 25+ countries, and more than 20 industry interviews.
- Primary Research: Primary research includes discussions with manufacturers, service providers, technology developers, distributors, end users, and subject-matter experts. These conversations examine purchasing priorities, product adoption, operational challenges, approval requirements, competitive positioning, and the factors that influence wider market acceptance.
- Desk Research: Desk research covers government statistics, regulatory publications, company filings, trade data, technical studies, industry associations, standards, public policy, and other authoritative sources. Every source used in the analysis is documented in the bibliography.
- Market Sizing and Forecasting: Market estimates combine historical performance, demand indicators, pricing and volume trends, segment shares, company participation, country-level growth, adoption patterns, investment activity, and barriers to market expansion.
- Data Validation and Update Cycle: Findings are validated by comparing primary interviews with public data, company activity, regulatory changes, trade patterns, and industry developments. Regular updates review new product launches, capacity changes, partnerships, approvals, and shifts in commercial adoption.
Segmentation
What is the report's scope and coverage?
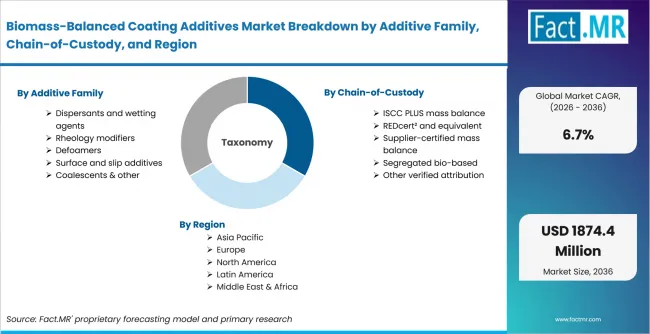
Biomass Balanced Coating Additives Market Breakdown By Additive Family, Chain Of Custody, And Region | Source: Fact.MR
| Attribute | Details |
|---|---|
| Quantitative Units | USD million |
| Market Definition | Biomass-balanced coating additives are specialty ingredients used in paint and coating formulations where certified renewable feedstock is allocated through a recognized chain-of-custody method. The scope covers additives used to control dispersion, wetting, foam, rheology, surface slip and coalescence. |
| Additive Family | Dispersants and wetting agents; Rheology modifiers; Defoamers; Surface and slip additives; Coalescents and other |
| Chain-of-Custody | ISCC PLUS mass balance; REDcert2 and equivalent; Supplier-certified mass balance; Segregated bio-based; Other verified attribution |
| Coating Technology | Waterborne; Solventborne; UV and radiation cure; Powder coating; High-solids and 2K |
| Customer Objective | Product carbon-footprint reduction; Drop-in reformulation avoidance; Renewable-content claim; Scope 3 reduction; Circularity positioning |
| Regions Covered | North America; Latin America; Western Europe; Eastern Europe; East Asia; South Asia & Pacific; Middle East & Africa |
| Countries Covered | UK; Germany; USA; Netherlands; Japan |
| Key Companies Profiled | BASF SE; Evonik Industries AG; Clariant AG; Arkema S.A.; allnex GmbH |
| Forecast Period | 2026 to 2036 |
| Approach | Hybrid top-down and bottom-up approach using additive function, coating technology, chain-of-custody model, customer objective, country adoption, supplier portfolio review and verified company activity. |
Source: Fact.MR analysis. Updated Sep 2, 2026
How is the market segmented?
-
By Additive Family
- Dispersants and wetting agents
- Rheology modifiers
- Defoamers
- Surface and slip additives
- Coalescents and other
-
By Chain-of-Custody
- ISCC PLUS mass balance
- REDcert2 and equivalent
- Supplier-certified mass balance
- Segregated bio-based
- Other verified attribution
-
By Coating Technology
- Waterborne
- Solventborne
- UV and radiation cure
- Powder coating
- High-solids and 2K
-
By Customer Objective
- Product carbon-footprint reduction
- Drop-in reformulation avoidance
- Renewable-content claim
- Scope 3 reduction
- Circularity positioning
-
By Region
- North America
- Latin America
- Western Europe
- Eastern Europe
- East Asia
- South Asia & Pacific
- Middle East & Africa
Frequently Asked Questions
How big is the biomass-balanced coating additives market in 2026?
What is the CAGR of the biomass-balanced coating additives market from 2026 to 2036?
Which chain-of-custody route leads the market?
Which coating technology leads demand?
Which companies are profiled in the biomass-balanced coating additives market?
Who worked on this report


Preview the report firsthand - request a free sample
Free SampleGet the brochure for pricing and purchase details
Download PDF