- Market Value (2025): USD 123.6 Mn
- Estimated Value (2026): USD 138.0 Mn
- Forecast Value (2036): USD 415.0 Mn
- CAGR (2026-2036): 11.6%
What is the Booth Engagement Sensors Market forecast to be worth by 2036?
USD 138.0 million in 2026 to USD 415.0 million by 2036, at a 11.6% CAGR.
- The market reached USD 123.6 million in 2025 as buyers increased spending on demand for event ROI evidence and booth-layout optimization.
- Demand is projected to rise from USD 138.0 million in 2026 to USD 415.0 million by 2036.
- The market is forecast to record a 11.6% CAGR from 2026 to 2036 as demand for event ROI evidence, sponsor measurement and staffing and content evaluation influence purchasing.
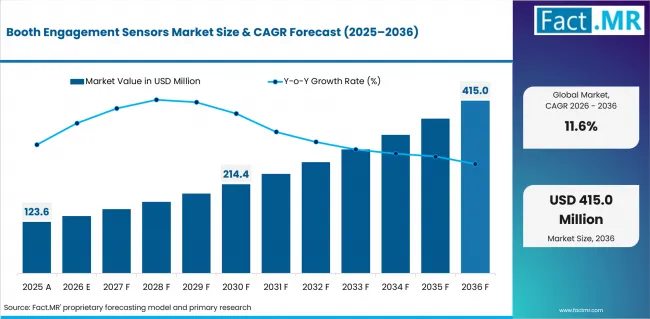
Booth Engagement Sensors Market Value Analysis | Source: Fact.MR
What are the defining numbers behind Booth Engagement Sensors Market growth?
USD 277.0 million absolute opportunity is expected by 2036.
- Demand Drivers in the Market
- Demand for event ROI evidence: Exhibitors spend heavily on floor space, booth construction, travel and staff, but many still judge performance through badge scans and sales-team impressions. Engagement sensors add a second layer of evidence by showing how many people entered, how long they stayed and which parts of the booth attracted attention. This helps teams compare event cost with actual visitor activity and decide which shows deserve a larger budget next year.
- Booth-layout optimisation: Visitor counts and movement data can show where a booth is working poorly. A busy entrance may hide a queue problem, while an expensive display at the back of the stand may receive little traffic. Heatmaps and dwell measurements allow exhibitors to move screens, demo tables or staff positions during the event and carry those lessons into the next booth design.
- Sponsor measurement: Sponsors increasingly want proof that their branded area was seen and used, not just included in event photographs. Sensors can measure visits to a sponsored zone, time spent near an activation and interactions with a display or product. These figures give organisers a clearer basis for sponsor reports and help justify renewal prices for future events.
- Staffing and content evaluation: Traffic patterns can show when a booth is busiest and whether staff coverage matches visitor demand. They can also reveal whether a live demonstration, speaker session or interactive display increases dwell time. Exhibitors can use this information to adjust shift schedules, repeat popular content and remove activities that attract attention but fail to hold it.
- Key Segments Analyzed
- By Sensor Type: Computer vision sensors is estimated to command 32.0% share in 2026. The segment benefits from its fit with measurement validity, privacy controls and the decisions that each metric is expected to improve.
- By Metric Captured: Visitor count is projected to hold 27.0% share in 2026. This position reflects its fit with measurement validity, privacy controls and the decisions that each metric is expected to improve.
- By Deployment: Temporary rental is expected to account for 34.0% share in 2026. Its lead comes from its fit with measurement validity, privacy controls and the decisions that each metric is expected to improve.
- By Buyer: Large exhibitors is anticipated to capture 31.0% share in 2026. The share is supported by its fit with measurement validity, privacy controls and the decisions that each metric is expected to improve.
- By Privacy Approach: Anonymous counting is forecast to represent 33.0% share in 2026. Buyer preference is shaped by its fit with measurement validity, privacy controls and the decisions that each metric is expected to improve.
- Analyst Opinion at Fact.MR
- "Buyers evaluating the Booth Engagement Sensors Market place measurement validity, privacy controls and the decisions that each metric is expected to improve ahead of feature volume. Suppliers should show where producing decision-grade engagement metrics while respecting privacy and the limits of sensor inference can fail and which checks control it. The strongest position belongs to suppliers that define responsibility before the event”, says Shambhu Nath Jha, Sr. Consultant, Fact.MR.
- Strategic Implications
- Event buyers: Buyers should begin with the decision they need to make. That could be changing the booth layout, increasing staff at busy hours or testing whether a product demonstration holds attention. Once that is clear, they can choose the simplest sensor that provides the required evidence. Counting visitors does not require the same level of tracking as analysing individual movement, so buyers should avoid collecting more data than the decision needs.
- Suppliers: Suppliers should state exactly what the package includes. The proposal should separate sensors, installation, software access, reporting, calibration and onsite support. It should also explain what happens when a sensor misses traffic, loses connection or produces inconsistent readings. Clear service boundaries make approval easier and prevent the exhibitor, agency and venue from blaming one another after the event.
- Venue and agency teams: Venues and agencies should not recommend one sensor package for every booth. Ceiling height, lighting, aisle width, wireless congestion and camera placement can all affect performance. They should test the system in the actual event setting, record where accuracy falls, and tell exhibitors which metrics are reliable enough to use in post-event decisions.
In the UAE, the influencing factors are scale and speed. Sensors that can be installed quickly and produce usable traffic data before the event closes are therefore more valuable than systems built for long-term venue monitoring. The USA is more measurement-led. CEIR already provides event benchmarking, performance dashboards and analytical tools for organizers and exhibitors. That makes booth sensors useful when they answer a defined question, such as whether a new layout increased visits or whether more staff were needed during peak hours. Collecting dwell-time data without connecting it to a decision will carry less value.
Japan and the UK are likely to place greater weight on privacy controls. Japan’s Personal Information Protection Commission continues to oversee the country’s personal-data regime, while UK guidance requires surveillance data to be relevant, limited to what is necessary and tied to a lawful purpose. These conditions favour anonymous counting and on-device processing over systems that identify or retain information about individual visitors.
Germany presents a mature deployment market rather than a simple volume opportunity. Its 158 national and international trade fairs attracted 150,260 exhibitors and 8.3 million visitors in 2025. In such a well-established event system, buyers are more likely to demand consistent readings across venues, clear calibration procedures and privacy safeguards before using sensor data in commercial decisions.
How does the Booth Engagement Sensors Market break down by segment?
Computer vision sensors lead Sensor Type at 32.0%, while Visitor count hold the largest Metric Captured share at 27.0% in 2026.
Why do Computer vision sensors lead Sensor Type?
Computer vision sensors are projected to account for 32.0% share in 2026.
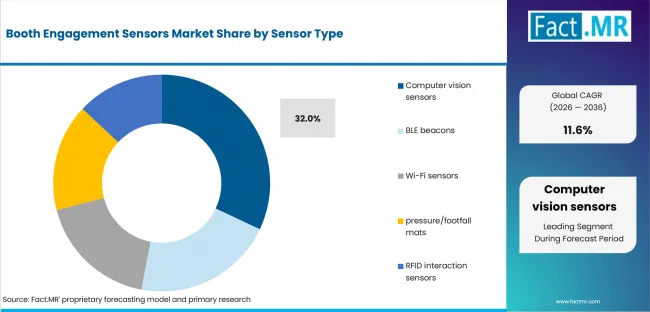
Booth Engagement Sensors Market Analysis By Sensor Type | Source: Fact.MR
Buyer preference for Computer vision sensors starts with the need to address producing decision-grade engagement metrics while respecting privacy and the limits of sensor inference. The format turns that need into a practical workflow because computer vision, wireless signals, mats or badge interactions translate physical behavior into aggregated event metrics. Demand for event ROI evidence increases utilization across recurring events. The segment keeps its lead when measurement validity, privacy controls and the decisions that each metric is expected to improve is documented and privacy and consent concerns is contained.
Why does Visitor count lead Metric Captured?
Visitor count are projected to account for 27.0% share in 2026.
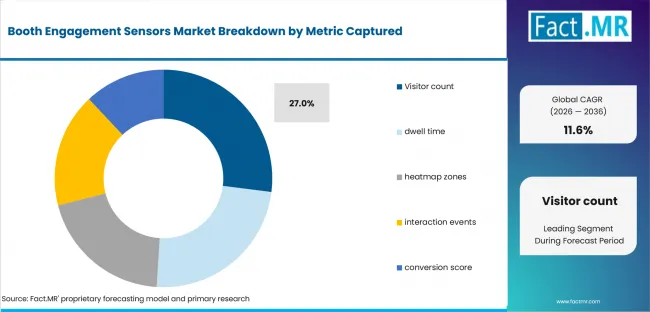
Booth Engagement Sensors Market Analysis By Metric Captured | Source: Fact.MR
The lead held by Visitor count reflects a direct response to producing decision-grade engagement metrics while respecting privacy and the limits of sensor inference. Its technical basis is simple: computer vision, wireless signals, mats or badge interactions translate physical behavior into aggregated event metrics. That fit becomes commercially stronger through booth-layout optimization. Before wider adoption, procurement teams still examine measurement validity, privacy controls and the decisions that each metric is expected to improve and the effect of measurement bias and blind spots.
Why does Temporary rental lead Deployment?
Temporary rental are projected to account for 34.0% share in 2026.
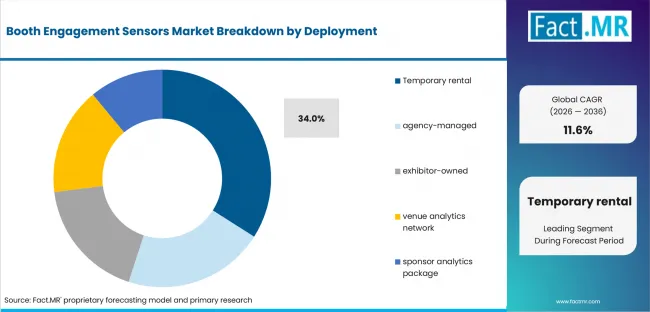
Booth Engagement Sensors Market Analysis By Deployment | Source: Fact.MR
Temporary rental hold the largest Deployment position by linking sponsor measurement to a repeatable process. That process uses the following mechanism: computer vision, wireless signals, mats or badge interactions translate physical behavior into aggregated event metrics. It reduces uncertainty around producing decision-grade engagement metrics while respecting privacy and the limits of sensor inference. The next value layer comes from real-time exhibit adjustment, provided buyers can validate measurement validity, privacy controls and the decisions that each metric is expected to improve.
Why do Large exhibitors lead Buyer?
Large exhibitors are projected to account for 31.0% share in 2026.
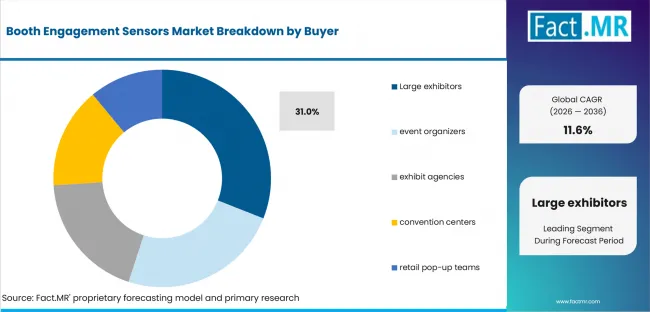
Booth Engagement Sensors Market Analysis By Buyer | Source: Fact.MR
Large exhibitors lead Buyer because producing decision-grade engagement metrics while respecting privacy and the limits of sensor inference is handled through a clear operating method. In this format, computer vision, wireless signals, mats or badge interactions translate physical behavior into aggregated event metrics. Demand strengthens when staffing and content evaluation appears in the event brief. Buyers then verify measurement validity, privacy controls and the decisions that each metric is expected to improve, while privacy and consent concerns remains the main qualification risk.
Why does Anonymous counting lead Privacy Approach?
Anonymous counting are projected to account for 33.0% share in 2026.
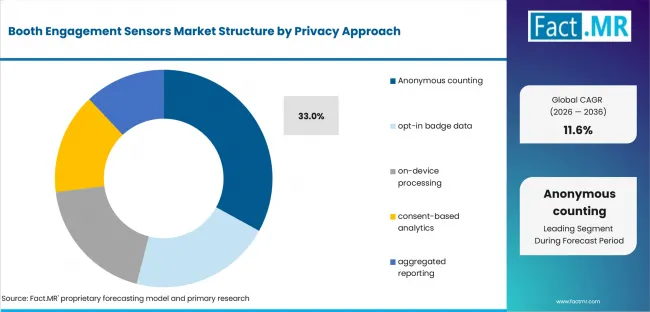
Booth Engagement Sensors Market Analysis By Privacy Approach | Source: Fact.MR
Demand favors Anonymous counting where event teams must control producing decision-grade engagement metrics while respecting privacy and the limits of sensor inference under short setup windows. The segment works because computer vision, wireless signals, mats or badge interactions translate physical behavior into aggregated event metrics. Its share is reinforced by demand for event ROI evidence, although measurement bias and blind spots can reduce the advantage. Buyers compare suppliers through measurement validity, privacy controls and the decisions that each metric is expected to improve.
What is accelerating Booth Engagement Sensors Market adoption, and what is holding it back?
Demand for event roi evidence is anticipated to remain the primary demand catalyst. Privacy and consent concerns is expected to restrain adoption when the operating case is incomplete.
Drivers Impact Analysis
| DRIVER | (~) % IMPACT ON CAGR | GEOGRAPHIC RELEVANCE | IMPACT TIMELINE |
|---|---|---|---|
| Demand for event roi evidence | +3.1% | Mature exhibition markets | Short term (<=2 years) |
| Booth-layout optimization | +2.4% | Global | Short term (<=2 years) |
| Sponsor measurement | +1.9% | North America and Europe | Medium term (2-4 years) |
| Staffing and content evaluation | +1.3% | China and UAE | Medium term (2-4 years) |
Source: Fact.MR analysis. Updated Jul 28, 2026
- Demand for event ROI evidence: Exhibitors want to know whether a booth generated enough attention to justify the cost of floor space, construction and staffing. Sensors can add visitor counts, dwell time and repeat interaction data to lead scans and sales feedback. The figures become useful when they help decide whether to return to the event, reduce the booth size or invest more in a particular demonstration.
- Booth-layout optimisation: Movement data can expose weak points that staff may miss during a busy show. A crowded entrance may look successful but still prevent visitors from reaching displays at the back. Heatmaps and zone-level counts help teams reposition demo tables, screens and staff, then compare the revised layout at the next event.
- Sponsor measurement: Sponsors increasingly expect evidence that visitors reached and used the area carrying their name. Engagement sensors can record traffic around a sponsored display, time spent in the activation and the number of interactions completed. Organisers can use these results in sponsor reports and provide a firmer basis for renewal discussions.
- Staffing and content evaluation: Hourly traffic and dwell data can show whether staffing levels match visitor demand. The same information can reveal whether a presentation, product trial or interactive feature held attention or merely drew a brief crowd. Event teams can then adjust shift patterns, repeat successful sessions and remove content that uses space without contributing much.
Opportunity Impact Analysis
| OPPORTUNITY | (~) % IMPACT ON CAGR | GEOGRAPHIC RELEVANCE | IMPACT TIMELINE |
|---|---|---|---|
| Privacy-preserving edge analytics | +2.1% | USA and UK | Short term (<=2 years) |
| Cross-sensor calibration services | +1.5% | Germany and Japan | Medium term (2-4 years) |
| Real-time exhibit adjustment | +1.0% | China and UAE | Medium term (2-4 years) |
Source: Fact.MR analysis. Updated Jul 28, 2026
- Privacy-preserving edge analytics: Processing data inside the sensor or at the booth reduces the need to send raw video or device-level information to an external server. The system can discard images after converting them into counts, dwell estimates or movement patterns. This gives exhibitors useful traffic data while lowering privacy risk and reducing the amount of sensitive information that must be stored or transferred.
- Cross-sensor calibration services: Different sensors often produce different results in the same space. Cameras may miss visitors in poor lighting, Wi-Fi signals can overcount passers-by, and pressure mats only capture movement across a fixed point. Calibration services compare these readings, identify blind spots and adjust the setup before the event opens. Suppliers can turn this into recurring service revenue because each venue and booth layout creates a different measurement problem.
- Real-time exhibit adjustment: Live traffic data allows event teams to respond while the show is still running. Staff can move a demonstration, open another entry point or add people to a crowded area when engagement drops or queues build. The value is immediate: the exhibitor does not have to wait for a post-event report to discover that an important part of the booth was underused.
Restraints Impact Analysis
| RESTRAINT | (~) % IMPACT ON CAGR | GEOGRAPHIC RELEVANCE | IMPACT TIMELINE |
|---|---|---|---|
| Privacy and consent concerns | -2.2% | Cost-sensitive regional markets | Short term (<=2 years) |
| Measurement bias and blind spots | -1.6% | Highly regulated venues | Medium term (2-4 years) |
| Weak linkage between dwell and commercial value | -1.2% | Global | Short term (<=2 years) |
Source: Fact.MR analysis. Updated Jul 28, 2026
- Privacy and consent concerns: Privacy and consent concerns slows rollout when the offer leaves producing decision-grade engagement metrics while respecting privacy and the limits of sensor inference to the installation crew. The restraint is smaller where measurement validity, privacy controls and the decisions that each metric is expected to improve is documented.
- Measurement bias and blind spots: Measurement bias and blind spots creates resistance where event teams cannot validate computer vision, wireless signals, mats or badge interactions translate physical behavior into aggregated event metrics. Market-specific limits and support terms can restore confidence.
- Weak linkage between dwell and commercial value: Weak linkage between dwell and commercial value can offset the category's benefits if it undermines measurement validity, privacy controls and the decisions that each metric is expected to improve. Suppliers should place the relevant control inside the commercial scope.
Which countries are scaling Booth Engagement Sensors Market fastest?
- For booth engagement sensors, country variation comes from the procurement route and the operating problem being solved.
- Computer vision sensors benefit from China's multi-city calendar because repeat deployment raises the value of standard work instructions. In the UAE, producing decision-grade engagement metrics while respecting privacy and the limits of sensor inference places more weight on turnaround and support readiness.
- Demand for event roi evidence gives US buyers a measurable reason to invest, while Japan tests whether measurement validity, privacy controls and the decisions that each metric is expected to improve can be maintained in compact configurations.
- Visitor count face higher documentation expectations in Germany. In the UK, recurring shows create several commercial routes for privacy-preserving edge analytics.
- Measurement validity, privacy controls and the decisions that each metric is expected to improve is therefore the common approval test, although each country reaches that test through a different event model.
The broader country analysis tests whether demand for event ROI evidence, privacy and consent concerns and privacy-preserving edge analytics behave differently across North America, Latin America, Europe, East Asia, South Asia and Oceania, and the Middle East and Africa.
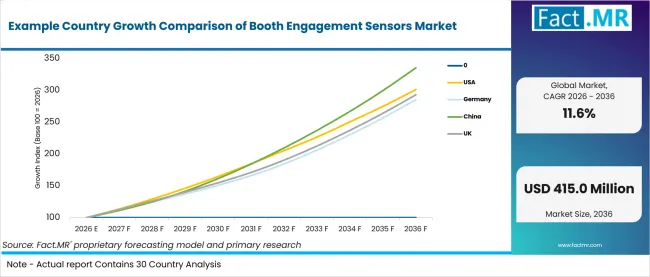
Example Country Growth Comparison Of Booth Engagement Sensors Market | Source: Fact.MR
| COUNTRY | CAGR, 2026 to 2036 |
|---|---|
| UAE | 12.3% |
| USA | 11.6% |
| Japan | 11.5% |
| UK | 11.3% |
| Germany | 11.0% |
Source: Fact.MR analysis. Updated Jul 28, 2026
What is driving UAE's growth through 2036?
12.3% CAGR, driven by high event throughput and international participation.
The UAE market is expected to post a 12.3% CAGR. Dubai World Trade Centre reported AED 25 billion in economic output from its 2025 events activity. The practical link for booth engagement sensors is a controlled use of computer vision, wireless signals, mats or badge interactions translate physical behavior into aggregated event metrics within tightly scheduled installation and removal periods.
What is driving USA's growth through 2036?
11.6% CAGR, supported by measurement-led exhibitor procurement.
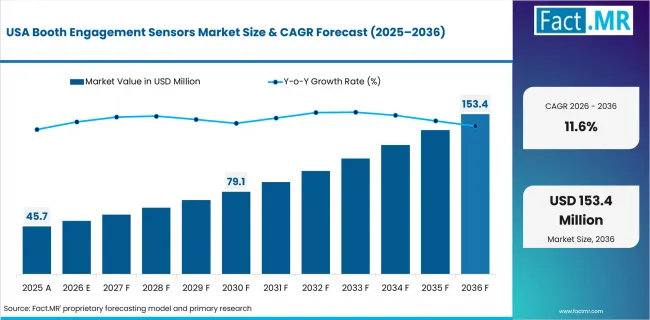
Booth Engagement Sensors Market Country Value Analysis | Source: Fact.MR
For booth engagement sensors, the USA's 11.6% outlook is tied to measurable exhibitor outcomes. The US exhibition market has a mature research infrastructure through CEIR, which increases buyer emphasis on measurable event performance and repeatable operating data. Buyers use measurement validity, privacy controls and the decisions that each metric is expected to improve to connect the purchase with booth-layout optimization and service performance.
What is driving Japan's growth through 2036?
11.5% CAGR, linked to compact systems and reliable operation.
Japan is projected at 11.5%, with sponsor measurement gaining value in dense exhibition settings. Japan Exhibition Association participates in UFI's Global Exhibition Barometer, linking Japanese operators to a recurring international performance benchmark. Providers can improve the offer when computer vision, wireless signals, mats or badge interactions translate physical behavior into aggregated event metrics fits established venue routines.
What is driving UK's growth through 2036?
11.3% CAGR, supported by a broad base of exhibitions and recurring exhibitors.
A 11.3% CAGR in the UK reflects the value of using booth engagement sensors across a sequence of shows. EIA research attributes GBP 11.5 billion of economic output and 126,000 jobs to the UK exhibition sector. Buyers can compare suppliers more easily when measurement validity, privacy controls and the decisions that each metric is expected to improve is measured from one event to the next.
What is driving Germany's growth through 2036?
11.0% CAGR, driven by an international and technically demanding trade-fair base.
Germany's outlook is 11.0%. The market connection for booth engagement sensors is measurement validity, privacy controls and the decisions that each metric is expected to improve, which matters more in an internationally exposed fair system. German national and international fairs used 5.6 million square metres of exhibition space in 2025, according to AUMA. Privacy-preserving edge analytics can add value where it also limits privacy and consent concerns.
Who leads the Booth Engagement Sensors Market?
Buyers distinguish providers by how clearly they translate computer vision, wireless signals, mats or badge interactions translate physical behavior into aggregated event metrics into a deployable offer. Zenus and Crowd Connected lead the estimated shares, ahead of Density and FootfallCam.
Zenus and Crowd Connected are the most directly aligned with exhibition and event measurement. Zenus focuses on booth-level behaviour. Its system measures footfall, dwell time and visitor response through privacy-first visual analytics. This makes it relevant when an exhibitor wants to compare booth layouts, demonstrations or staff engagement without asking visitors to scan a badge.
Crowd Connected is stronger where organizers need to follow movement across a larger event. Its wearable smart tags and battery-powered beacons can record which sessions a delegate entered, when they arrived and how long they stayed. At PCMA Convening Leaders 2025, the system tracked attendance across almost 100 sessions in 27 rooms and produced results shortly after each session. This is a different proposition from anonymous booth counting because the tag is paired with the attendee’s badge.
Density, FootfallCam and Dor compete from adjacent positions. Density uses radar and depth sensing to count people without capturing identifiable images, making it useful where privacy rules rule out conventional cameras. FootfallCam offers a wider analytics stack covering entrance counts, dwell time, heatmaps, zone movement and live occupancy. Dor takes a simpler approach with battery-operated thermal counters that can be installed without wiring or access to the venue’s network.
The practical choice depends on the question being asked. Zenus is suited to understanding what happens inside a booth. Crowd Connected is better suited to attendee journeys and session attendance. Density offers anonymous occupancy measurement where privacy is the main constraint. FootfallCam provides deeper zone and movement analysis, while Dor is useful when the buyer mainly needs a fast, temporary visitor count.
Which companies are the key providers?
Key companies include Zenus; Crowd Connected; Density; FootfallCam; Dor Technologies.
- Zenus
- Crowd Connected
- Density
- FootfallCam
- Dor Technologies
Bibliography
- UFI. (2026, January 29). 36th Global Exhibition Barometer. UFI, The Global Association of the Exhibition Industry.
- UFI. (2026, February). Global Exhibition Industry Statistics, January 2026. UFI, The Global Association of the Exhibition Industry.
- AUMA. (2026). Key figures for the trade fair industry in Germany. Association of the German Trade Fair Industry.
- Events Industry Alliance. (2026, April 15). UK exhibitions reach highest level in a decade according to EIA 2025 SASIE report. Events Industry Alliance.
- Dubai World Trade Centre. (2026, April 7). DWTC welcomes nearly 3 million participants in 2025. Dubai World Trade Centre.
- Center for Exhibition Industry Research. (2026). CEIR research and event-performance resources. International Association of Exhibitions and Events.
This Report Addresses
- Strategic intelligence on Booth Engagement Sensors Market across Sensor Type and Metric Captured choices that shape purchasing decisions.
- Segment analysis covering Computer vision sensors as the 2026 share leader within Sensor Type.
- Regional analysis comparing China and UAE with USA and Japan, while UK and Germany complete the growth view.
- Competitive analysis profiling Zenus and Crowd Connected with additional active providers.
- Use-case assessment of the categories that shape demand across the forecast period.
What does the Booth Engagement Sensors Market cover?
Temporary sensing systems that estimate booth traffic, dwell, movement and selected visitor interactions.
The market includes temporary sensors, analytics software and reporting packages used to measure exhibition-booth engagement. Commercial value comes from the configured product and its direct event function. The covered solution must be usable within an exhibition workflow rather than supplied as an unrelated component.
The market differs from broader event equipment because the boundary is defined by the specific function described in this report. General building surveillance, permanent retail analytics, event registration and raw venue wi-fi infrastructure remain outside the valuation.
What is included in the scope?
The scope includes solutions used by the buyer groups identified in the segmentation and deployed for exhibitions, conferences, activations or related temporary business events.
Coverage spans Sensor Type: Computer vision sensors, BLE beacons, Wi-Fi sensors, pressure/footfall mats, RFID interaction sensors; Metric Captured: Visitor count, dwell time, heatmap zones, interaction events, conversion score; Deployment: Temporary rental, agency-managed, exhibitor-owned, venue analytics network, sponsor analytics package; Buyer: Large exhibitors, event organizers, exhibit agencies, convention centers, retail pop-up teams; Privacy Approach: Anonymous counting, opt-in badge data, on-device processing, consent-based analytics, aggregated reporting.
Components remain in scope when they are supplied as part of the complete booth engagement sensors solution and contribute directly to measurement validity, privacy controls and the decisions that each metric is expected to improve.
What is excluded from the scope?
General building surveillance, permanent retail analytics, event registration and raw venue wi-fi infrastructure.
The scope excludes unrelated venue construction, general event management, floor-space rental and services that do not deliver the defined product function. It also excludes the value of the event, venue or exhibitor business in which the solution is used.
How Was the Analysis Built?
The analysis draws on 120+ sources, 35+ company portfolios, 25+ countries and more than 20 industry interviews.
- Primary Research: Discussions with manufacturers, rental providers, exhibit builders, organizers, venues and end users examined measurement validity, privacy controls and the decisions that each metric is expected to improve, purchasing criteria and operational constraints.
- Desk Research: Research covered official exhibition statistics, association publications, company portfolios, technical material, public policy and other authoritative sources. Sources used in the country context are documented in the bibliography.
- Market Sizing and Forecasting: Estimates combine historical performance, segment shares, company participation, pricing and volume indicators, country growth, adoption patterns and barriers.
- Data Validation and Update Cycle: Findings are cross-checked against company activity, event-industry statistics, technical feasibility and the internal consistency of segment and country assumptions.
Segmentation
What is the report's scope and coverage?

Booth Engagement Sensors Market Breakdown By Sensor Type, Metric Captured, And Region | Source: Fact.MR
| Attribute | Details |
|---|---|
| Quantitative Units | USD million in 2026 to USD million by 2036 at a CAGR |
| Market Definition | The market covers temporary sensing systems that estimate booth traffic, dwell, movement and selected visitor interactions when supplied as a commercial event solution. |
| Sensor Type | Computer vision sensors; BLE beacons; Wi-Fi sensors; pressure/footfall mats; RFID interaction sensors |
| Metric Captured | Visitor count; dwell time; heatmap zones; interaction events; conversion score |
| Deployment | Temporary rental; agency-managed; exhibitor-owned; venue analytics network; sponsor analytics package |
| Buyer | Large exhibitors; event organizers; exhibit agencies; convention centers; retail pop-up teams |
| Privacy Approach | Anonymous counting; opt-in badge data; on-device processing; consent-based analytics; aggregated reporting |
| Regions Covered | North America; Latin America; Europe; East Asia; South Asia & Oceania; Middle East & Africa |
| Countries Covered | USA; Canada; Brazil; Mexico; Germany; U.K.; France; Italy; Spain; South Korea; Japan; Australia & New Zealand; GCC Countries; South Africa; UAE |
| Key Companies Profiled | Zenus; Crowd Connected; Density; FootfallCam; Dor Technologies |
| Forecast Period | 2026 to 2036 |
| Approach | Hybrid top-down and bottom-up analysis using demand indicators across Sensor Type, Metric Captured, Deployment, Buyer, Privacy Approach; country growth; company participation and adoption patterns |
Source: Fact.MR analysis. Updated Jul 28, 2026
How is the market segmented?
-
By Sensor Type:
- Computer vision sensors
- BLE beacons
- Wi-Fi sensors
- pressure/footfall mats
- RFID interaction sensors
-
By Metric Captured:
- Visitor count
- dwell time
- heatmap zones
- interaction events
- conversion score
-
By Deployment:
- Temporary rental
- agency-managed
- exhibitor-owned
- venue analytics network
- sponsor analytics package
-
By Buyer:
- Large exhibitors
- event organizers
- exhibit agencies
- convention centers
- retail pop-up teams
-
By Privacy Approach:
- Anonymous counting
- opt-in badge data
- on-device processing
- consent-based analytics
- aggregated reporting
-
By Region:
- North America
- USA
- Canada
- Latin America
- Brazil
- Mexico
- Rest of Latin America
- Europe
- Germany
- U.K.
- France
- Italy
- Spain
- Rest of Europe
- East Asia
- South Korea
- Japan
- South Asia & Oceania
- India
- Australia & New Zealand
- Rest of South Asia & Oceania
- Middle East & Africa
- GCC Countries
- South Africa
- UAE
- Rest of Middle East & Africa
- North America
Frequently Asked Questions
Which Sensor Type leads the Booth Engagement Sensors Market?
Which Metric Captured leads the Booth Engagement Sensors Market?
Which Deployment leads the Booth Engagement Sensors Market?
Which Buyer leads the Booth Engagement Sensors Market?
Which Privacy Approach leads the Booth Engagement Sensors Market?
How does UAE perform in the Booth Engagement Sensors Market?
How does USA perform in the Booth Engagement Sensors Market?
What is the primary driver in the Booth Engagement Sensors Market?
What is the main restraint in the Booth Engagement Sensors Market?
Who worked on this report


Preview the report firsthand - request a free sample
Free SampleGet the brochure for pricing and purchase details
Download PDF