Catering Services Market

Catering Services Market Analysis By Services (contract catering services and non-contractual catering services), By Type (wedding catering, social event catering, corporate catering, others), By End-user (corporate, industrial, hospitality, healthcare, others), & Region- Global Market Insights 2023-2033

Analysis of Catering Services Market Covering 30+ Countries Including Analysis of US, Canada, UK, Germany, France, Nordics, GCC countries, Japan, Korea and many more

Catering Services Market Outlook (2023-2033)

The global catering services market is expected to secure a valuation of US$ 585.2 billion in 2023. During the forecast period of 2023-2033, the market for catering services is expected to exhibit a CAGR of 4.5% and reach US$ 908.8 billion by the end of 2033.

There are over 50K catering service providers in the world, of which the top 5 catering service providers hold 18% of the total industry wealth.

Report Attributes Details

Catering Services Market Size in 2022

US$ 560.0 Billion

Estimated Market Value (2023E)

US$ 585.2 Billion

Forecasted Market Value (2033F)

US$ 908.8 Billion

Global Market Growth Rate (2023-2033)

~4.5% CAGR

North America Market Share (2022)

~32.0%

East Asia Market Growth Rate (2023-2033)

~5.3% CAGR

United States Market Growth Rate (2023-2033)

~4.4% CAGR

Key Companies Profiled

  • ANN SATHER
  • Aramark Corporation
  • ARIA CATERING
  • AVI Foodsystems, Inc.
  • Bartlett mitchell Ltd.
  • BLACK OLIVE CATERING
  • BLUE PLATE
  • CH and Co Catering Group Ltd.
  • Compass Group plc
  • Delaware North Companies Inc.
  • Dine Contract Catering Ltd.
  • DO & CO Aktiengesellschaft
  • DoorDash Inc.
  • Elior Group SA
  • ISS Facility Services Inc.
  • Mitie Group plc
  • Sodexo S.A
  • The Emirates Group
  • Other Key Players

Demand Analysis of Catering Services (2018-2022) Vs. Market Forecast Outlook (2023-2033)

The catering service market is gaining substantial demand from different end-use verticals like corporate, hospitality, industrial, and others. The corporate sector is expected to have significant demand for these services due to the surging demand for healthy food meals in the corporate sector. Also, western countries account for the significant utility of these services with the increasing trend of food-away-from-home.

Although, the market is expected to have huge potential during the assessment years in East and South Asian economies with rising population, and urbanization. Development in the corporate and hospitality sector will create lucrative opportunities for market development during the assessment years (2023-2033).

  • Short Term (2023 Q1-2026): The demand for catering services is projected to grow with the resumption of various business organizations and surging awareness among people regarding healthy and hygienic food consumption.
  • Medium Term (2025-2028): The industry will see the entry of a new set of businesses with more advanced and cost-efficient services. In India companies like Zomato, an online food ordering company has entered the corporate catering services market.
  • Long Term (2028-2032): Growing in corporate and private events and rapid urbanization will boost the trend of food-away-from-home, thereby escalating the overall market development of catering services during 2028-2032.

East Asia is projected to rise with the fastest CAGR of 5.3% during the forecast period (2023-2033). However, North America and Europe hold more than 50% of the share of the global catering services market.

Catering Services Market Size, CAGR, Segment and Forecast by Fact.MR

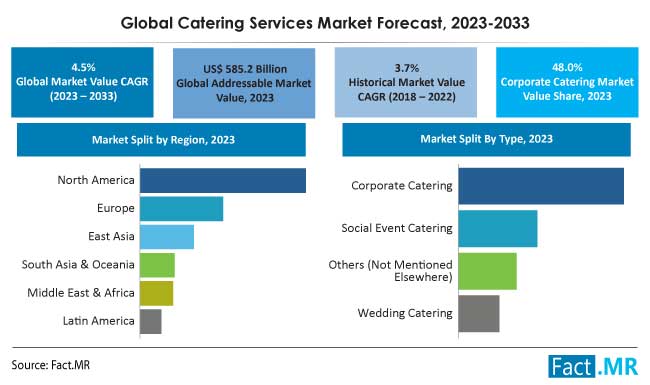
The image represents market bifurcation in region and type segment. Corporate catering holds more than one-third of the market revenue share, followed by social events and wedding catering.

Key elements driving the demand for catering services

Surging demand for healthy food meal in corporate

Companies worldwide are focused efficiently on the health of their employees. They are putting concern towards providing healthy meals prepared from fresh ingredients to the employees and avoiding excessive dependency on frozen food. Owing to this factor, demand for catering services is rising worldwide in the corporate sector.

Also, well-maintained and healthy meal services are one of the strategies corporates are using to attract fresh talent and as a retention tool. By offering a delightful dining experience and employee-centric customized menus from catering services provided at a subsidized rate, corporates tremendously benefited from establishing market good meals, employee retention, and talent acquisition.

Surging demand for food-away-from-home

The potential shift of people from one place to another for jobs and educational purposes is creating a lucrative demand for food-away-from-home services. With the increasing demand for food-away-from-home services, the demand for catering services is expected to rise significantly worldwide.

It is projected that more than 20% of millennials worldwide during 2021 has switched to a job and more than 50% are open to a different opportunity. With an increase shift in millennials from homes to other work locations, demand for food-away-from-home services is expected to have significant growth globally. Also, with increasing disposable income, demand for these services is growing and resulting in the potential rise of catering services.

Factors impeding the growth of catering services market

“Higher initial investment in catering services business”

High cost incurred during the initial stage of starting a catering business is one of the major factors restraining market growth. Catering services are majorly used for events like corporate parties, weddings, and others. Therefore, there is huge sum of money is required in buying food, and ingredients, prepare food, transport, and other.

Moreover, the catering service market is majorly dependent on the taste of the meal the service provider offers. Therefore, the divergence in the taste of people will be a major factor hampering the growth of catering service providers.

Country-wise Insights

United States to secure largest revenue share in global catering service market

US accounts for a leading share of 32.0% in the global catering services market. With the presence of a potential number of restaurants in the region, food & related industries contribute around 4-5% of countries GDP. About 90% of restaurant owners who offer catering services have stated that catering contributes about 18% of a restaurant's overall revenue.

Additionally, a substantial rise in investment by restaurant owners in catering services is escalating the market growth. The economy is also witnessed people with a higher interest in junk food along with the presence of a large number of the expatriate population in the country is projected to escalate the demand for catering services in the region.

China to witness the fastest growth during the forecast period

Chinese catering services market has faced an extreme challenge during the COVID-19 pandemic where small and medium enterprises faced a sharp decline in customer base and a shortage of supply chain. However, the market is projected to see huge potential to rise in the forthcoming period.

Once the businesses resume their operation, it is expected that the demand for catering services especially from the corporate end will grow manifold. During the forecast period of 2023-2033, China’s catering services market will grow at a CAGR of 6.1%. Given its large population of working class along with its growth rate of employment and business growth, the catering service providers are betting high on the China market.

Category-wise Insights

Contract Catering Services to exhibit a leading share in the catering service market

The contract catering service providers offer catering services to a business or organization including workplace canteen, school, college, and others for a specific period. Contract catering services is beneficial for these industry verticals over noncontract catering service provider, as they can focus on their area of expertise and hand over the responsibility of these services to the specialist and professionals.

Additionally, contract catering services are cost-efficient for both the service provider and consumer, where service charges could be negotiated to favour both parties. However, noncontract catering services are projected to have an expansion in market share during the assessment year due to the high cost associated with contract catering services.

Corporate sector is the leading consumer of catering services

The corporate sector is projected to have a leading share of 48.0% in demand for catering services. Catering services play an essential role in the corporate sector in attracting fresh talent and retention of employees. Having a contract with the catering service provider corporate helps in establishing a positive reputation for the company, by offering a high-end experience to the employees.

Hiring a catering service provider during corporate parties could be advantageous for the company in establishing a positive impression for the business. Professional catering service providers offer a wide variety of options in the corporate to take care of the taste of people from different countries.

Competitive Landscape

Key market players in the global catering services market are ANN SATHER, Aramark Corporation, ARIA CATERING, AVI Foodsystems, Inc., Bartlett mitchell Ltd., BLACK OLIVE CATERING, BLUE PLATE, CH and Co Catering Group Ltd., Compass Group plc, Delaware North Companies Inc., Dine Contract Catering Ltd., DO & CO Aktiengesellschaft, DoorDash Inc., Elior Group SA, ISS Facility Services Inc., Mitie Group plc, Sodexo S.A, The Emirates Group and other key players.

The catering service market is highly fragmented with the presence of various large and small market players in the industry. Favourable move like merger & acquisition by these market players to enhance their global presence and strengthen their foothold in the industry is fuelling the market growth.

For instance :

  • In January 2022, Sodexo agreed to acquire Frontline Food Services a major player in the convenience market in North America.
  • In October 2022, The Compass Group India, has acquired Elior India Catering Business. The acquisition is aimed towards expanding company’s service offerings and strengthening its foothold in the Indian market.

Fact.MR has provided detailed information about the players of Catering Services positioned across regions, revenue growth, and service offering expansion, in the recently published report.

Segmentation of the Catering Services Market

  • By Service :

    • Contract Catering Services
    • Non-Contractual Catering Services
  • By Type :

    • Wedding Catering
    • Social Event Catering
    • Corporate Catering
    • Others (Not Mentioned Elsewhere)
  • By End-user :

    • Corporate
    • Industrial
    • Hospitality
    • Healthcare
    • Educational
    • Sports & Leisure
    • Others (Not Mentioned Elsewhere)
  • By Region :

    • North America
    • Latin America
    • Europe
    • East Asia
    • South Asia & Oceania
    • Middle East & Africa

Table of Content

  1. Executive Summary - Global Market
  2. Market Overview
    • Market Definition and Introduction
    • Market Taxonomy/ Research Scope
  3. Market Characteristic – Bird Eye View
    • Number of Active Enterprises by Key Countries
    • Average Operating Margin
    • Threshold of Revenue Volatility
    • Consistency in Demand
    • Key Barriers to Entry
    • Key Customer Archetypes 
  4. Market Background and Foundation Data
    • as a Total Percent of Food Services Market Analysis, 2022
    • Penetration of by Different End-User Vertical, 2018 to 2022
    • Contract Vs Non-Contractual Catering Service Analysis, 2022
    • Key Trends in Market
    • Market Dynamics
      • Key Growth Drivers
      • Industry Challenges
      • Notable Current and Future Trends
    • Opportunity and White Space Assessment
      • Total Available Market (US$ Bn)
      • Serviceable Addressable Market (US$ Bn)
      • Serviceable Obtainable Market (US$ Bn)
    • Forecast and Macro-Economic Factors – Relevance and Impact
    • Key Success Factors and Winning Imperatives
  5. Global Market Analysis and Forecast
    • Historical Market Value (US$ Bn) Analysis, 2018 to 2022
    • Current and Future Market Value (US$ Bn), 2023 to 2033
      • Y-o-Y Growth Trend Analysis
      • Absolute $ Opportunity Analysis
  6. Global Market Analysis and Forecast, By Services
    • Introduction / Key Findings
    • Historical Market Size (US$ Bn) By Services, 2018 to 2022
    • Current and Future Market Size (US$ Bn) Forecast By Services, 2023 to 2033
      • Contract Catering Services
      • Non-Contractual Catering Services
    • Market Attractiveness Analysis By Services
  7. Global Market Analysis and Forecast, By Type
    • Introduction / Key Findings
    • Historical Market Size (US$ Bn) By Type, 2018 to 2022
    • Current and Future Market Size (US$ Bn) Forecast By Type, 2023 to 2033
      • Wedding Catering
      • Social Event Catering
      • Corporate Catering
      • Others (Not Mentioned Elsewhere)
    • Market Attractiveness Analysis By Application
  8. Global Market Analysis and Forecast, By End-user
    • Introduction / Key Findings
    • Historical Market Size (US$ Bn) By End-user, 2018 to 2022
    • Current and Future Market Size (US$ Bn) Forecast By End-user, 2023 to 2033
      • Corporate
      • Industrial
      • Hospitality
      • Healthcare
      • Educational
      • Sports & Leisure
      • Others (Not Mentioned Elsewhere)
    • Market Attractiveness Analysis By Application
  9. Global Market Analysis and Forecast, By Region
    • Introduction
    • Historical Market Size (US$ Bn) By Region, 2018 to 2022
    • Current Market Size (US$ Bn) Forecast By Region, 2023 to 2033
      • North America
      • Latin America
      • Europe
      • East Asia
      • South Asia and Oceania
      • Middle East & Africa
    • Market Attractiveness Analysis By Region
  10. North America Market Analysis and Forecast
    • Introduction / Key Findings
    • Historical Market Size (US$ Bn) Trend Analysis By Market Taxonomy, 2018 to 2022
    • Market Size (US$ Bn) Forecast By Market Taxonomy, 2023 to 2033
      • By Country
        • U.S.
        • Canada
      • By Services
      • By Type
      • By End-user
    • Market Attractiveness Analysis
      • By Country
      • By Services
      • By Type
      • By End-user
  11. Latin America Market Analysis and Forecast
    • Introduction / Key Findings
    • Historical Market Size (US$ Bn) Trend Analysis By Market Taxonomy, 2018 to 2022
    • Market Size (US$ Bn) Forecast By Market Taxonomy, 2023 to 2033
      • By Country
        • Brazil
        • Mexico
        • Argentina
        • Peru
        • Rest of Latin America
      • By Services
      • By Type
      • By End-user
    • Market Attractiveness Analysis
      • By Country
      • By Services
      • By Type
      • By End-user
  12. Europe Market Analysis and Forecast
    • Introduction / Key Findings
    • Historical Market Size (US$ Bn) Trend Analysis By Market Taxonomy, 2018 to 2022
    • Market Size (US$ Bn) Forecast By Market Taxonomy, 2023 to 2033
      • By Country
        • Germany
        • Italy
        • France
        • U.K.
        • Spain
        • BENELUX
        • NORDIC
        • Rest of Europe
      • By Services
      • By Type
      • By End-user
    • Market Attractiveness Analysis
      • By Country
      • By Services
      • By Type
      • By End-user
  13. East Asia Market Analysis and Forecast
    • Introduction / Key Findings
    • Historical Market Size (US$ Bn) Trend Analysis By Market Taxonomy, 2018 to 2022
    • Market Size (US$ Bn) Forecast By Market Taxonomy, 2023 to 2033
      • By Country
        • China
        • Japan
        • South Korea
      • By Services
      • By Type
      • By End-user
    • Market Attractiveness Analysis
      • By Country
      • By Services
      • By Type
      • By End-user
  14. South Asia & Oceania Market Analysis and Forecast
    • Introduction / Key Findings
    • Historical Market Size (US$ Bn) Trend Analysis By Market Taxonomy, 2018 to 2022
    • Market Size (US$ Bn) Forecast By Market Taxonomy, 2023 to 2033
      • By Country
        • India
        • Thailand
        • Indonesia
        • Malaysia
        • Australia
        • Rest of South Asia & Oceania
      • By Services
      • By Type
      • By End-user
    • Market Attractiveness Analysis
      • By Country
      • By Services
      • By Type
      • By End-user
  15. Middle East & Africa Market Analysis and Forecast
    • Introduction / Key Findings
    • Historical Market Size (US$ Bn) Trend Analysis By Market Taxonomy, 2018 to 2022
    • Market Size (US$ Bn) Forecast By Market Taxonomy, 2023 to 2033
      • By Country
        • GCC Countries
        • Turkey
        • North African Region
        • South Africa
        • Rest of Middle East and Africa
      • By Services
      • By Type
      • By End-user
    • Market Attractiveness Analysis
      • By Country
      • By Services
      • By Type
      • By End-user
  16. Country-level Market Analysis and Forecast
    • Introduction / Key Findings
      • Market Value Proportion Analysis, By Key Countries
      • Global Vs. Country Growth Comparison
    • Us Market Analysis
      • Value Proportion Analysis By Market Taxonomy
      • Value (US$ Bn) Analysis and Forecast By Market Taxonomy, 2018 to 2033
        • By Services
        • By Type
        • By End-user
    • Canada Market Analysis
      • Value Proportion Analysis By Market Taxonomy
      • Value (US$ Bn) Analysis and Forecast By Market Taxonomy, 2018 to 2033
        • By Services
        • By Type
        • By End-user
    • Brazil Market Analysis
      • Value Proportion Analysis By Market Taxonomy
      • Value (US$ Bn) Analysis and Forecast By Market Taxonomy, 2018 to 2033
        • By Services
        • By Type
        • By End-user
    • Mexico Market Analysis
      • Value Proportion Analysis By Market Taxonomy
      • Value (US$ Bn) Analysis and Forecast By Market Taxonomy, 2018 to 2033
        • By Services
        • By Type
        • By End-user
    • Argentina Market Analysis
      • Value Proportion Analysis By Market Taxonomy
      • Value (US$ Bn) Analysis and Forecast By Market Taxonomy, 2018 to 2033
        • By Services
        • By Type
        • By End-user
    • Germany Market Analysis
      • Value Proportion Analysis By Market Taxonomy
      • Value (US$ Bn) Analysis and Forecast By Market Taxonomy, 2018 to 2033
        • By Services
        • By Type
        • By End-user
    • France Market Analysis
      • Value Proportion Analysis By Market Taxonomy
      • Value (US$ Bn) Analysis and Forecast By Market Taxonomy, 2018 to 2033
        • By Services
        • By Type
        • By End-user
    • Italy Market Analysis
      • Value Proportion Analysis By Market Taxonomy
      • Value (US$ Bn) Analysis and Forecast By Market Taxonomy, 2018 to 2033
        • By Services
        • By Type
        • By End-user
    • Spain Market Analysis
      • Value Proportion Analysis By Market Taxonomy
      • Value (US$ Bn) Analysis and Forecast By Market Taxonomy, 2018 to 2033
        • By Services
        • By Type
        • By End-user
    • Peru Market Analysis
      • Value Proportion Analysis By Market Taxonomy
      • Value (US$ Bn) Analysis and Forecast By Market Taxonomy, 2018 to 2033
        • By Services
        • By Type
        • By End-user
    • NORDIC Market Analysis
      • Value Proportion Analysis By Market Taxonomy
      • Value (US$ Bn) Analysis and Forecast By Market Taxonomy, 2018 to 2033
        • By Services
        • By Type
        • By End-user
    • BENELUX Market Analysis
      • Value Proportion Analysis By Market Taxonomy
      • Value (US$ Bn) Analysis and Forecast By Market Taxonomy, 2018 to 2033
        • By Services
        • By Type
        • By End-user
    • U.K. Market Analysis
      • Value Proportion Analysis By Market Taxonomy
      • Value (US$ Bn) Analysis and Forecast By Market Taxonomy, 2018 to 2033
        • By Services
        • By Type
        • By End-user
    • China Market Analysis
      • Value Proportion Analysis By Market Taxonomy
      • Value (US$ Bn) Analysis and Forecast By Market Taxonomy, 2018 to 2033
        • By Services
        • By Type
        • By End-user
    • Japan Market Analysis
      • Value Proportion Analysis By Market Taxonomy
      • Value (US$ Bn) Analysis and Forecast By Market Taxonomy, 2018 to 2033
        • By Services
        • By Type
        • By End-user
    • South Korea Market Analysis
      • Value Proportion Analysis By Market Taxonomy
      • Value (US$ Bn) Analysis and Forecast By Market Taxonomy, 2018 to 2033
        • By Services
        • By Type
        • By End-user
    • India Market Analysis
      • Value Proportion Analysis By Market Taxonomy
      • Value (US$ Bn) Analysis and Forecast By Market Taxonomy, 2018 to 2033
        • By Services
        • By Type
        • By End-user
    • ASEAN Countries Market Analysis
      • Value Proportion Analysis By Market Taxonomy
      • Value (US$ Bn) Analysis and Forecast By Market Taxonomy, 2018 to 2033
        • By Services
        • By Type
        • By End-user
    • GCC Countries Market Analysis
      • Value Proportion Analysis By Market Taxonomy
      • Value (US$ Bn) Analysis and Forecast By Market Taxonomy, 2018 to 2033
        • By Services
        • By Type
        • By End-user
    • Turkey Market Analysis
      • Value Proportion Analysis By Market Taxonomy
      • Value (US$ Bn) Analysis and Forecast By Market Taxonomy, 2018 to 2033
        • By Services
        • By Type
        • By End-user
    • South Africa Market Analysis
      • Value Proportion Analysis By Market Taxonomy
      • Value (US$ Bn) Analysis and Forecast By Market Taxonomy, 2018 to 2033
        • By Services
        • By Type
        • By End-user
  17. Market Structure Analysis
    • Market Analysis By Tier of Companies
    • Market Concentration of Players
    • Market Share Analysis of Top Players
  18. Competition Analysis
    • Competition Dashboard
    • Competition Deep Dive / Company Profiles: Market
      • ANN SATHER
        • Overview
        • End-Use Application Portfolio
        • Key Financials
        • SWOT Analysis
        • Key Developments
        • Strategy Overview
      • Aramark Corporation
        • Overview
        • End-Use Application Portfolio
        • Key Financials
        • SWOT Analysis
        • Key Developments
        • Strategy Overview
      • ARIA CATERING
        • Overview
        • End-Use Application Portfolio
        • Key Financials
        • SWOT Analysis
        • Key Developments
        • Strategy Overview
      • AVI Foodsystems, Inc.
        • Overview
        • End-Use Application Portfolio
        • Key Financials
        • SWOT Analysis
        • Key Developments
        • Strategy Overview
      • Bartlett mitchell Ltd.
        • Overview
        • End-Use Application Portfolio
        • Key Financials
        • SWOT Analysis
        • Key Developments
        • Strategy Overview
      • BLACK OLIVE CATERING
        • Overview
        • End-Use Application Portfolio
        • Key Financials
        • SWOT Analysis
        • Key Developments
        • Strategy Overview
      • BLUE PLATE
        • Overview
        • End-Use Application Portfolio
        • Key Financials
        • SWOT Analysis
        • Key Developments
        • Strategy Overview
      • CH and Co Catering Group Ltd.
        • Overview
        • End-Use Application Portfolio
        • Key Financials
        • SWOT Analysis
        • Key Developments
        • Strategy Overview
      • Compass Group plc
        • Overview
        • End-Use Application Portfolio
        • Key Financials
        • SWOT Analysis
        • Key Developments
        • Strategy Overview
      • Delaware North Companies Inc.
        • Overview
        • End-Use Application Portfolio
        • Key Financials
        • SWOT Analysis
        • Key Developments
        • Strategy Overview
      • Dine Contract Catering Ltd.
        • Overview
        • End-Use Application Portfolio
        • Key Financials
        • SWOT Analysis
        • Key Developments
        • Strategy Overview
      • DO & CO Aktiengesellschaft
        • Overview
        • End-Use Application Portfolio
        • Key Financials
        • SWOT Analysis
        • Key Developments
        • Strategy Overview
      • DoorDash Inc.
        • Overview
        • End-Use Application Portfolio
        • Key Financials
        • SWOT Analysis
        • Key Developments
        • Strategy Overview
      • Elior Group SA
        • Overview
        • End-Use Application Portfolio
        • Key Financials
        • SWOT Analysis
        • Key Developments
        • Strategy Overview
      • ISS Facility Services Inc.
        • Overview
        • End-Use Application Portfolio
        • Key Financials
        • SWOT Analysis
        • Key Developments
        • Strategy Overview
      • Mitie Group plc
        • Overview
        • End-Use Application Portfolio
        • Key Financials
        • SWOT Analysis
        • Key Developments
        • Strategy Overview
      • Sodexo S.A
        • Overview
        • End-Use Application Portfolio
        • Key Financials
        • SWOT Analysis
        • Key Developments
        • Strategy Overview
      • The Emirates Group
        • Overview
        • End-Use Application Portfolio
        • Key Financials
        • SWOT Analysis
        • Key Developments
        • Strategy Overview
      • Other Key Players
        • Overview
        • End-Use Application Portfolio
        • Key Financials
        • SWOT Analysis
        • Key Developments
        • Strategy Overview
  19. Assumptions & Acronyms Used
  20. Research Methodology

List Of Table

  • Table 1: Global Market Value (US$ Billion) and Forecast By Region, 2018 to 2022
  • Table 2: Global Market Value (US$ Billion) and Forecast By Region, 2023 to 2033
  • Table 3: Global Market Value (US$ Billion) and Forecast By Services, 2018 to 2022
  • Table 4: Global Market Value (US$ Billion) and Forecast By Services, 2023 to 2033
  • Table 5: Global Market Value (US$ Billion) and Forecast By Type, 2018 to 2022
  • Table 6: Global Market Value (US$ Billion) and Forecast By Type, 2023 to 2033
  • Table 7: Global Market Value (US$ Billion) and Forecast By End-User, 2018 to 2022
  • Table 8: Global Market Value (US$ Billion) and Forecast By End-User, 2023 to 2033
  • Table 9: North America Market Value (US$ Billion) and Forecast By Country, 2018 to 2022
  • Table 10: North America Market Value (US$ Billion) and Forecast By Country, 2023 to 2033
  • Table 11: North America Market Value (US$ Billion) and Forecast By Services, 2018 to 2022
  • Table 12: North America Market Value (US$ Billion) and Forecast By Services, 2023 to 2033
  • Table 13: North America Market Value (US$ Billion) and Forecast By Type, 2018 to 2022
  • Table 14: North America Market Value (US$ Billion) and Forecast By Type, 2023 to 2033
  • Table 15: Global Market Value (US$ Billion) and Forecast By End-User, 2018 to 2022
  • Table 16: Global Market Value (US$ Billion) and Forecast By End-User, 2023 to 2033
  • Table 17: Latin America Market Value (US$ Billion) and Forecast By Country, 2018 to 2022
  • Table 18: Latin America Market Value (US$ Billion) and Forecast By Country, 2023 to 2033
  • Table 19: Latin America Market Value (US$ Billion) and Forecast By Services, 2018 to 2022
  • Table 20: Latin America Market Value (US$ Billion) and Forecast By Services, 2023 to 2033
  • Table 21: Latin America Market Value (US$ Billion) and Forecast By Type, 2018 to 2022
  • Table 22: Latin America Market Value (US$ Billion) and Forecast By Type, 2023 to 2033
  • Table 23: Latin America Market Value (US$ Billion) and Forecast By End-User, 2018 to 2022
  • Table 24: Latin America Market Value (US$ Billion) and Forecast By End-User, 2023 to 2033
  • Table 25: Europe Market Value (US$ Billion) and Forecast By Country, 2018 to 2022
  • Table 26: Europe Market Value (US$ Billion) and Forecast By Country, 2023 to 2033
  • Table 27: Europe Market Value (US$ Billion) and Forecast By Services, 2018 to 2022
  • Table 28: Europe Market Value (US$ Billion) and Forecast By Services, 2023 to 2033
  • Table 29: Europe Market Value (US$ Billion) and Forecast By Type, 2018 to 2022
  • Table 30: Europe Market Value (US$ Billion) and Forecast By Type, 2023 to 2033
  • Table 31: Europe Market Value (US$ Billion) and Forecast By End-User, 2018 to 2022
  • Table 32: Europe Market Value (US$ Billion) and Forecast By End-User, 2023 to 2033
  • Table 33: East Asia Market Value (US$ Billion) and Forecast By Country, 2018 to 2022
  • Table 34: East Asia Market Value (US$ Billion) and Forecast By Country, 2023 to 2033
  • Table 35: East Asia Market Value (US$ Billion) and Forecast By Services, 2023 to 2033
  • Table 36: East Asia Market Value (US$ Billion) and Forecast By Type, 2018 to 2022
  • Table 37: East Asia Market Value (US$ Billion) and Forecast By Type, 2023 to 2033
  • Table 38: East Asia Market Value (US$ Billion) and Forecast By End-User, 2023 to 2033
  • Table 39: South Asia & Oceania Market Value (US$ Billion) and Forecast By Country, 2018 to 2022
  • Table 40: South Asia & Oceania Market Value (US$ Billion) and Forecast By Country, 2023 to 2033
  • Table 41: South Asia & Oceania Market Value (US$ Billion) and Forecast By Services, 2018 to 2022
  • Table 42: South Asia & Oceania Market Value (US$ Billion) and Forecast By Services, 2023 to 2033
  • Table 43: South Asia & Oceania Market Value (US$ Billion) and Forecast By Type, 2018 to 2022
  • Table 44: South Asia & Oceania Market Value (US$ Billion) and Forecast By Type, 2023 to 2033
  • Table 45: South Asia & Oceania Market Value (US$ Billion) and Forecast By End-User, 2018 to 2022
  • Table 46: South Asia & Oceania Market Value (US$ Billion) and Forecast By End-User, 2023 to 2033
  • Table 47: Middle East & Africa Market Value (US$ Billion) and Forecast By Country, 2018 to 2022
  • Table 48: Middle East & Africa Market Value (US$ Billion) and Forecast By Country, 2023 to 2033
  • Table 49: Middle East & Africa Market Value (US$ Billion) and Forecast By Services, 2018 to 2022
  • Table 50: Middle East & Africa Market Value (US$ Billion) and Forecast By Services, 2023 to 2033
  • Table 51: Middle East & Africa Market Value (US$ Billion) and Forecast By Type, 2018 to 2022
  • Table 52: Middle East & Africa Market Value (US$ Billion) and Forecast By Type, 2023 to 2033
  • Table 53: Middle East & Africa Market Value (US$ Billion) and Forecast By End-User, 2018 to 2022
  • Table 54: Middle East & Africa Market Value (US$ Billion) and Forecast By End-User, 2023 to 2033

List Of Figures

  • Figure 1: Global Market Value (US$ Billion) Forecast, 2023 to 2033
  • Figure 2: Global Market Absolute $ Opportunity (US$ Billion), 2023 to 2033
  • Figure 3: Global Market Value (US$ Billion) By Region, 2023 to 2033
  • Figure 4: Global Market Y-o-Y Growth Rate By Region, 2023 to 2033
  • Figure 5: Global Market Value (US$ Billion) By Services, 2023 to 2033
  • Figure 6: Global Market Y-o-Y Growth Rate By Services, 2023 to 2033
  • Figure 7: Global Market Value (US$ Billion) By Type, 2023 to 2033
  • Figure 8: Global Market Y-o-Y Growth Rate By Type, 2023 to 2033
  • Figure 9: Global Market Y-o-Y Growth Rate By End-user, 2023 to 2033
  • Figure 10: Global Market Y-o-Y Growth Rate By End-user, 2023 to 2033
  • Figure 11: North America Market Value (US$ Billion) Forecast, 2023 to 2033
  • Figure 12: North America Market Absolute $ Opportunity (US$ Billion), 2023 to 2033
  • Figure 13: North America Market Value (US$ Billion) By Country, 2023 to 2033
  • Figure 14: North America Market Y-o-Y Growth Rate By Country, 2023 to 2033
  • Figure 15: North America Market Value (US$ Billion) By Services, 2023 to 2033
  • Figure 16: North America Market Y-o-Y Growth Rate By Services, 2023 to 2033
  • Figure 17: North America Market Value (US$ Billion) By Type, 2023 to 2033
  • Figure 18: North America Market Y-o-Y Growth Rate By Type, 2023 to 2033
  • Figure 19: North America Market Value (US$ Billion) By End-user, 2023 to 2033
  • Figure 20: North America Market Y-o-Y Growth Rate By End-user, 2023 to 2033
  • Figure 21: North America Market Attractiveness Analysis By Country, 2023 to 2033
  • Figure 22: North America Market Attractiveness Analysis By Services, 2023 to 2033
  • Figure 23: North America Market Attractiveness Analysis By Type, 2023 to 2033
  • Figure 24: North America Market Attractiveness Analysis By End-user, 2023 to 2033
  • Figure 25: Latin America Market Value (US$ Billion) Forecast, 2023 to 2033
  • Figure 26: Latin America Market Absolute $ Opportunity (US$ Billion), 2023 to 2033
  • Figure 27: Latin America Market Value (US$ Billion) By Country, 2023 to 2033
  • Figure 28: Latin America Market Y-o-Y Growth Rate By Country, 2023 to 2033
  • Figure 29: Latin America Market Value (US$ Billion) By Services, 2023 to 2033
  • Figure 30: Latin America Market Y-o-Y Growth Rate By Services, 2023 to 2033
  • Figure 31: Latin America Market Value (US$ Billion) By Type, 2023 to 2033
  • Figure 32: Latin America Market Y-o-Y Growth Rate By Type, 2023 to 2033
  • Figure 33: Latin America Market Value (US$ Billion) By End-user, 2023 to 2033
  • Figure 34: Latin America Market Y-o-Y Growth Rate By End-user, 2023 to 2033
  • Figure 35: Latin America Market Attractiveness Analysis By Country, 2023 to 2033
  • Figure 36: Latin America Market Attractiveness Analysis By Services, 2023 to 2033
  • Figure 37: Latin America Market Attractiveness Analysis By Type, 2023 to 2033
  • Figure 38: Latin America Market Value (US$ Billion) By End-user, 2023 to 2033
  • Figure 39: Latin America Market Y-o-Y Growth Rate By Type, 2023 to 2033
  • Figure 40: Europe Market Value (US$ Billion) Forecast, 2023 to 2033
  • Figure 41: Europe Market Absolute $ Opportunity (US$ Billion), 2023 to 2033
  • Figure 42: Europe Market Value (US$ Billion) By Country, 2023 to 2033
  • Figure 43: Europe Market Y-o-Y Growth Rate By Country, 2023 to 2033
  • Figure 44: Europe Market Value (US$ Billion) By Services, 2023 to 2033
  • Figure 45: Europe Market Y-o-Y Growth Rate By Services, 2023 to 2033
  • Figure 46: Europe Market Value (US$ Billion) By Type, 2023 to 2033
  • Figure 47: Europe Market Y-o-Y Growth Rate By Type, 2023 to 2033
  • Figure 48: Europe Market Value (US$ Billion) By End-user, 2023 to 2033
  • Figure 49: Europe Market Y-o-Y Growth Rate By End-user, 2023 to 2033
  • Figure 50: Europe Market Attractiveness Analysis By Country, 2023 to 2033
  • Figure 51: Europe Market Attractiveness Analysis By Services, 2023 to 2033
  • Figure 52: Europe Market Attractiveness Analysis By Type, 2023 to 2033
  • Figure 53: Europe Market Attractiveness Analysis By End-user, 2023 to 2033
  • Figure 54: East Asia Market Value (US$ Billion) Forecast, 2023 to 2033
  • Figure 55: East Asia Market Absolute $ Opportunity (US$ Billion), 2023 to 2033
  • Figure 56: East Asia Market Value (US$ Billion) By Country, 2023 to 2033
  • Figure 57: East Asia Market Y-o-Y Growth Rate By Country, 2023 to 2033
  • Figure 58: East Asia Market Value (US$ Billion) By Services, 2023 to 2033
  • Figure 59: East Asia Market Y-o-Y Growth Rate By Services, 2023 to 2033
  • Figure 60: East Asia Market Value (US$ Billion) By Type, 2023 to 2033
  • Figure 61: East Asia Market Y-o-Y Growth Rate By Type, 2023 to 2033
  • Figure 62: East Asia Market Value (US$ Billion) By End-user, 2023 to 2033
  • Figure 63: East Asia Market Y-o-Y Growth Rate By End-user, 2023 to 2033
  • Figure 64: East Asia Market Attractiveness Analysis By Country, 2023 to 2033
  • Figure 65: East Asia Market Attractiveness Analysis By Services, 2023 to 2033
  • Figure 66: East Asia Market Attractiveness Analysis By Type, 2023 to 2033
  • Figure 67: East Asia Market Attractiveness Analysis By End-user, 2023 to 2033
  • Figure 68: South Asia & Oceania Market Value (US$ Billion) Forecast, 2023 to 2033
  • Figure 69: South Asia & Oceania Market Absolute $ Opportunity (US$ Billion), 2023 to 2033
  • Figure 70: South Asia & Oceania Market Value (US$ Billion) By Country, 2023 to 2033
  • Figure 71: South Asia & Oceania Market Y-o-Y Growth Rate By Country, 2023 to 2033
  • Figure 72: South Asia & Oceania Market Value (US$ Billion) By Services, 2023 to 2033
  • Figure 73: South Asia & Oceania Market Y-o-Y Growth Rate By Services, 2023 to 2033
  • Figure 74: South Asia & Oceania Market Value (US$ Billion) By Type, 2023 to 2033
  • Figure 75: South Asia & Oceania Market Y-o-Y Growth Rate By Type, 2023 to 2033
  • Figure 76: South Asia & Oceania Market Value (US$ Billion) By End-user, 2023 to 2033
  • Figure 77: South Asia & Oceania Market Y-o-Y Growth Rate By End-user, 2023 to 2033
  • Figure 78: South Asia & Oceania Market Attractiveness Analysis By Country, 2023 to 2033
  • Figure 79: South Asia & Oceania Market Attractiveness Analysis By Services, 2023 to 2033
  • Figure 80: South Asia & Oceania Market Attractiveness Analysis By Type, 2023 to 2033
  • Figure 81: South Asia & Oceania Market Attractiveness Analysis By End-user, 2023 to 2033
  • Figure 82: Middle East & Africa Market Value (US$ Billion) Forecast, 2023 to 2033
  • Figure 83: Middle East & Africa Market Absolute $ Opportunity (US$ Billion), 2023 to 2033
  • Figure 84: Middle East & Africa Market Value (US$ Billion) By Country, 2023 to 2033
  • Figure 85: Middle East & Africa Market Y-o-Y Growth Rate By Country, 2023 to 2033
  • Figure 86: Middle East & Africa Market Value (US$ Billion) By Services, 2023 to 2033
  • Figure 87: Middle East & Africa Market Y-o-Y Growth Rate By Services, 2023 to 2033
  • Figure 88: Middle East & Africa Market Value (US$ Billion) By Type, 2023 to 2033
  • Figure 89: Middle East & Africa Market Y-o-Y Growth Rate By Type, 2023 to 2033
  • Figure 90: Middle East & Africa Market Value (US$ Billion) By End-user, 2023 to 2033
  • Figure 91: Middle East & Africa Market Y-o-Y Growth Rate By End-user, 2023 to 2033
  • Figure 92: Middle East & Africa Market Attractiveness Analysis By Country, 2023 to 2033
  • Figure 93: Middle East & Africa Market Attractiveness Analysis By Services, 2023 to 2033
  • Figure 94: Middle East & Africa Market Attractiveness Analysis By Type, 2023 to 2033
  • Figure 95: Middle East & Africa Market Attractiveness Analysis By End-user, 2023 to 2033

- FAQs -

What will be the future CAGR of the market growth?

The market is expected to grow with a CAGR of 4.5% during the forecast period 2023-2033.

What is the growth rate of East Asia in the global catering services market?

East Asia to exhibit the highest CAGR of 5.3% in the global catering services market

Which service type accounts for the leading share in the market?

Contract Catering Services holds the largest share of 71.0% in the market.

Which region accounts for the leading share in the global catering services market?

North America holds a leading share of 32.0% in the market in 2022.

- Also of Interest -

Bot Services Market

Bot Services Market Analysis by Audio, Video, Text, and Rich Media from 2023 to 2033

HVAC Services Market

HVAC Services Market Study Consulting, Installation, Maintenance & Repair, and Upgrade/Replacement for Heating, Ventilation, and Cooling from 2024 to 2034

Parking Services Market

Parking Services Market Analysis by On-Street Parking and Off-Street Parking for Government/Municipal, Airports, Retail, Corporates, Educational Institutes, and Others from 2023 to 2033

Security Services Market

Security Services Market Analysis, By Service Type (Alarm Systems, Background Verification, Fire & Safety, Patrol Vehicles, Security Guards Services, Security Consulting Services), By End-use Industry (Aviation, Defense & Aerospace, Distribution & Logistics) - Global Market Insights 2022 to 2032

Catering Services Market

Schedule a Call